Link between microstructure and tritiated water diffusivity in
mortars
B. Larbi1, W. Dridi1, P. Le Bescop1, P. Dangla2and L. Petit3
1 CEA, DEN, DPC, SECR, Laboratoire d’Etude du Comportement des Bétons et des Argiles,
F-91191 Gif-sur-Yvette, France
2 Paris Est University, Navier Institute (UMR8205 CNRS/ENPC/IFSTTAR), 2 allée Kepler, F-77420
Marne La Vallée, France
3EDF R&D, Moret sur Loing, France
Abstract. Ions and radionuclide diffusivity in concrete is one of the most important factors that determine service life and safety assessment of cement based structures in nuclear power plants and radioactive-waste repositories. Apart from the influence of cement paste microstructure, the presence of aggregates may have an impact on transport properties of the material. The well-known interfacial transition zone, denoted by ITZ, is created near the aggregates and characterized by a greater porosity. The goal of this study is to investigate the competition between the more diffusing ITZ zone and the less diffusing aggregates. To this end, several series of tritiated water diffusion tests are conducted on mortars characterized by different water-to-cement ratios and sand volume fractions. In parallel, microstructure of these materials is explored by mercury and water porosimetry. It was observed that at low sand content (0% - 50%), diffusion properties of mortars are dominated by aggregates dilution effect. At 60% sand, diffusion increases significantly suggesting that percolation’s pores threshold has been reached. Results indicate also that sand particle size distribution has a great impact on the diffusivity of mortars.
1 INTRODUCTION
Concrete durability continues to be a subject of considerable interest, especially with the use of cement based materials in nuclear industry for the containment of low and intermediate level radioactive waste. One key parameter of the durability of concrete is the diffusivity [1 - 6].
In the literature, a lack of available experimental data subsists about the effective diffusivity of mortars and concretes. The existing experimental data did not allow the comparison or the validation of analytical models due to the differences in the type of cement (CEM I, CEM V...), the techniques used (diffusion cells, electric field, penetration profiles...), the diffusing elements (chloride, oxygen, carbon dioxide, tritium ...) and the degrees of water saturation.
The aim of this study is to carry out an experimental investigation to obtain more information about the link between microstructure and tritiated water diffusivity of saturated mortars. Tritiated water (HTO) was chosen to study the transport properties of mortars for several reasons. HTO, the liquid form of tritium, has negligible interaction with the cement paste hydrates [1], which allows the measurement of effective diffusion coefficients of the material, and subsequently results can be
C
Owned by the authors, published by EDP Sciences, 2013
considered as a reference. Besides, the diffusion of HTO is purely molecular and Fick’s law can then be applied. In this context, several series of tritiated water diffusion tests are conducted on mortars characterized by different water-to-cement ratios and sand volume fractions. In parallel, microstructure of these materials is explored by mercury and water porosimetry.
2 EXPERIMENTAL
2.1 Materials
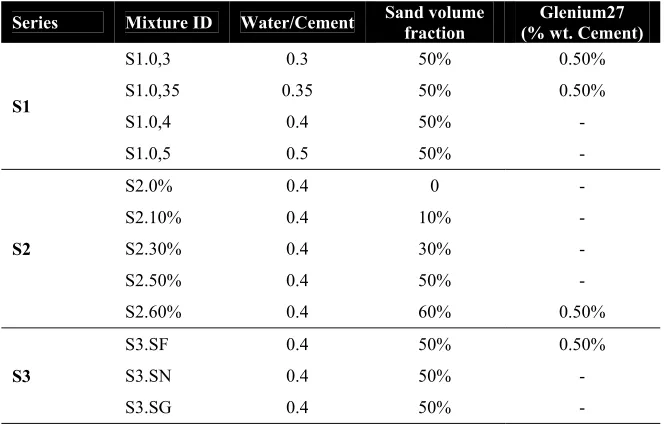
Three different series of mixtures were prepared. In series S1, four water to cement ratios (0.3, 0.35, 0.4 and 0.5) were used. In series S2, five different sand volume fractions were tested (0%, 10%, 30%, 50% and 60%). S3 consisted of three different formulations of three grain size of the same kind of sand: fine siliceous sand (0.125/0.3) labeled SF, standardized (EN 196-9) siliceous sand (0.08/2) labeled SN and a coarse siliceous sand (0.63/2) labeled SG; Figure 1 shows their grain size distribution.
Fig. 1. Particle size distribution of siliceous sand used
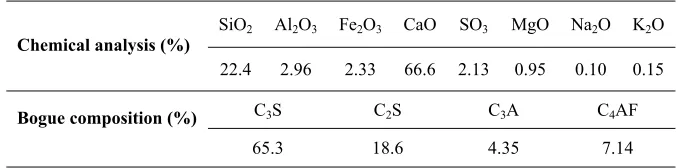
Mortars were prepared by mixing Portland cement (European grade CEM I 52, 5 N CE PM-ES-CP2 NF) with the required quantity of tap water in a mechanical mixer. Chemical analyses of the cement are given in Table 1. Mixtures preparation was based on the standard of normalized mortar fabrication procedure.
Table 1. Chemical and Mineralogical Composition of the CEM I 52, 5 N CE PM-ES-CP2 NF
Chemical analysis (%) SiO2 Al2O3 Fe2O3 CaO SO3 MgO Na2O K2O
22.4 2.96 2.33 66.6 2.13 0.95 0.10 0.15
Bogue composition (%) C3S C2S C3A C4AF
65.3 18.6 4.35 7.14
Glenium® 27 was used as the super plasticizer at low water/cement ratio (w/c = 0.3 and w/c = 0.35) and at high amount of sand grains (S2.60% and S3.SF). The amount of mixing water, sand volume fraction and grain size were varied in order to prepare specimens which had various porosity and various pore distributions. The mixture proportions are given in Table 2.
0% 20% 40% 60% 80% 100%
0,01 0,1 1
R
eta
in
ed
(%
)
Sieve diameter (mm) Sand SN
Sand SF
Table 2. Mixture proportions mortars samples; SG for Coarse Sand, SF for Fine Sand & SN for normalized sand.
Series Mixture ID Water/Cement Sand volume fraction (% wt. Cement) Glenium27
S1
S1.0,3 0.3 50% 0.50% S1.0,35 0.35 50% 0.50% S1.0,4 0.4 50% - S1.0,5 0.5 50% -
S2
S2.0% 0.4 0 -
S2.10% 0.4 10% -
S2.30% 0.4 30% -
S2.50% 0.4 50% -
S2.60% 0.4 60% 0.50%
S3
S3.SF 0.4 50% 0.50% S3.SN 0.4 50% - S3.SG 0.4 50% -
2.2 Specimens preparation and conservation
Cylindrical samples (7Ø×11cm) were cast and the mortars at high sand contents and/or low water/cement ratio were compacted in two layers using a vibrating table in order to evacuate air bubbles. The intensity and duration of vibration was adjusted according to the workability of the mix throughout preventing segregation. The molds with fresh mortars are closed with plugs to avoid evaporation for the first 24 hours. Then, samples are demolded and immersed in a saturated lime solution for 3-month period at 20±1°C.
After the curing period, the samples are sectioned from the center to produce two 6mm thick discs to be used for transport testing. Sectioning was done using diamond abrasive cutter at a low feed rate of 5 mm/s and it was done just few before transport experiments to avoid carbonation and drying. Care was taken to select specimens which are free of defects apparent on either surface.
2.3 Porosity measurements
2.3.1 Free water porosity measurements
The samples were dried in an oven at the temperature of 60°C until constant weight was reached. Even if oven-drying at 105°C has remained the most widely used technique some studies [7] have been suggested that oven drying at 105°C alters pore structure and causes to some hydrates like ettringite and CSH to lose significant amount of non-evaporable water and therefore overestimate total porosity.
Duplicate samples were tested for each formulation and the mean is reported as result. Total porosity was calculated as follows:
s w s
M
M
Md
M
Where Ms is the sample water saturated mass (kg), Md is the sample dried mass (kg), Mw is the
sample mass when immersed in water.
2.3.2 Mercury intrusion porosimetry
Samples were first frozen (-196°C) by immersion in liquid nitrogen during 5 min. After freezing, samples were introduced for 7 days in a freeze-dryer in which vacuum were kept to 10-1 Pa. Tests
were carried out using a Micromeritics porosimeter with a maximum 413MPa injection pressure. The contact angle was 130° for all samples. The minimum pore access diameter reached is about 3 nm. For each formulation, two samples were tested.
2.4 Diffusion measurements
The basic arrangement which was used to measure the steady state diffusion coefficient was similar to that employed by Richet [1] and Nugue et al. [8]. It consists on putting the mortar sample between two compartments. The samples were sealed into position using an epoxy adhesive "Araldite" and by means of O-rings to avoid leakage.
Each compartment of 111±1 ml volume is filled with an alkaline solution (NaOH= 0.1 mol/L; KOH=0.1mol/L; CaO= 2mmol/L) in order to prevent the leaching of the alkaline cement pore solution. Then the cell is left to stand for about fifteen days. After this period, the upstream compartment of each cell was doped with tritiated water. The experiment consisted of measuring the concentration of tritiated water in the downstream compartment as function of time t.
The upstream concentration c0 and downstream one c1 were maintained constant for all t
(c0 = 3.2 106 Bq/L; c1=0) and the initial concentration in the sample was set to zero.
Since the diffusion of tritium is purely molecular, Fick's laws can be applied. The effective tritiated water diffusion coefficients were obtained from the steady state regime according to Fick’s first law of diffusion:
x
c
D
J
(2)Where J represents the diffusive flux and
x
c
the concentration gradient, the radioactivity (Bq / m3)
gradient in our case study.
The experiment consisted of measuring the tritiated water radioactivity (Bq/m3) in the downstream
compartment as function of time t. Solution samples were weighed and counted by β liquid scintillation and data were corrected for radioactive decay.
In order to fulfil boundary conditions, the downstream compartment is drained and filled with a fresh alkaline solution as soon as the downstream activity has reached 3% of the upstream one.
In all diffusion experiments, the temperature was controlled at 20 ±1°C.
3 RESULTS AND DISCUSSION
3.1 Total water porosities
As expected, porosity values increased with the water to cement ratio (w/c) (Figure 2a).
where water porosity value is slightly above dilution line. This confirms that presence of aggregates doesn’t disturb systematically the overall paste matrix porosity, which is expected since these formulations have the same water to cement ratio.
With the same sand volume fraction and the same water to cement ratio, formulations with different particle size distributions have almost the same total porosity value (Figure 2c).
(a) 3 months old; 0,4 water to cement ratio, (b) 3 months old; 50% sand volume fraction, normalized sand (0,08/2 mm) normalized sand (0,08/2 mm)
(c) 3months old; 0,4 water to cement ratio; 50% sand volume fraction
Fig. 2. Effect of water to cement ratio (a) and aggregate volume fraction (b) and sand particle size (c) on
mortars porosities
3.2 Mercury Intrusion Porosimetry
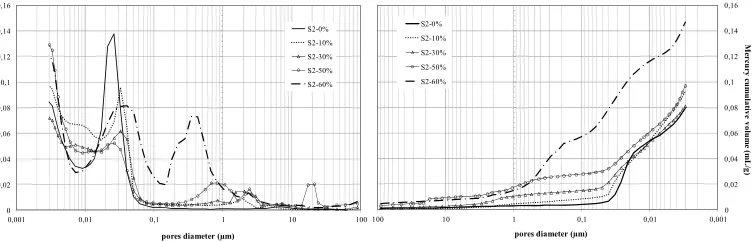
In general, test results show that the presence of aggregates modifies the pore structure which is in agreement with many others studies [10, 11, and 12]. Mortars contain large pore size (0.1 – 1 µm) which is not observed in cement paste (Figure 3, Figure 4, Figure 5).
3.2.1. Effect of aggregates content
For aggregate fraction of less than 50%, the addition of sand tends to reduce the total intruded volume of mercury. At 60% of sand volume fraction, mercury porosity increases slightly from a value of 10.6% at S2.50% mortar to 12.2% at S2.60%. This can also be seen in the cumulative intrusion curve (Figure 3). The curve "S2.60%" changes in slope between 0.1 µm and 1 µm pore
10 12 14 16 18 20
0,2 0,3 0,4 0,5 0,6
F
re
e w
at
er
po
ro
si
ty
(%
)
Water to cement ratio
10,0 15,0 20,0 25,0 30,0 35,0
0 10 20 30 40 50 60
F
ree
wa
ter
p
oro
si
ty
(
%
)
Sand volume fraction (%)
1-Vag
0% 5% 10% 15% 20% 25% 30% Fine Sand
Standardized Sand Coarse Sand
diameter compared to other curves. This evolution can be explained by the interconnection of this family of pores (0.1 µm - 1 µm) for a sand volume fraction value between 50% and 60%. Some researchers attributed this phenomenon to ITZs (Interfacial Transition Zone) percolation [10, 12]. Bourdette et al. [10] developed a model to estimate the degree of interconnection of ITZ from experimental MIP curves. Assuming that the thickness of ITZ is 30 µm, authors found that this threshold is 50% of sand volume fraction, which matches our MIP results. Winslow et al. suggested also that this percolation phenomenon occurs at a sand volume fraction of 45-49% [12].
Fig. 3. Effect of aggregate content on pores connectivity.
Series 2 (3 months old samples; 0,4 water to cement ratio, normalized sand).
3.2.2. Effect of water to cement ratio
For the same sand content (50%), the mercury intrusion results (Figure 4) show the increase of both capillary pores (≥ 0.01 µm) and C-S-H pores (≤ 0.01 µm) with water to cement ratio.
No percolation phenomenon was observed at macro pores (≥ 0.1 µm). It seems that increasing water to cement ratio at the same sand volume fraction does not promote interconnection of macro pores (Figure 4).
Fig. 4. Effect of water to cement ratio on pores connectivity.
Series 1 (3 months old samples, 50% sand volume fraction, normalized sand).
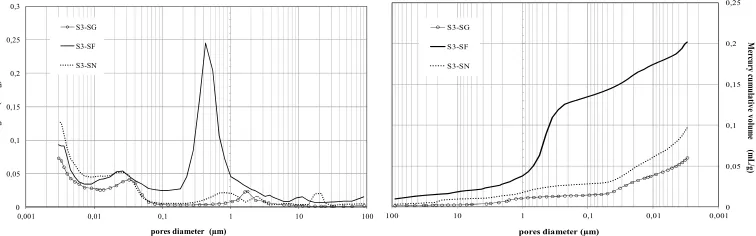
3.2.3. Effect of sand particle size
Between fine and coarse particle sizes, there is great difference in incremental porosity distribution and also in cumulative intrusion curve (Figure 5). A greater connectivity was observed between 0.1 µm and 1 µm. Mercury total porosity for the fine sand (SF) mixture is higher than that of the coarse (SG) and normalized (SN) sand, in spite of quite similar total water porosities of the three mixtures (Table 3). 0 0,02 0,04 0,06 0,08 0,1 0,12 0,14 0,16 0,001 0,01 0,1 1 10 100 M er cu ry c u m u lat ive vol um e ( m L /g)
pores diameter (µm) S2-0% S2-10% S2-30% S2-50% S2-60% 0 0,02 0,04 0,06 0,08 0,1 0,12 0,14 0,16
0,001 0,01 0,1 1 10 100
d V /d log D (m L /g)
pores diameter (µm)
S2-0% S2-10% S2-30% S2-50% S2-60% 0 0,02 0,04 0,06 0,08 0,1 0,12 0,14 0,16
0,001 0,01 0,1 1 10 100
d V /d lo g D ( m L /g )
pores diameter (µm)
S1-0,3 S1-0,35 S1-0,4 S1-0,5 0 0,05 0,1 0,15 0,2 0,25 0,001 0,01 0,1 1 10 100 M er cu ry C u m u lat ive V ol u m e ( m L /g)
pores diameter (µm) S1-0,3
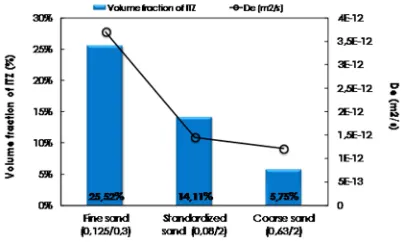
Moreover, statistical laws are used to estimate volume fractions of ITZ for each formulation. These laws are developed by Lu and Torquato [7] and applied by Bentz and Garboczi [8] to mortars and concretes. These analytical calculations were conducted by considering the mortar as a matrix of cement paste in which are embedded inclusions of aggregates surrounded by a 20 μm layer thick representing ITZ. Results show that the corresponding ITZ volume fraction of S3.SG mixture is 5.75% that of S3.SF mixture is 25.5% (about four times higher). This large difference is expected since ITZ is modeled as uniform shell of constant thickness surrounding each aggregate and fine sand mortar (S3.SF) has much more small grains with the same sand volume fraction as coarse sand grains (S3. SG). Important ITZ volume fraction may be considered one of the causes of higher connectivity of large pores (≥ 0.1 µm) in fine sand mortar (S3.SF).
Fig. 5. Effect of sand particle size on pores connectivity; SG for Coarse Sand, SF for Fine Sand & SN for
normalized sand. Series 3 (3months old samples; 0,4 water to cement ratio, 50% sand volume fraction).
3.3 Tritiated Water diffusivity in mortars
In Figure 6, effective diffusion coefficients De is plotted against aggregate volume fraction, water to
cement ratio and aggregate size distribution. Each data point is an average of two replicates and the errors bars indicates +/- standard deviation. The variability between replicates is relatively small compared to the one between different formulations so that averaging permit meaningful comparison. The estimated measurement error takes into account the uncertainties related to the initial concentration of tritiated water c0, the thickness and the surface of the sample and the
accuracy of the tritium concentration measurement in the downstream compartment (liquid scintillation). This error is about 12% [1].
3.3.1 Effect of aggregates content
At low sand content (0-50%), the diffusivities of the 0.4 w/c ratio mortars decreased with sand content by a factor of 1.5 to 2, but increased significantly at 60% (Figure 6a).
Measured diffusivities for series S2 are compared to (1-Vag) linear plot representing theorical case of
porous medium diluted by non-porous aggregates (Figure 6a). The comparison shows that experimental data follows the line of perfect dilution at less than 50% sand content, but departs from it, at 60% sand mortar diffusivity is widely higher than of a perfectly diluted mortar at the same sand volume fraction. It has been suggested percolation occurred at higher sand contents and that there is a critical sand volume threshold between 50% and 60% above which diffusion increases significantly. This result has been confirmed with MIP results. Similar results were obtained by Bourdette [21] from measurement of tritiated water diffusivity on mortars and by Houst et al. [23] from measurements of diffusion coefficient of oxygen and carbon dioxide gases. Authors found a critical sand volume threshold respectively on 52% [21] and 55% [23] of sand volume fraction and they attributed the significant increase on diffusivity to ITZs percolation. In the case of our study, the
0 0,05 0,1 0,15 0,2 0,25 0,3
0,001 0,01 0,1 1 10 100
d
V
/d
lo
g
D
(
m
L
/g
)
pores diameter (µm) S3-SG
S3-SF S3-SN
0 0,05 0,1 0,15 0,2 0,25
0,001 0,01
0,1 1
10 100
M
ercu
ry
cu
mu
la
tiv
e
vo
lu
m
e
(
m
L
/g
)
pores diameter (µm)
ITZ is not yet experimentally characterized or quantified. Further studies on SEM images analysis and 3D microstructure modeling will be initiated in order to characterize this interface and evaluate his impact on transport macro properties.
3.3.2 Effect of water to cement ratio
Experimental results prove that diffusion coefficient increases with water to cement ratio. Consistent with what was obtained on water porosimetry, there is a break in slope at about w/c = 0.38, characteristic of a change of porosity (Figure. 6b).
3.3.3 Effect of sand particle size
The effect of particle size distribution is described in (Figure 6c) where variation of effective diffusivity is correlated with the estimated volume fractions of ITZ in each formulation (§ 3.2.3). The results show an important influence of aggregate particle size on diffusion process. Fine sand mortar (S3.SF) diffusivity is three time higher than that of coarse sand mortar (S3.SG).
(a) 3 months old; 0,4 water to cement ratio, (b) 3 months old; 50% sand volume fraction, normalized sand (0,08/2 mm) normalized sand (0,08/2 mm)
(c) 3months old; 0,4 water to cement ratio; 50% sand volume fraction
Fig. 6. Effect of water to cement ratio (a), aggregate volume fraction (b) and aggregate particle size (c) on
mortars diffusivity
5,0E-13 1,0E-12 1,5E-12 2,0E-12 2,5E-12 3,0E-12 3,5E-12 4,0E-12
0 10 20 30 40 50 60 70
De
(
m
2
/s
)
Sand volume fraction (%) Experimental data
4 CONCLUSIONS
This study aims at improving the understanding of the transport properties of mortars according to their formulations. The goal is to obtain a better estimate of the effective diffusivity in the liquid phase by considering the link between microstructure and transport properties in mortars.
The results show that below 50% sand, diffusivities decreased due to dilution effect. At 60% sand contents, diffusion increased significantly suggesting that a critical sand volume threshold was reached and percolation was occurred. Results also indicate that sand particle size distribution has a great impact on the diffusivity of mortars.
5 REFERENCES
1. C. Richet, Ph.D. Thesis; Université Paris XI Orsay (1992) (in French)
2. S. Bejaoui, J. Sercombe, C. Mugler, H. Peycelon, Transp. Porous Med. 69, 89-107 (2007) 3. S. Bejaoui , B. Bary, Cem. Conc. Res. 37, 469-480 (2007)
4. B. Bary, S. Bejaoui, Cem. Conc. Res. 36, 245-258 (2006)
5. E. Stora, B. Bary, Q.C. He, Transp. Porous Med. 73(3), 279-295 (2007)
6. S. Bejaoui, B. Bary, S. Nitsche, D. Chaudanson, C. Blanc, REGC 10/9, 1073-1106 (2006) 7. C. Gallé, Cem. Concr. Res. 31, 1467-1477 (2001)
8. F. Nugue, M.-P.Yssorche-Cubaynes, J.P. Ollivier, Cem. Concr. Res. 37, 1145-1151 (2007) 9. T.C. Powers, T.L. Brownyard, J. Am. Concr. Inst. 18 (5), 549– 602 (1947)
10. B. Bourdette, E. Ringot, J.P. Ollivier, Cem. Concr. Res. 25, 741-751 (1995) 11. S. Caré, Cem. Concr. Res. 33, 1021 – 1028, (2003)
12. D. N. Winslow, M. D. Cohen, D.B. Bentz, K.A. Snyder, E.J. Garboczi, Cem. Concr. Res. 24, 25-37 (1994)
13. B. Lu, S. Torquato, Phys. Rev. A. 45 (8), 5530-5540 (1992) 14. E.J. Garboczi, D.P. Bentz, Adv. Cem. Bas. Mat. 8, 77-88, (1998)
15. J.P. Ollivier, J.C. Maso, B. Bourdette, Adv. Cem. Bas. Mat. 2, 30-38 (1995) 16. P.J.M. Monteiro, J.C. Maso, J.P.Ollivier, Cem. Concr. Res. 15, 953-958 (1985) 17. K.L. Scrivener, A.K. Crumbie, P.L. Pratt, S.Mindess, SP Shah (éd.). 114, 87 (1988) 18. K.L. Scrivener, K.M. Nemati, Cem. Concr. Res. 26, 35-40 (1996)
19. S. Diamond, J. Huang, Cem. Concr. Comp. 23, 179-188 (2001) 20. K. Head, R. Buenfeld, Cem. Concr. Comp. 36, 337-345 (2005)
21. B. Bourdette, Ph.D. Thesis; Institut National des Sciences Appliqués de Toulouse (1994) (in French)
22. E.J. Garboczi, D.P. Bentz, Cem. Concr. Res. 10, 293 – 300, (1996)