
R E S E A R C H
Open Access
Methodological choices affect cancer
incidence rates: a cohort study
Hannah L. Brooke
*, Mats Talbäck, Maria Feychting and Rickard Ljung
Abstract
Background:Incidence rates are fundamental to epidemiology, but their magnitude and interpretation depend on
methodological choices. We aimed to examine the extent to which the definition of the study population affects cancer incidence rates.
Methods:All primary cancer diagnoses in Sweden between 1958 and 2010 were identified from the national
Cancer Register. Age-standardized and age-specific incidence rates of 29 cancer subtypes between 2000 and 2010 were calculated using four definitions of the study population: persons resident in Sweden 1) based on general population statistics; 2) with no previous subtype-specific cancer diagnosis; 3) with no previous cancer diagnosis except non-melanoma skin cancer; and 4) with no previous cancer diagnosis of any type. We calculated absolute and relative differences between methods.
Results:Age-standardized incidence rates calculated using general population statistics ranged from 6% lower (prostate cancer, incidence rate difference: -13.5/100,000 person-years) to 8% higher (breast cancer in women, incidence rate difference: 10.5/100,000 person-years) than incidence rates based on individuals with no previous subtype-specific cancer diagnosis. Age-standardized incidence rates in persons with no previous cancer of any type were up to 10% lower (bladder cancer in women) than rates in those with no previous subtype-specific cancer diagnosis; however, absolute differences were <5/100,000 person-years for all cancer subtypes.
Conclusions:For some cancer subtypes incidence rates vary depending on the definition of the study population. For these subtypes, standardized incidence ratios calculated using general population statistics could be misleading. Moreover, etiological arguments should be used to inform methodological choices during study design.
Keywords:Incidence rate, Cancer, Methods, Study population, Standardized incidence ratio
Background
Incidence rates are fundamental to descriptive epidemi-ology for quantifying disease occurrence in populations, and to analytical epidemiology for comparing disease oc-currence according to exposure status [1]. They are cal-culated simply as the number of new cases of disease per unit of person-time at risk of becoming a case. How-ever, calculating incidence rates for cancer is more com-plex, since one individual may have multiple primary cancer diagnoses over time. How to handle multiple cancers is a common design issue to be considered in any cohort study.
Cancer registries often calculate incidence rates based on aggregate general population statistics, i.e., the total number of new primary tumors recorded each year divided by the mean population that year, regardless of previous cancer diagnoses and exact person-time accumulated [2, 3]. As such, prevalent cases are included in both the numer-ator and the denominnumer-ator. When individual-level data are available, the study population can be defined more cisely, usually in one of three ways: 1) persons with no pre-vious diagnosis of the cancer subtype of interest, e.g., [4]; 2) persons with no previous diagnosis of any cancer subtype except non-melanoma skin cancer, e.g., [5]; and 3) persons with no previous diagnosis of any cancer subtype, e.g., [6]. Moreover, individual-level data enable person-time to be measured exactly. Variation in the precision of the numer-ator and the denominnumer-ator may cause incidence rates based * Correspondence:[email protected]
Unit of Epidemiology, Institute of Environmental Medicine, Karolinska Institutet, 171 77, StockholmPO Box 210Sweden
on aggregate population data to deviate from incidence rates based on individual-level data. However, the magni-tude and direction of deviation between these methods is unclear. It is essential to evaluate these differences as stan-dardized incidence ratios, calculated to examine the effect of an exposure or intervention in a subpopulation with individual-level data, often depend on aggregate general population statistics to estimate the expected number of cases.
In studies of cancer incidence with individual-level data, the choice of study population is important and may influence the estimated incidence rate. For example, if a cancer diagnosis is associated with higher incidence of a second cancer subtype, then the incidence rate of the second cancer subtype will be higher if persons with a previous cancer diagnosis are included in the calcula-tion than if they were excluded. However, the most ap-propriate definition for the study population may not be clear and depends on the research question at hand. For descriptive purposes it would be prudent to include all individuals with a new primary cancer diagnosis regard-less of previous cancer diagnoses. However, for analytical epidemiology, whether individuals with a previous can-cer diagnosis should be included in the study population depends on whether the previous cancer is considered to be a confounder (i.e., associated with the exposure and the second cancer of interest). For example, a previ-ous cancer diagnosis may lead to changes in lifestyle or behavior, while the treatment of a previous cancer can affect future cancer risk. Cancer diagnostics and treat-ments continue to improve, so the number of cancer survivors at risk of a new cancer diagnosis continues to increase [7]. It is therefore important to examine how the definition of the study population influences estimates of cancer incidence rates, particularly as variation in the methods used to calculate cancer incidence rate may re-duce comparability between studies. Although the extent to which such methodological choices influence the over-all incidence rate may have been examined within cancer registries, to our knowledge this has not previously been quantified in peer-reviewed scientific literature.
We aimed to evaluate the magnitude and direction of de-viation between incidence rates calculated from aggregate general population statistics and individual-level data. We further aimed to assess the extent of differences in cancer incidence rates calculated using three common definitions of the study population in individual-level data. Although we focus on cancer incidence rates, the principles of this paper may also be relevant for other disease outcomes.
Methods Study design
We conducted a population-based open cohort study of all individuals officially resident in Sweden between January 1,
2000, and December 31, 2010. We used the Total Popula-tion Register to identify the cohort and to ascertain age and sex [8]. The cohort was linked to the Cancer Register and the Cause of Death Register using the unique personal identity number assigned to each individual registered in Sweden [9]. All primary malignant cancer diagnoses be-tween January 1, 1958, and December 31, 2010, were iden-tified from the Cancer Register. The Cancer register has an estimated completeness of at least 96%; however, it is not considered complete before 1960 [10]. Aggregate general population statistics on the mean annual population be-tween 2000 and 2010 were retrieved from Statistics Sweden. In the individual-level analyses, follow-up began on January 1, 2000, and participants were censored on 1) emigration before December 31, 2010, 2) death before De-cember 31, 2010, or 3) end of study period, i.e., DeDe-cember 31, 2010. Ethical approval for the study was granted by the Regional Ethical Review Board, Stockholm, Sweden (2011/ 634-31/4).
Outcomes
We categorized cancer into 29 subtype groups in ac-cordance with the cancer dictionary used in the World Health Organization (WHO) cancer mortality database [11]. Coding was based on the International Statistical Classification of Diseases and Related Health Problems, Seventh Revision (ICD-7), as this was available for the whole period 1958–2010. The 29 cancer categories (and corresponding ICD-10 codes) were lip, oral cavity and pharynx (C00-C14); nasopharynx (C11); esophagus (C15); stomach (C16); intestine (C17-C21); colon (C18); colon, rectum, and anus (C18-C21); rectum and anus (C19-C21); liver (specified as primary) (C22); gallbladder (C23-C24); pancreas (C25); larynx (C32); lung (including trachea and bronchus) (C33-C34); melanoma of skin (C43); breast (C50, female only); uterus (C53-C55); cervix uteri (C53); corpus uteri (C54); ovary (C56); prostate (C61); testis (C62); kidney (C64); bladder (C67); brain and central ner-vous system (C70-C72); thyroid (C73); Hodgkin lymph-oma (C81); non-Hodgkin lymphlymph-oma (C82-C86, C96); multiple myeloma (C88 + C90); and leukemia (C91-C95) [11]. The four WHO categories, intestines (C17-C21), colon (C18), colon, rectum, and anus (C18-C21), and rec-tum and anus (C19-C21), are overlapping groups. All groups were included for consistency with the classifica-tion system. However, when discussed as a whole, these groups will be referred to herein as colorectal cancer. Al-though there were cases of male breast cancer, these were not presented since there were very low numbers.
Statistical analysis
four different methods (for further explanation see Table 1):
1) Incidence rates calculated from aggregate general population statistics, herein referred to as aggregate population incidence rates. All new primary malignant tumors recorded in the Cancer Register during the study period were included. The person-time at risk was estimated as the mean population each year, summed over the study period. This replicates the method used by cancer registries to calculate incidence rates [2, 3].
2) Incidence rates calculated from individual-level data with the study population defined as persons with no previous subtype-specific cancer diagnosis, i.e., excluding individuals with a previous diagnosis of the cancer subtype of interest, herein referred to as subtype-specific incidence rates.
3) Incidence rates calculated from individual data with the study population defined as persons with no previous cancer diagnosis of any type except non-melanoma skin cancer, i.e., excluding individuals with any previous cancer diagnosis, except if the previous cancer was non-melanoma skin cancer, herein referred to as first cancer except non-melanoma skin cancer incidence rates.
4) Incidence rates calculated from individual data with the study population defined as persons with no previous cancer diagnosis of any type, i.e., excluding individuals with any previous cancer diagnosis, herein referred to as first-ever cancer incidence rates.
Age-standardized incidence rates were calculated as described by the International Agency for Research on Cancer [3]. Incidence rates standardized to the world standard population suggested by Segi 1960 and revised by Doll et al., 1966 are presented in the results [3]. In addition, incidence rates standardized to the Swedish population in 2000 are provided in Additional File 1: Table S1 [2].
We calculated incidence rate differences (IRD) and inci-dence rate ratios (IRR) for each different method of calcu-lating incidence rates. We used subtype-specific incidence rates as the reference rates. As such, there are six compar-isons (three IRD and three IRR) for each cancer subtype: 1) aggregate population incidence rates (any cancer diag-nosis during the study period) vs. subtype-specific inci-dence rates (first cancer of that subtype); 2) first cancer except non-melanoma skin cancer incidence rates (first cancer of any type, except non-melanoma skin cancer) vs. subtype-specific incidence rates (first cancer of that sub-type); and 3) first-ever cancer incidence rates (first cancer
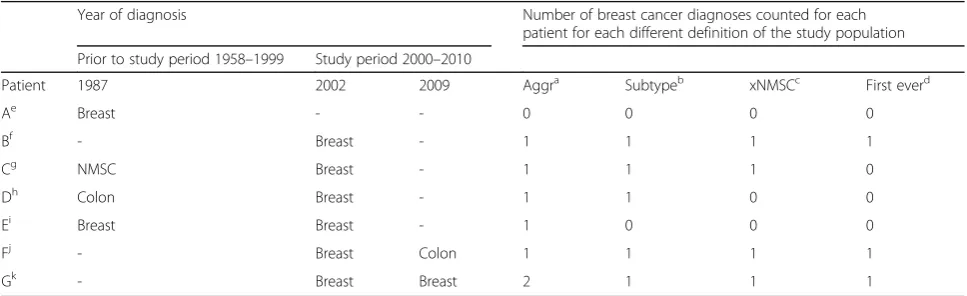
Table 1Four definitions of the study population applied to hypothetical data from seven patients
Year of diagnosis Number of breast cancer diagnoses counted for each
patient for each different definition of the study population Prior to study period 1958–1999 Study period 2000–2010
Patient 1987 2002 2009 Aggra Subtypeb xNMSCc First everd
Ae Breast - - 0 0 0 0
Bf - Breast - 1 1 1 1
Cg NMSC Breast - 1 1 1 0
Dh Colon Breast - 1 1 0 0
Ei Breast Breast - 1 0 0 0
Fj - Breast Colon 1 1 1 1
Gk - Breast Breast 2 1 1 1
Cancer diagnoses prior to (1958–1999) and during (2000–2010) the study period, and number of breast cancer (BC) diagnoses counted using each definition of the study population (SP)
a
Aggr, SP based on aggregate general population statistics
b
Subtype, SP excluding individuals with a previous diagnosis of the cancer subtype of interest
c
xNMSC, SP excluding individuals with any previous cancer diagnosis, except if the previous cancer was non-melanoma skin cancer
d
First ever, SP excluding individuals with any previous cancer diagnosis
e
Patient A: excluded from all methods as BC in 1987 was prior to the study period
f
Patient B: counted in all methods as there was no previous cancer diagnosis before BC in 2002
g
Patient C: BC in 2002 is counted in Aggr, Subtype and xNMSC, but not in First ever as the first ever cancer diagnosis was a non-melanoma skin cancer (NMSC) in 1987
h
Patient D: BC in 2002 is counted once in Aggr and once in Subtype, as it is the first subtype specific cancer. However, due to a previous colon cancer diagnosis in 1987 BC in 2002 is not counted in xNMSC or First ever
I
Patient E: BC in 2002 is counted once in Aggr. However, the patient is excluded from all other methods as the first BC occurred in 1987, which is not within the study period
j
Patient F: BC in 2002 is counted once in all methods (similar to patient B). The diagnosis of colon cancer in 2009 does not influence the incidence of BC
k
of any type) vs. subtype-specific incidence rates (first can-cer of that subtype).
Results
Cohort description
In total 10,515,591 individuals (49.7% males) were in-cluded in the cohort. Based on aggregate population data, a total of 99,799,233 years of person-time was ac-cumulated, of which 29.8%, 26.9%, 25.9%, 15%, and 2.5% was in the age groups 0–24, 25–44, 45–64, 65–84, and 85+ years, respectively. During the study period 476,719 new primary tumors, in mutually exclusive cancer sub-types, were reported to the Cancer Registry. Based on individual-level data, 459,174 of these tumors were diag-nosed in persons with no previous subtype-specific can-cer diagnosis, 410,428 were diagnosed in persons with no previous cancer diagnosis of any type except non-melanoma skin cancer, and 406,633 were diagnosed in persons with no previous cancer diagnosis of any type.
Aggregate population incidence rates compared to subtype-specific incidence rates
After age-standardization, aggregate population inci-dence rates were ≥5% higher than subtype-specific inci-dence rates for three cancer subtypes: lip, oral cavity, and pharynx; breast (in women); and melanoma of skin (Fig. 1 and Additional file 1: Table S1). The greatest dif-ference was for breast cancer in women, for which age-standardized aggregate population incidence rates were 8% higher than subtype-specific incidence rates (IRD: 10.5/100,000 person-years). However, age-standardized aggregate population incidence rates were 6% lower than subtype-specific incidence rates for prostate cancer (IRD: -13.5/100,000 person-years) and 1% lower for cor-pus uteri and uterus cancer (IRD: -0.3/100,000 person-years) (Fig. 1 and Additional file 1: Table S1). We found no difference between age-standardized aggregate popu-lation incidence rates and subtype-specific incidence rates in men and women for cancers of nasopharynx, esophagus, stomach, liver, gallbladder, pancreas, and ovary, or for Hodgkin lymphoma, and multiple myeloma (Fig. 1 and Additional file 1: Table S1).
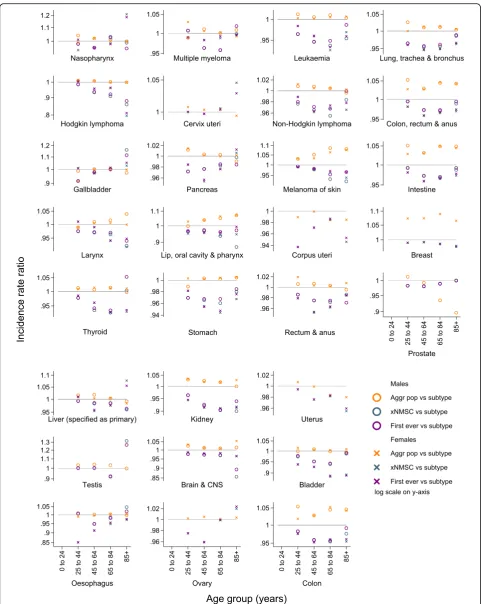
Age-group-specific incidence rates primarily followed the patterns described above. The greatest absolute differences between methods reflected age-specific peaks in incidence rates (Fig. 2, Additional file 1: Tables S2 and S3). For ex-ample, the greatest difference between methods for testicu-lar cancer was in the 25–44 years age group, while for lung, kidney, and breast cancers the greatest absolute difference was in the 65–84 years age group. For the most part the relative differences between aggregate population incidence rates and subtype-specific incidence rates were rather stable across age groups in both sexes (Fig. 3, Additional file 1: Tables S2 and S3).
First cancer except non-melanoma skin cancer incidence rates compared to subtype-specific incidence rates
Incidence rates were similar for first cancer except non-melanoma skin cancer and first-ever cancer. As such, first cancer except non-melanoma skin cancer incidence rates compared to subtype-specific incidence rates re-flect the results described below for first-ever cancer in-cidence rates compared to subtype-specific inin-cidence rates.
First-ever cancer incidence rates compared to subtype-specific incidence rates
Age-standardized first-ever cancer incidence rates were ≥5% lower than subtype-specific incidence rates for can-cers of lip, oral cavity, and pharynx; esophagus (females); lung, trachea, and bronchus (females); kidney; bladder (females); and thyroid (males); and leukemia (females) (Fig. 1 and Additional file 1: Table S1). Despite this, the absolute difference in age-standardized incidence rates was less than 5 cases per 100,000 person-years for all subtypes (Fig. 1 and Additional file 1: Table S1).
Age-group-specific analyses indicated that, on an abso-lute scale, first-ever cancer incidence rates were often progressively lower than subtype-specific incidence rates in the 45–64 and 65–85 years age groups. For some can-cer subtypes, for example, Hodgkin lymphoma, uterus, and breast cancers, this progression continued into the oldest age group. For other cancer subtypes, for ex-ample, lung and colorectal cancers, the absolute differ-ence between these methods was reduced in the oldest age group, or the pattern was reversed (Fig. 2, Additional file 1: Tables S2 and S3). For most cancer subtypes the relative difference between first-ever cancer incidence rates and subtype-specific incidence rates across age groups followed a similar pattern to the absolute differ-ences (Fig. 3, Additional file 1: Tables S2 and S3).
Discussion
older populations and better cancer survival, the importance of these methodological issues will become greater.
Strengths and limitations
The main strengths of this study were the very large sample size and whole population coverage. The study also had some limitations. First, 40% of individuals in-cluded in the study were born before the cancer register in Sweden started (1958). However, 96.8% of these per-sons were younger than 40 years of age in 1958, so this will have little effect on the results for the period 2000– 2010. In addition, we did not have information about can-cer diagnoses before individuals immigrated to Sweden because cancers are registered in the country of diagnosis. However, the patterns of results were obtained when the analysis was restricted to individuals born in Sweden (Additional file 1: Table S4). In Sweden death-certificate-only and death-certificate-initiated cancer cases are not reported to the cancer register. However, since these data will be missing for all methods of calculating incidence rate, this underestimation will not impact the comparison between methods. There may be more advanced ways to correct the person-years at risk that were beyond the scope of the current paper but should be kept in mind. For example, excluding hysterectomized women from the risk population in calculations of uterus cancer or chole-cystectomized persons from the risk population in calcula-tions of gallbladder cancer. Finally, basal cell carcinoma has not been registered in Sweden so is one category of cancer that was not possible to include in this paper.
Aggregate population incidence rates compared to subtype-specific incidence rates
Aggregate population incidence rates were higher than subtype-specific incidence rates for several cancer sub-types. For cancer subtypes that showed this pattern, ex-cluding individuals with a previous subtype-specific cancer diagnosis from the study population reduced the numer-ator to a greater extent than the denominnumer-ator. This can be explained if persons with a previous cancer diagnosis are more likely to have a subsequent diagnosis of the same cancer subtype than persons without a previous diagnosis of that subtype. Supporting this, the difference between these two methodologies was greatest for cancer subtypes with a higher chance of a second primary cancer of the same subtype, for example breast cancer in women [12] and colorectal cancer [13].
For prostate cancer aggregate population incidence rates were lower than subtype-specific incidence rates. As pros-tate cancer has a low fatality level there were many preva-lent cases in the aggregate population statistics that were excluded when using individual-level data. As such, re-moving those with a previous subtype-specific cancer diagnosis reduced the denominator to a greater extent than the numerator.
For highly fatal cancers, such as pancreas cancer, we found no difference between aggregate population inci-dence rates and subtype-specific inciinci-dence rates, as ex-pected. This is because there were very few prevalent cases to influence the denominator and a very low chance of a second diagnosis of the same subtype.
Differences between aggregate population incidence rates and subtype-specific incidence rates are important for two reasons. First, in planning health service provision, the use of aggregate population data is appropriate for most cancer subtypes, even if they are overestimated com-pared to individual-level data, as individuals with a second primary tumor of the same subtype still need access to health care despite their previous diagnosis. However, when aggregate population data underestimate incidence rates compared to individual-level data, there may be in-adequate provision of services for individuals diagnosed with these cancer subtypes. Nonetheless, besides incidence rates health care planning is based on actual number of cases, so this issue may be minimized. Second, the effect of an exposure or intervention in a subpopulation with individual-level data can be examined using standardized incidence ratios. In such studies aggregate population sta-tistics are often used to calculate the expected number of cases. Different methodologies for calculating incidence rates using the individual-level data compared to the ag-gregate population data will results in distortion of the standardized incidence ratios. In turn this may lead to im-portant exposures being disregarded, while redundant in-terventions may be deemed effective, or vice versa.
First-ever cancer, and first cancer except for non-melanoma skin cancer incidence rates compared to subtype-specific incidence rates
First-ever cancer, and first cancer except for non-melanoma skin cancer incidence rates were often lower than subtype-specific incidence rates. This can be ex-plained since persons with a previous cancer diagnosis are more likely to have a subsequent cancer diagnosis than persons without a previous cancer diagnosis. For (See figure on previous page.)
example, risk of subsequent neoplasm is raised in survi-vors of childhood cancer [14], and in adults diagnosed with first primary breast cancer (premenopausal), malig-nant melanomas, bladder, and head and neck cancers [15]. Increased risk of a second primary cancer may be re-lated to ongoing surveillance of the patient leading to greater detection, subsequent cancers may be linked etio-logically including via shared behavioral and genetic risk factors, and finally, treatment of the first malignancy may increase the risk of subsequent disease. However, the ab-solute difference between the methods for most cancer subtypes was small, particularly for age-standardized inci-dence rates. We therefore suggest that for most cancer subtypes the comparability between studies using different definitions of the study population is reasonable, especially if age-standardized rates are presented.
When studying cancer subtypes with greater differ-ences between methods, careful consideration should be given to whether the previous cancer diagnosis is likely to be a confounder. If there is no reason to be-lieve that the previous cancer is a confounder, then there is no reason to exclude individuals with a previ-ous cancer. Our a priori hypothesis was that that there might be larger differences between incidence rates calculated with different study populations for leukemia, due to the increased risk of leukemia after treatment for a previous cancer subtype [16, 17]. However, there were not markedly greater differences between methodologies for leukemia than for other cancer subtypes. This indicates that persons with a previous cancer diagnosis may be more likely to have a subsequent cancer diagnosis than persons without a previous cancer diagnosis due to shared risk factors, rather than the previous cancer acting as a true con-founder. As such, only excluding individuals with a previous cancer of the same subtype may often be the most appropriate way to define the study population. This is of particular relevance for studies with limited statistical power. Only excluding individuals with a previous subtype-specific cancer diagnosis, rather than all those with any previous cancer diagnosis, will in-crease the number of cases available for analysis and thus increase the statistical power.
Age-group-specific incidence rates
Relative differences between aggregate population inci-dence rates and subtype-specific inciinci-dence rates were ra-ther stable across age groups. In contrast, differences
between first-ever cancer incidence rates and subtype-specific incidence rates varied by age group. The discus-sion above could therefore have a lesser or greater importance, depending on the age group being studied and the cancer outcome of interest.
Conclusions
Cancer incidence rates vary depending on the defin-ition of the study population. However, for most can-cer subtypes, methods are broadly comparable when age-standardized incidence rates are considered. Nonetheless, when calculating cancer incidence rates one should consider the purpose of the information, the cancer outcome of interest, and the potential im-precision the choice of the numerator and the de-nominator might bring. This is particularly important if standardized incidence ratios are calculated based on general population statistics. The most appropriate definition of the study population depends on etio-logical arguments. However, defining the study popu-lation as individuals with no previous subtype-specific cancer diagnosis may be advantageous, particularly in studies with limited statistical power.
Additional file
Additional file 1:Table S1.Crude and age-standardized incidence rates (IR) (95% confidence intervals [95% CI]) per 100,000 person-years for 29 cancer subtypes in Swedish males and females between 2000 and 2010. IRs were calculated using four definitions of the study population: per-sons resident in Sweden 1) based on aggregate general population statis-tics (Aggr); 2) with no previous subtype-specific cancer diagnosis (subtype); 3) with no previous cancer diagnosis except non-melanoma skin cancer (xNMSC); and 4) with no previous cancer diagnosis of any type (First ever). IRs are presented with incidence rate differences (IRD) and incidence rate ratios (IRR) compared to subtype-specific IRs (ref).
Table S2.Age-group-specific incidence rates (IR) (95% confidence intervals
[95% CI]) per 100,000 person-years for 25 cancer subtypes in Swedish males between 2000 and 2010. IRs were calculated using four definitions of the study population: persons resident in Sweden 1) based on aggregate general population statistics (Aggr); 2) with no previous subtype-specific cancer diagnosis (subtype); 3) with no previous cancer diagnosis except non-melanoma skin cancer (xNMSC); and 4) with no previous cancer diagnosis of any type (First ever). IRs are presented with incidence rate differences (IRD) and incidence rate ratios (IRR) compared to subtype-specific IRs (ref).Table S3. Age-group-specific incidence rates (IR) (95% confidence intervals [95% CI]) per 100,000 person-years for 27 cancer subtypes in Swedish females between 2000 and 2010. IRs were calculated using four definitions of the study population: persons resident in Sweden 1) based on aggregate general population statistics (Aggr); 2) with no previous subtype-specific cancer diagnosis (subtype); 3) with no previous cancer diagnosis except non-melanoma skin cancer (xNMSC); and 4) with no previous cancer diagnosis of any type (First ever). IRs are presented with incidence rate differences (IRD) and incidence rate ratios (IRR) compared to subtype-specific IRs (ref). (See figure on previous page.)
Table S4.Crude and age-standardized incidence rates (IR) (95% confidence intervals [95% CI]) per 100,000 person-years for 29 cancer subtypes in Swedish males and females between 2000 and 2010, including only individuals born in Sweden. IRs were calculated using four definitions of the study population: persons resident in Sweden 1) based on aggregate general population statistics (Aggr); 2) with no previous subtype-specific cancer diagnosis (subtype); 3) with no previous cancer diagnosis except non-melanoma skin cancer (xNMSC); and 4) with no previous cancer diagnosis of any type (First ever). IRs are presented with incidence rate differences (IRD) and incidence rate ratios (IRR) compared to subtype-specific IRs (ref). (DOCX 185 kb)
Abbreviations
IRD:Incidence rate differences; IRR: Incidence rate ratios
Funding
Hannah Brooke is a COFAS Marie Curie Fellow with funding from Forte (grant registration number 2015–01228). This work was also supported by Karolinska Institutet. The funding bodies had no role in study design; in the collection, analysis and interpretation of data; in the writing of the report; or in the decision to submit the article for publication.
Availability of data and materials
According to Swedish law the data cannot be placed in a publicly available repository. Researchers can after ethical approval apply for data from Statistics Sweden and the Swedish National Board of Health and Welfare.
Authors’contributions
RL and MT were responsible for the conception of the study. HLB, RL, and MT were responsible for the study design. MF was responsible for the acquisition of data. HLB was responsible for the analysis of the data and drafting the manuscript. All authors contributed to the interpretation of the results and were involved in critically revising the manuscript for important intellectual content. All authors have given final approval of the version to be published and have participated sufficiently in the work to take public responsibility for appropriate portions of the content. All authors have agreed to be accountable for all aspects of the work in ensuring that questions related to the accuracy or integrity of any part of the work are appropriately investigated and resolved.
Competing interests
The authors declare that they have no conflict of interest in the manuscript.
Consent for publication Not applicable.
Ethics approval and consent to participate
Ethical approval for the study was granted by the Regional Ethical Review Board, Stockholm, Sweden (2011/634-31/4). All procedures performed in studies involving human participants were in accordance with the ethical standards of the institutional and/or national research committee and with the 1964 Helsinki declaration and its later amendments or comparable ethical standards. For this type of study formal consent is not required.
Received: 14 March 2016 Accepted: 11 January 2017
References
1. Rothman KJ. Epidemiology: an introduction. Oxford University Press. 2012. 2. National Board of Health and Welfare. Cancer Incidence in Sweden. 2013.
Available from: https://www.socialstyrelsen.se/Lists/Artikelkatalog/ Attachments/19613/2014-12-10.pdf.
3. Forman D. International Agency for Research on Cancer, World Health Organization, International Association of Cancer Research. Cancer incidence in five continents: Volume X. IARC scientific publications no. 164. 2014.
4. Doubeni CA, Laiyemo AO, Major JM, et al. Socioeconomic status and the risk of colorectal cancer An Analysis of More Than a Half Million Adults in the National Institutes of Health-AARP Diet and Health Study. Cancer. 2012; 118(14):3636–44. doi:10.1002/Cncr.26677.
5. Sogaard KK, Farkas DK, Pedersen L, Weiss NS, Thomsen RW, Sorensen HT. Pneumonia and the incidence of cancer: a Danish nationwide cohort study. J Intern Med. 2015;277(4):429–38. doi:10.1111/joim.12270.
6. Hallmarker U, James S, Michaelsson K, Arnlov J, Sandin F, Holmberg L. Cancer incidence in participants in a long-distance ski race (Vasaloppet, Sweden) compared to the background population. Eur J Cancer. 2015;51(4): 558–68. doi:10.1016/j.ejca.2014.12.009.
7. Mariotto AB, Rowland JH, Ries LA, Scoppa S, Feuer EJ. Multiple cancer prevalence: a growing challenge in long-term survivorship. Cancer Epidemiol Biomarkers Prev. 2007;16(3):566–71.
doi:10.1158/1055-9965.EPI-06-0782.
8. Ludvigsson JF, Almqvist C, Bonamy AE, et al. Registers of the Swedish total population and their use in medical research. Eur J Epidemiol. 2016. doi:10.1007/s10654-016-0117-y.
9. Ludvigsson JF, Otterblad-Olausson P, Pettersson BU, Ekbom A. The Swedish personal identity number: possibilities and pitfalls in healthcare and medical research. Eur J Epidemiol. 2009;24(11):659–67. doi:10.1007/s10654-009-9350-y. 10. Barlow L, Westergren K, Holmberg L, Talback M. The completeness of the
Swedish Cancer Register: a sample survey for year 1998. Acta Oncol. 2009; 48(1):27–33. doi:10.1080/02841860802247664.
11. World Health Organization. WHO Cancer Mortality Database. The cancer dictionary. 2015. Available from: http://www-dep.iarc.fr/WHOdb/WHOdb. htm.
12. Sackey H, Hui M, Czene K, et al. The impact of in situ breast cancer and family history on risk of subsequent breast cancer events and mortality - a population-based study from Sweden. Breast Cancer Res. 2016;18(1):105. doi:10.1186/s13058-016-0764-7.
13. Raj KP, Taylor TH, Wray C, Stamos MJ, Zell JA. Risk of second primary colorectal cancer among colorectal cancer cases: a population-based analysis. J Carcinog. 2011;10:6. doi:10.4103/1477-3163.78114.
14. Turcotte LM, Whitton JA, Friedman DL, et al. Risk of Subsequent Neoplasms During the Fifth and Sixth Decades of Life in the Childhood Cancer Survivor Study Cohort. J Clin Oncol. 2015;33(31):3568–75. doi:10.1200/JCO.2015.60.9487. 15. Coyte A, Morrison DS, McLoone P. Second primary cancer risk - the impact
of applying different definitions of multiple primaries: results from a retrospective population-based cancer registry study. BMC Cancer. 2014;14: 272. doi:10.1186/1471-2407-14-272.
16. Hijiya N, Ness KK, Ribeiro RC, Hudson MM. Acute Leukemia as a Secondary Malignancy in Children and Adolescents Current Findings and Issues. Cancer. 2009;115(1):23–35. doi:10.1002/cncr:23988.
17. Hulegardh E, Nilsson C, Lazarevic V, et al. Characterization and prognostic features of secondary acute myeloid leukemia in a population-based setting: a report from the Swedish Acute Leukemia Registry. Am J Hematol. 2015;90(3):208–14. doi:10.1002/ajh.23908.
• We accept pre-submission inquiries
• Our selector tool helps you to find the most relevant journal
• We provide round the clock customer support
• Convenient online submission
• Thorough peer review
• Inclusion in PubMed and all major indexing services
• Maximum visibility for your research
Submit your manuscript at www.biomedcentral.com/submit


![Table S4. Crude and age-standardized incidence rates (IR) (95% confidenceintervals [95% CI]) per 100,000 person-years for 29 cancer subtypes inSwedish males and females between 2000 and 2010, including onlyindividuals born in Sweden](https://thumb-us.123doks.com/thumbv2/123dok_us/765672.1573455/10.595.300.535.86.488/standardized-incidence-confidenceintervals-subtypes-inswedish-including-onlyindividuals-sweden.webp)
