a University of Zurich, Center for Corporate Responsibility and Sustainability, Zähringer-strasse 24, CH-8001 Zürich, and University of Basel, Faculty of Business and Economics, Peter Merian-Weg 6, 4002 Basel, Switzerland E-Mail: [email protected]
1 For a collection of incidents in policing behavior, see Harris (2003). Dragan Ilića
JEL-Classification: J71, K42
Keywords: Racial Profiling, Crime, Police, Rational Choice, Outcome Test, Aggregation
1. Introduction
Are the police in the United States racially prejudiced? The gravity of this ques-tion has attracted enormous public attenques-tion, accompanied by a recent surge of lawsuits (Persico and Todd, 2006). The answer has profound social and political consequences as the topic touches on a particularly delicate accusation of racism characterized by a discretionary practice under the state’s monopoly on the use of force. Anecdotes abound, but conclusive answers on the absence or presence of racial bias in policing demand comprehensive data and appropriate methods.1
In the last decade, models of rational choice in motor vehicle searches have found their way into the discussion. In a seminal publication, Knowles, Per-sico, and Todd (2001) (hereafter KPT) propose a rational explanation for the empirically vexing fact that in the United States, the police search black motor-ists at a substantially higher rate than white motormotor-ists. At first glance, this seems unwarranted because the fractions of incriminating searches reflect equal prob-abilities of engagement in criminal activity for both black and white motorists. In KPT’s model, however, this outcome is an equilibrium implication of an unbi-ased police force. The reasoning of KPT did not remain an exercise in theory. It has been perceived of practical relevance and has found its way into the judicial realm, for example in the court case Anderson v. Cornejo (Persico and Castle-man, 2005).
police officers exhibit distinct search patterns. This poses a fundamental problem for the interpretation of the data. In a nutshell, one of AF’s challenges is fallacious aggregation with potentially serious implications. Search success rates reflect the benefit of a search for a police officer. If the rate is lower for a minority group, KPT suggest that the benefit gap is bridged by the officer’s taste for discrimina-tion. This describes KPT’s empirically testable implication for racial prejudice. But say white officers are prejudiced against black motorists, while black offic-ers are prejudiced against white motorists. Aggregating the observations of the entire police force would then lead to incomplete or even wrong conclusions in KPT’s model. At best, the empirical test would correctly indicate racial prejudice against the motorist group that is searched less successfully by the entire police force (but would be unable to identify the animus against the other group). At worst, one would wrongfully conclude the absence of racial prejudice altogether. In light of this issue, AF propose an alternative model.
This paper shows that the story does not end there. It turns out that the dan-gers of aggregation not only loom in the racial composition of the police. Bun-dling data of distinct regions bears an equivalent risk. Taking the example of AF’s dataset, I put both KPT’s and AF’s models to the test. Using KPT’s model, the aggregate data indicate discrimination against black motorists and, with greater intensity, against Hispanic motorists. On regional sublevels, however, I cannot reject the null hypothesis of no discrimination against black motorists in the two largest regions, a conclusion which gets lost in the aggregate analy-sis. Yet other regions show deviating intensities of racial prejudice. Using AF’s model, different caveats appear. In the aggregate dataset, the empirical tests cannot reject the null hypothesis of no racial prejudice among the police. But for two regions, AF’s empirical tests cannot reject racial animus. For a number of other regions, I cannot empirically verify a testable implication of the model, rendering the test not applicable. There are issues of temporal aggregation as well. When splitting the dataset into two yearly subsets, the KPT test indi-cates that in some regions, minorities have suffered from racial prejudice in the second period only.
(successfully) search with the same probabilities. But the data show that officers of any racial group by no means behave that way. There is a considerable spread in the search success rates. This heterogeneity reduces the power of AF’s test.
The results advise caution in the application of the empirical tests of racial profiling based on rational choice models. Oversight of prejudice or mistaken accusation have profound social and political repercussions. Whenever the data permit, the application of the tests should therefore include a spatial and temporal analysis to pick up any peculiarities that are otherwise lost in aggregation. The results also stress that the empirical tests are not readily applicable to regional data if the aggregate data suggests so. It turns out that in a large subset of the observed regions, a key model prediction is violated.
The remainder of this paper is structured as follows. The next section pro-vides a quick background on the rise and relation of the two dominant rational choice frameworks. Section 3 describes their basic building blocks and testable implications. In section 4 I apply the empirical tests on regional and temporal subsamples of AF’s data. Section 5 concludes.
2. Background
2 By association I mean the correlation of the criterion race with other, crime-inducing charac-teristics observable to the police (but not the statistician) which are used for the stop or search decision. A purely statistical analysis would then falsely indicate racial bias.
Is the racial disparity in search rates evidence of a biased police force? The answer depends on the definition of bias. The term racial profiling does not differentiate between an officer with racial animus that draws malevolent utility from stopping or searching a minority motorist on the one hand and an officer that stops or searches said motorist solely because of statistical inferences, inferences either directly based on the race of the motorist or merely associated with it.2 But it is exactly this dif-ference between malevolence and efficiency that is crucial. In economics, the first motivation is known as taste-based discrimination and was introduced by Becker (1957). The second motivation is the rational solution to a signal extraction prob-lem also known as statistical discrimination (Arrow, 1973 and Phelps, 1972). One of the main goals in the research on racial profiling is thus differentiating between taste-based and statistical discrimination given the available data.
The report in New Jersey v. Pedro Soto does not manage to disentangle the two possible motives, for two reasons. First, the statistical analysis ignores any con-founding variables that have led to a stop or search decision. Let us assume that a patrolling police officer observes a motorist’s signal conveying the likelihood of criminal engagement. This signal might be composed of characteristics such as the condition of the car, driving behavior, or current location. Upon a stop, further characteristics compliment the signal: age, sex, or race of the motorist, conduct, or more obvious clues like smell or suspicious hints in visual range. The study by Lamberth was not able to take into account such factors, so omitted variable bias is a great concern. Recent stop and search data include circumstan-tial information, allowing for more conclusive inferences. Close and Mason (2007) for example test for racial prejudice via a logistic regression that links enforcement action to both motorist and officer characteristics as well as poverty and crime rates at the location of the enforcement. They find that despite con-trolling for these factors, race remains a highly significant predictor for a search. But omitted variable bias remains a problem. Gathering observable characteris-tics that make up the guilt signal is difficult enough, but it stands to reason that there may exist other pertinent characteristics that are hardly quantifiable, let alone observable to the statistician.
3 For an extended description of this issue see Becker (1993), Yinger (1996), or Ayres (2002). game, the goal of an officer is to maximize the probability of a successful search in light of search costs. Meanwhile, motorists decide whether to carry contraband depending on two factors, the probability of being searched and their group-spe-cific cost and value functions. The outcome of the game is a mixed Nash equi-librium in which motorists are involved in criminal activity with a certain prob-ability. If there are two differentiable groups of motorists, the model predicts that in equilibrium the fraction of criminals in both groups will be the same if the police is unbiased. Therefore, the search success rates are the same for all motor-ists. The search rates, however, can differ because of group-specific values or costs of carrying contraband. Equal search success rates are thus an indication that the police engage, if anything, in statistical and not taste-based discrimination. Taste-based discrimination on the other hand can be deduced from lower search suc-cess rates: Compensated by utility drawn from animus, lower search costs on the part of the police (or in terms of utility, a stronger preference to search) give rise to oversearching the discriminated group. In turn, the search success probabil-ity in the discriminated group decreases due to the higher risk of being searched. Crucially, KPT get rid of the so-called infra-marginality problem in outcome tests. Generally one cannot infer disparate treatment from (average) outcome data. Instead, it is the outcome of marginal decision-making that is informative of animus.3 It is useful to elaborate on this distinction. Assume that the police only search motorists with a guilt signal that exceeds a specific threshold. In other words, a police officer only searches a motorist who is deemed potentially criminal enough. The guilt signal follows a group-specific probability density function. If the police officer is not biased, she searches each individual whose signal exceeds the threshold. The motorist emitting the signal at threshold value is called the marginal motorist. But depending on the group-specific distribu-tions of the signals the average search (success) rates may well vary despite the same marginal decision-making process. Since empirical data only provide infor-mation on average outcomes, the infra-marginality issue poses a key obstacle for inferences of disparate treatment at the margin. The KPT framework avoids this problem: All motorists have the same probability of carrying contraband, allow-ing for inferences from average outcome data.
4 In the economic approach to crime pioneered by Becker (1968), two factors determine the decision to engage in criminal activity: Measure of the punishment and probability of getting caught. Whereas the former is considered constant in the KPT model, the uncovering prob-ability is endogenous.
infra-marginality problem. The second drawback is that KPT’s model is only valid if the police exhibit so-called monolithic behavior. That is to say, no officer group should behave differently in terms of search and search success rates against the motorist races, else, an aggregation problem could occur. Imagine that white offic-ers are prejudiced against black motorists, whereas black officoffic-ers are prejudiced against white motorists. These crosswise biases depress the search success rates against both black and white motorists. The aggregate search success rate might then mistakenly indicate prejudice against the group with the lower search suc-cess rate only, if at all. This drawback is empirically substantiated. AF’s data show that black police officers show different search (success) rates against black and white motorists than white police officers do. AF put forth a alternative model to assess the existence of racial prejudice. The next section briefly formalizes KPT’s and AF’s models and highlights the testable implications.
3. The Models
3.1 Knowles, Persico, and Todd
Consider a continuum of homogenous police officers controlling motorists with visible race r ∈ {B,W }. Let c be a one-dimensional variable which is partially or fully unobservable by the statistician. c combines all variables other than race which are pertinent to an officer’s search decision aiming to uncover contraband. Its cumulative distributions among black (B) and white (W) motorists are given by F(c |B ) and F(c |W ), respectively. Officers maximize their probability of find-ing contraband minus their cost of a search. The benefit of an arrest is scaled to one, and the marginal cost of searching a motorist of race r is tr∈ (0,1). Officers exhibit a taste for discrimination if tB≠tW. A successful search is defined as find-ing contraband and is indicated by G. Without loss of generality, assume that guilty motorists are always uncovered if searched.
of zero regardless of being searched or not. Should motorists decide to carry contraband, their payoff is –j(c,r ) < 0 if they are searched and found guilty, and v(c,r ) < 0 if they are not searched. The probability that a motorist of type (c,r ) is searched is indicated by γ(c,r ). The expected payoff thus amounts to
γ(c r, )
{
−j c r( , )}
+ −{
1 γ(c r v c r, ) (}
, ).The motorist decides to carry contraband if and only if the expected payoff of doing so is greater than zero. Now consider the decision problem of an officer. Given the probability of carrying, P(G |c,r), an officer chooses the search rate for each motorist group in order to maximize her payoff:
(
)
( , ), ( , ) ,
max ( , ) r ( , ) ( )
c W c B r W B
r P G c r t c r f c r dc
γ γ = =
∑ ∫
| − γ |The term inside the curly brackets represents the officer’s benefit of a hit minus her search costs. If the benefit is greater than zero, the officer will search the according type (c,r ) with probability one (and vice versa).
The game stabilizes in a mixed Nash equilibrium, equivalent to a matching pennies game. In this equilibrium, both motorists and officers randomize their strategies. Indifference for the motorists evokes the following equilibrium search intensity set by the officers:
( , ) ( , )
( , ) ( , )
v c r c r
v c r j c r
γ∗ =
+
Conversely, indifference for the officers implies the following guilt probability (and thus search success rate) for the motorists:
( , ) r, ,
P G c r∗ | =t ∀c r
5 Persico (2002) proposes to proxy these group-specific values via legal earning opportunities. In the US, white earnings stochastically dominate black earnings. In the model, this entails a higher search rate towards black motorists in equilibrium because of a stronger need for deter-rence due to a higher proclivity to crime attributable to socio-economic disadvantages. costs. Lower search costs against the discriminated group are thus reflected in oversearching said group.
Note that while search success rates are equal in an unbiased environment, search rates can still differ. This occurs if either the expected value of carrying contraband or the cost of being found guilty varies by motorist race. A higher incentive of carrying contraband requires an comparably harsher deterrence in terms of search rates in order to achieve the equilibrium condition of equal search success rates.5
KPT apply their test to 1,590 observations of vehicle searches on a highway stretch in Maryland between January 1995 and January 1998. After the first law-suit filed by the American Civil Liberties Union of Maryland in 1993, the local police department systematically began collecting information on the searches of their highway patrol forces. A Pearson χ2 test to compare search success rates against black and white motorists does not reject the null hypothesis of equal rates. Thus, based on the KPT framework, police officers in Maryland do not exhibit racial animus, at least not against black motorists. Hispanic motorists on the other hand show significantly lower search success rates, suggesting the presence of racial animus against them.
The KPT model successfully deals with the infra-marginality problem. All motorists carry contraband with equal probability, so there is no difference between the marginal and the average motorist. Since this implication might seem a bit outlandish, KPT offer a different interpretation of the equilibrium condition. An extension of the model adds a random variable X to the utility of each motorist. This random utility is private information, so the police have to rely on the population distribution to make inferences about a specific motorist’s utility. While the police still randomize their searches, each motorist now makes a firm decision. Motorists with high random utility carry with certainty, whereas the ones with low random utility never do. Since the police cannot distinguish them, the situation is observationally equivalent to the main model.
6 AF also present an equilibrium model in which the crime rate is endogenously determined. a variation to airport security. Most notably, Persico (2002) puts forth a social planner problem and discusses the possibility of reducing the overall crime rate by hypothetically forcing a more balanced search scheme upon the police, taking into account both matters of fairness and efficiency.
3.2 Anwar and Fang
Consider a continuum of police officers and motorists of race rp and rm∈{B,W}, respectively. The police stop and potentially search motorists, of which an exog-enous fraction πrm∈(0,1) is engaged in criminal behavior.6 During a stop, a motorists emits the signal θ∈[0,1], a one-dimensional index capturing all pos-sible characteristics linking the motorist to criminal activity. This index is ran-domly drawn from a continuous probability density function rm( )
g
f ⋅ if a motor-ist of race rm is guilty of carrying contraband. If innocent, the index is drawn from rm( ).
n
f ⋅ In order for the signal to be actually informative about the motorist’s likelihood of carrying contraband, the two densities are assumed to satisfy the strict monotone likelihood ratio property, meaning that rm( ) rm( )
g n
f θ f θ is strictly increasing in θ. In other words, a higher θ indicates a higher actual guilt prob-ability. For an officer of race rp, a search bears the marginal cost t(rm,rp ) which depends both on the race of the officer rp as well as the motorist rm. The cost of a search is a fraction of the benefit of an arrest, which is scaled to one. Like in KPT, guilty searched motorists are always uncovered.
Police officers are said to be prejudiced if t(B,rp ) ≠ t(W,rp ), that is to say, if for a given officer race, the search costs depend on the race of the motorist. On the other hand, the police force shows monolithic behavior if t(rm,B ) =t(rm,W ) for all rm. Vice versa, police officers do not show monolithic behavior if the racial officer groups have different search costs towards any given race of motorists. The difference between prejudice and monolithic behavior is essential. A non-monolithic police force does not imply taste-based discrimination as it could be that a particular racial group of officers have higher search costs in general. Like-wise, a monolithic police force does not imply a lack of prejudice as it could be that all racial police groups draw equal utility from searching a particular group of motorists.
Pr(G r| m, )θ ≥t r r( , )m p (1)
where Pr(G |rm,θ) denotes the probability that the motorist of race rm emitting signal θ is found guilty when searched. This inequality gives us the threshold signal value required to make searching worthwhile. A police officer will only search a motorist if he is deemed suspicious enough, or formally, if any only if
( , )r rm p
θ θ≥ ∗
where the threshold value of θ∗ is determined by equating (1). The motorist emit-ting the threshold value is the empirically unobservable marginal motorist. Note that the threshold value θ∗ monotonically increases with the search costs: The higher the costs of searching a given race of motorists, the higher the threshold value of θ∗ needs to be for a motorist of that race to be searched in order for the search to remain profitable for the officer. The equilibrium search rate γ(rm,rp ) and the equilibrium search success rate (or hit rate) S(rm,rp ), both calculated via the exogenous probability of carrying contraband πrm and the signal
distribu-tion funcdistribu-tions rm( )
g
f ⋅ and rm( )
n
f ⋅ , are uniquely identified via the threshold value θ∗. For a given race of police officers, lowering the search costs against
motor-ist group B in comparison to motormotor-ist group W (interpreted as taste-based dis-crimination towards group B) leads to a lower search threshold for group B. This raises the equilibrium search rate towards group B because more fulfill the search criterion. Yet of the larger fraction of B-motorists that are searched, a lower frac-tion is actually guilty.
Based on this model AF present two testable implications. First, if a police force exhibits monolithic behavior, the search costs towards a given race of motor-ists is the same for all officer races. Consequently, the search rate γ(rm,rp ) and the according search success rate S(rm,rp ) specific to that motorist race will then also be the same for all officer races. Otherwise nonmonolithic behavior can be deduced. Still, it is possible that these rates vary across motorist race because the police might make use of statistical discrimination. This implication can be tested empirically to check for the validity of KPT’s implicit assumption of nonmono-lithic police behavior and thus assesses the validity of KPT’s test.
7 Both Close and Mason and AF use data from the FHP. Close and Mason’s data include the years in AF’s data but cover a longer time span.
8 For detailed descriptive statistics of the data, the reader is kindly referred to AF, p. 141.
4. A Disaggregated Analysis
There is reason to believe that different regions are associated with different policing outcomes. Close and Mason (2007) conduct a parametric analysis on data of the Florida Highway Patrol and include county-specific variables such as the local crime and poverty rate or the share of minority residents in the county’s population.7 Their results suggest that local conditions affect the search pattern of the police. For example, a larger fraction of black residents increases the odds of search by 17 to 27 percent for all motorist groups. Applying AF’s and KPT’s tests to aggregate data neglects such effects and thus potentially overlooks local manifestations of racial prejudice.
In order to take into account regional peculiarities, I apply the tests described in the last section to subsamples of AF’s data, which are available online at the American Economic Review. The Florida Highway Patrol (FHP) data comprises detailed information on motorist and officer characteristics for 906,339 stops by 1,469 officers from January 2000 to November 2001 all over Florida. 8,976 of all stops triggered a search. Among the searches, 1,900 were successful and uncovered engagement in criminal activity. The most important variables for the empirical tests are the race of the stopped motorist and, for AF’s model, the race of the officer conducting the stop.8
4.1 Anwar and Fang Revisited
the white motorists they stop. Black and Hispanic motorists are even more likely to be searched. Finally, Hispanic officers fall in between in terms of search rates.
The according search success rates demonstrate an equivalently consistent, yet inverse pattern. By and large, the reluctant black officers turn out to be the most successful ones. Once they manage to search, they crunch out the highest suc-cess rates against any race of motorists. For instance, they uncover engagement in criminal activity in 40% of the searches against white motorists. In comparison, the eagerly searching white officers miss out the most when searching, regardless of the motorist group. And again, Hispanic officers lie in between.
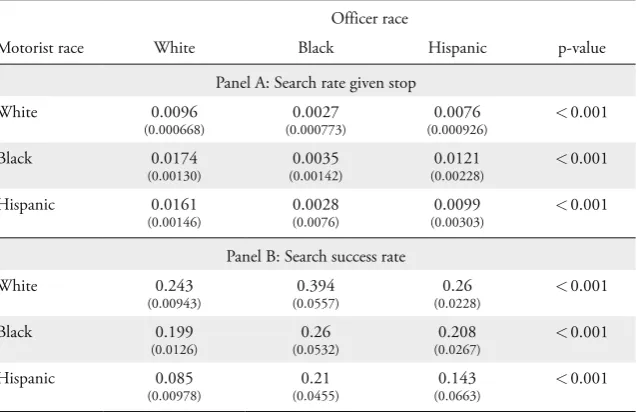
As described by the model, high search costs imply low search rates and, con-versely, high search success rates. The consistency of the observed rank orders in Table 1 suggests that black officers have the highest search costs in general, fol-lowed by Hispanic officers. White officers seem to have the lowest search costs. If this ranking is not violated, one cannot reject the null hypothesis that the observed differences in the rates are due to categorical variations in search costs instead of being driven by racial animus. Pairwise and for each race of motorists, AF calculate Z-statistics to test the null hypothesis of equal search (success) rates against the ranked alternatives. The tests reject equality in all cases, supporting
Table 1: Rates for all Officer and Motorist Race Combinations
Officer race
Motorist race White Black Hispanic p-value
Panel A: Search rate given stop
White 0.0096
(0.000668)
0.0027
(0.000773)
0.0076
(0.000926) <
0.001 Black 0.0174 (0.00130) 0.0035 (0.00142) 0.0121
(0.00228) <
0.001 Hispanic 0.0161 (0.00146) 0.0028 (0.0076) 0.0099
(0.00303) <
0.001 Panel B: Search success rate
White 0.243
(0.00943)
0.394
(0.0557)
0.26
(0.0228) <
0.001 Black 0.199 (0.0126) 0.26 (0.0532) 0.208
(0.0267) <
0.001 Hispanic 0.085 (0.00978) 0.21 (0.0455) 0.143
(0.0663) <
0.001
the descriptive rank orders and thus independence of motorist race. In sum, the data does not indicate racial prejudice among the Florida Highway Patrol and gives empirical support to the model.
Despite the striking evidence, some characteristics of the data give pause for thought. The dataset covers all of Florida. Just like the aggregation of differ-ing rates among the racial police groups can lead to wrong conclusions of racial prejudice in KPT’s model, the spatial aggregation of distinct regions bears the same risk, both in AF’s and KPT’s model. Let us assume that one specific region exhibits racial prejudice against black motorists, while another region holds a grudge against white motorists. In KPT’s model, this would imply lower search success rates against the discriminated group. These downward biases are added and get partly or even fully lost in the aggregate, reaching the mistaken conclu-sion of only one discriminated group in Florida or the absence of racial prejudice altogether. The same reasoning applies to AF’s model. It is possible that such rankings on regional levels that are dependent on the race of the motorist add up to aggregated rankings that cannot reject racial prejudice. There are temporal caveats in the application as well. KPT’s dataset spans over four years, AF’s over two. In the aggregate data, changes in racial prejudice might get overlooked. A police force which has successfully combatted racial prejudice could suffer from its past behavior if the analysis includes the biased years. Likewise, a police force which has just recently shown signs of prejudice might be left unscathed. The next sections address these issues.
4.2 Spatial Disaggregation
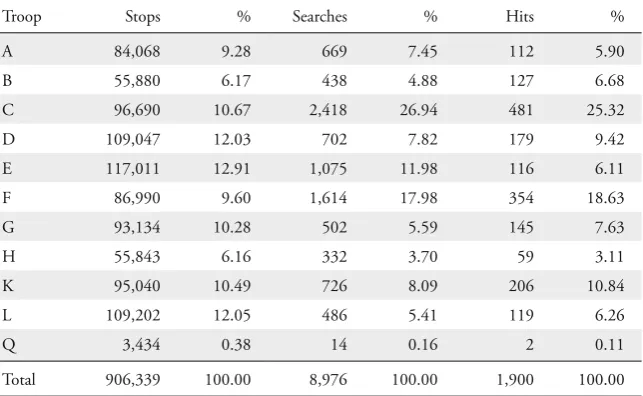
The observations in AF’s dataset comprise the location in which the stops occurred. Figure 1 (taken from AF, p. 142) depicts the spatial allocation of the Florida Highway Patrol. From A to L, there are ten regional troops officers are assigned to (plus troop Q, a small troop assigned to State Headquarters which will be ignored). AF make use of the aggregate data to exhaust the statistical power of their tests, but it turns out that many troops provide a sufficient sample size for an analysis of their own. In order to identify regional quirks in policing behav-ior, I disaggregate the data by troop. Table 2 lists the number and percentage of stops, searches, and successful searches by troop.
two diligent troops also produce according success. Since troops clearly show dis-tinct search patterns, it is worthwhile to assess if and to what extent this affects the empirical application of the tests for racial prejudice.
4.3 Regional Analysis: Anwar and Fang
KPT based their analysis on 1,590 searches. With 2,417 and 1,614 searches in troop C and F, respectively, either troop carries out a comparable number for a disaggregated analysis, at least for KPT’s test. For AF’s test, there are additional
Figure 1: Troop Allocations of the Florida Highway Patrol
Troop A
Troop B
Troop C
Troop F Troop H
Troop G
Troop D
Troop E
Troop L
9 AF (p. 139) follow this line of thought when illustrating that their test is able to detect racial prejudice in the Boston police data used in Antonovics and Knight (2004).
restrictions. Strictly speaking, their test not only requires a sufficiently large number of stops and (successful) searches but also enough observations within each officer group for sufficient statistical power. However, one can relax these covenants somewhat. AF mention that in principle, their test can be implemented with search data alone (p. 131). But by the same token, their test can be imple-mented with only stop data, which are higher in number. The rank orders of the search rates are informative enough to detect racial prejudice.9 This scaled-back application of AF’s test comes in particularly handy with disaggregated data to counteract the reduction in sample size. Of course, whenever possible, the rank-ings of the search success rates should be considered for supporting evidence of prejudice or to test the predicted inverse rank order condition implied by the model. The following analysis takes the example of three troops (D, G, and C) and highlights distinct caveats that arise from aggregation.
The first testable implication is the hypothesis of monolithic behavior. Let us first consider the search rates. For a given race of motorists, the Pearson χ2 sta-tistic for independence of the proportion of searched to not searched motorists for all three officer groups is
Table 2: Number of Stops, Searches, and Hits by Troop
Troop Stops % Searches % Hits %
A 84,068 9.28 669 7.45 112 5.90
B 55,880 6.17 438 4.88 127 6.68
C 96,690 10.67 2,418 26.94 481 25.32
D 109,047 12.03 702 7.82 179 9.42
E 117,011 12.91 1,075 11.98 116 6.11
F 86,990 9.60 1,614 17.98 354 18.63
G 93,134 10.28 502 5.59 145 7.63
H 55,843 6.16 332 3.70 59 3.11
K 95,040 10.49 726 8.09 206 10.84
L 109,202 12.05 486 5.41 119 6.26
Q 3,434 0.38 14 0.16 2 0.11
10 The corresponding formulae depicted in KPT and AF neglect the sample size and refer to the rates only. However, this is only a descriptive mistake.
n n
(
)
n 2 2 ( , ) ( , ) ( 1) ( , ) pm p m p
T r m p
O r r E r r
R
E r r χ
∈
−
= −
∑ ∑
*
where R is the cardinality of the set of officer race categories, *, ( , )O r rnm p is the observed frequency, E r rn( , )m p denotes the expected frequency under the null hypothesis of independence, and T ∈{searched, not searched } describes the possi-ble stop outcomes. The search success rates are tested by simply replacing T with the two possible search outcomes S ∈{successful, unsuccessful }.10
The second testable implication addresses the rank orders of the rates against a given race of motorists. Each rank is tested using a Z-statistic (AF, p. 146). For both the search and search success rates, the three officer groups imply two observable ranks for a given race of motorists. The null hypothesis of equality of the rates is tested against the observed one-sided alternative hypothesis. For the search rates, the Z-statistic is given by
n( , ) n( , )
m p m p
p p
p p
r r r r
Z SVar SVar n n γ γ ′ ′ ′ − = +
where p and p′ are the two officer groups searching motorists of race rm, SVar is the variance, and n is the number of stops. The rankings of the search success rates are tested equivalently.
The three rankings of the search rates mirror the distinctive and consistent pic-ture of the aggregate analysis and are independent of the race of the motorist. Among the officer groups, black officers search least likely. Compared with the approximate search rate of 0.3% in the aggregate, black officers in troop D are even more reluctant. The same reluctance can be found in the rates of white officers, again the most likely officer group to conduct searches. Whereas in the aggregate, white officer search one to almost two percent of the motorists they stop, in troop D this range is shifted downwards by roughly a half percent. The rates of Hispanic officers are in between. Like in the aggregate analysis, all null hypotheses of pairwise equal ranks for a given race of motorist are rejected at the 0.1% significance level. In sum, troop D reflects the results of the aggregate, at least for the search rates. The search success rates, on the other hand, defy cate-gorization due to the low number of observations, a drawback that will be over-come in the next two examples. In conclusion, we cannot reject the hypothesis that the police in troop D do not exhibit racial prejudice.
Let us now turn to the second example, troop G. The tests for monolithic behavior in Table 4 reject the null hypothesis that officers of different races have the same search rates. The same test for the search success rates skips the
Table 3: Search Rates and Search Success Rates in Troop D
Officer race
Motorist race white black Hispanic p-value
Panel A: Search rate given stop
white 0.0059 (0.0003) 0.0009 (0.0003) 0.0043 (0.0008) < 0.001 black 0.0161 (0.0019) 0.0017 (0.0007) 0.0039 (0.0017) < 0.001 Hispanic 0.0091 (0.0009) 0.0012 (0.0007) 0.0047 (0.0016) < 0.001 Panel B: Search success rate
white 0.2825 (0.0239) [0.6] (0.1549) 0.3704 (0.0929) 0.33 black 0.2667 (0.0330) [0.34] (0.1925) [0.2] (0.1789) – Hispanic 0.0926 (0.0279) [0.67] (0.2721) [0] (–) –
observations of Hispanic officers due to their low number of searches in troop G. In contrast to troop D, black officers’ rates are applicable. Whereas against black motorists, the null hypothesis cannot be rejected, the test suggests that white and black officers have different search success rates against white motorists. I exclude Hispanic motorists because of the low number of successes.
The descriptive rank orders of the search rates in troop G show an unprec-edented pattern. Black officers, previously the most reluctant searchers, now search at high rates, whereas white officers fall behind. The Z-statistic for the rank order test indicates that against white motorists, white officers search least often ( p < 0.01 when compared to black officers), while the rates of black and Hispanic officers share the top rank ( p = 0.24). The ranking of the search rates against black motorists is more pronounced. Black officers search more often than white officers ( p < 0.05), which in turn search more often than Hispanic offic-ers ( p < 0.05). Finally, black officers also show the highest search rates against Hispanic motorists, followed by white officers ( p < 0.01). Hispanic officers have the lowest search success rates against Hispanic motorists ( p < 0.05 in compari-son to white officers).
Notably, the search rates in troop G are dependent upon motorist race. White officers display lower search rates against white motorists than Hispanic offic-ers do. At the same time, white officoffic-ers search black motorists at a higher rate than Hispanic officers. This inconsistent pattern indicates the presence of rela-tive racial prejudice, a conclusion which is supported by the ranking of the search success rates against white motorists. Black officers search white motorists more often than white officers do. Conversely, black officers are also less successful against white motorists than white officers are ( p < 0.05). This inverse rank order of the search and the search success rates provides supporting evidence for both the applicability of AF’s model and the conclusion of racial prejudice in troop G, a conclusion drowned by the aggregate analysis.
troop. Judging from the rankings of the search rates, there is no indication of racial prejudice among the officers in troop C.
However, the only discernible ranking of the search success rates raises a prob-lem. The inverse rank order condition does not hold, that is, the rank order of the search rates is not the opposite of the rank order of the search success rates. White officers have the highest search rates, yet in contrary to what the model predicts, they are also more successful than Hispanic officers when searching black motorists ( p < 0.01). This violation casts doubt on the descriptive validity of AF’s model in troop C.
Troop C is not the only troop to which AF’s test is not applicable. In troop E, Hispanic officers search Hispanic motorists at a higher rate than black officers do (0.0053 vs. 0.0015; p < 0.001). Yet Hispanic officers are also more success-ful at it (0.2458 vs. 0.0952; p < 0.05). The same rank order violation is found in troop K: Hispanic officers are more likely to search Hispanic motorists than black officers are (0.0078 vs. 0.0043; p < 0.01) and have a higher hit rate as well (0.4889 vs. 0.1429; p < 0.01).
Table 4: Search Rates and Search Success Rates in Troop G
Officer race
Motorist race white black Hispanic p-value
Panel A: Search rate given stop
white 0.0036 (0.0003) 0.0054 (0.0007) 0.0066 (0.0015) < 0.01 black 0.0088 (0.0008) 0.0131 (0.0020) 0.0039 (0.0027) < 0.05 Hispanic 0.0098 (0.0017) 0.0242 (0.0056) 0.0061 (0.0043) < 0.01 Panel B: Search success rate
white 0.3501 (0.0331) 0.2188 (0.0517) [0] (–) < 0.05 black 0.3304 (0.0439) 0.3095 (0.0713) [0] (–) 0.80 Hispanic 0.0938 (0.0515) 0.1667 (0.0878) [0.5] (0.3536) –
4.4 Regional Analysis: Knowles, Persico, and Todd
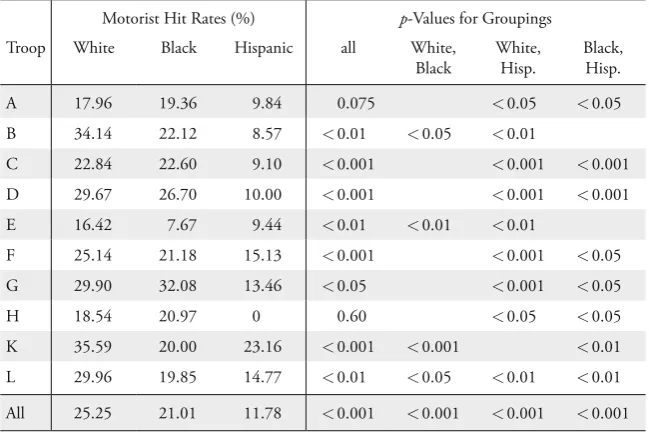
AF compare their results to KPT’s test for instructive reasons, knowing that the test is formally not valid for interpreting the FHP data due to nonmonolithic behav-ior. AF reach the conclusion that while they cannot reject relative racial prejudice with their own test, KPT’s test would (mistakenly) indicate the presence of abso-lute racial prejudice against black motorists and, to a larger extent, against His-panic motorists. In doing so, AF highlight a pitfall in the application of KPT’s test. Issues of spatial aggregation pertain to the application of KPT’s test as well. If officers in troop X are prejudiced against white motorists, while officers in troop Y hold a grudge against black motorists, one might mistakenly conclude that officers from the region X +Y do not exhibit racial prejudice. By troop, Table 6 lists the p-values from KPT’s Pearson χ2 test for the null hypothesis that the search success rates are equal for all motorist groupings. For the sake of clarity, the additional pairwise groupings only show the significant p-values. Although the categorization by troop is associated with some loss of statistical power, the discernible troop patterns are instructive. Hispanic motorists are searched with significantly less success than white motorists in all troops, indicating systematic
Table 5: Search Rates and Search Success Rates in Troop C
Officer race
Motorist’s race white black Hispanic p-value
Panel A: Search rate given stop
white 0.0235
(0.0006)
0.0027
(0.0005)
0.0135
(0.0014) < 0.001
black 0.0456
(0.0024)
0.0039
(0.0016)
0.0235
(0.0051) < 0.001
Hispanic 0.0728 (0.0032) 0.0111 (0.0042) 0.0211 (0.0052) < 0.001 Panel B: Search success rate
white 0.2288 (0.0112) 0.2759 (0.0830) 0.2045 (0.0430) < 0.001 black 0.2263 (0.0221) [0.67] (0.1920) 0.0952 (0.0641) 0.16 Hispanic 0.0804 (0.0123) [0.2857] (0.1707) [0.3125] (0.1159) –
racial prejudice against Hispanics when applying KPT’s test. This is consist-ent with the conclusions in the aggregate. But in particular for white and black motorists, there is substantial variation in the search success rates across troops.
Black motorists seem to be searched with similar success in six of the ten troops when compared to white motorists. The inability of rejecting the null hypoth-esis has to be taken with a grain of salt due to the low number of observations in some troops. Even so, in three of the six troops which cannot reject the null, the observed search success rates against black motorists are actually higher than against white motorists. Consider in particular troops C and F, the two larg-est troops in terms of searches. Either of them contains more observations that KPT’s dataset. In contrast to the aggregate analysis, the KPT test does not indi-cate racial prejudice against black motorists as the null hypothesis of equal hit rates against white and black motorists cannot be rejected.
Like in the application of AF’s test, in KPT’s test spatial aggregation of search data lumps together the conclusion of racial prejudice for all of Florida. This involves the danger of falsely accusing regions for which the test does not yield conclusive results. On the other hand, troops that do harbor animus get away without repercussions if the aggregate analysis does not indicate racial prejudice.
Table 6: KPT Test By Troop
Motorist Hit Rates (%) p-Values for Groupings Troop White Black Hispanic all White,
Black
White, Hisp.
Black, Hisp.
A 17.96 19.36 9.84 0.075 < 0.05 < 0.05
B 34.14 22.12 8.57 < 0.01 < 0.05 < 0.01
C 22.84 22.60 9.10 < 0.001 < 0.001 < 0.001 D 29.67 26.70 10.00 < 0.001 < 0.001 < 0.001 E 16.42 7.67 9.44 < 0.01 < 0.01 < 0.01
F 25.14 21.18 15.13 < 0.001 < 0.001 < 0.05 G 29.90 32.08 13.46 < 0.05 < 0.001 < 0.05
H 18.54 20.97 0 0.60 < 0.05 < 0.05
4.5 Temporal Analysis
For policy recommendations, it is useful to pinpoint trends and sudden changes in racial prejudice over time. Consider a police force that has introduced meas-ures to combat racial prejudice against minority motorists. If these measmeas-ures are effective and justified, empirical tests based on observations that start before and end after the introduction can lead to mistaken conclusions on the absence or presence of racial prejudice. One might also imagine that biased officers would reconsider their benefit of prejudice in light of heightened attention by the public and legal investigations propelled by lawsuits. Finally, demographic changes in the police force could affect its aggregate behavior. If retiring officers exhibit dif-ferent search patterns than their newly recruited counterparts, this will reflect in the data over time.
I therefore complement the spatial analysis with a separate temporal disaggre-gation by splitting the FHP dataset into two periods. The first period spans from January 2000 to December 2001, and the second period from January 2001 to September 2001. The first period comprises 512,411 stops and 4,815 searches, 1,036 of which were successful. The observations from the second period con-tain 393,928 stops, 4,161 searches, and 864 hits.
For AF’s test, the crude split does not change any conclusions, neither in the aggregate nor on troop level. The rank orders become somewhat less pronounced, which is attributable to the lower sample size. KPT’s test, on the other hand, yields interesting results in two troops.
Table 7 illustrates the results of KPT’s test for troops K and L for the years 2000, 2001, and for the aggregate dataset. The year 2001 shows remarkable drops in the search success rates against minority motorists. In troop K in 2000 the search success rate against Hispanic motorists was 31% and statistically on par with the 37% against white motorists. In 2001 the rate against Hispanic motorists experienced a significant drop to 13%, while the one against white motorists remained roughly unchanged. Thus, in contrast to the year 2000, the KPT test indicates racial prejudice against Hispanic motorists in 2001. In troop L, an equivalent drop applies to black motorists. While white motorists are being searched at approximately the same rate in both years, the search rate against black motorists falls significantly from 29% in 2000 to 8.5% in 2001. Following KPT, this would point to emerging racial prejudice against black motorists.
out the possibility that other data might be less indicative in the aggregate. If so, a formerly prejudiced police force might profit from the inclusion of their recent change for the better. A more imminent issue arises the other way around: A police force that only lately has been exhibiting prejudiced behavior could escape accusation. A change over two years hardly indicates a trend, but the analysis of the yearly subsets highlights the temporal heterogeneity in the data.
4.6 A Heterogeneous Police Force
The observation of nonmonolithic behavior in the FHP data motivated AF’s model, which differentiates officers by race. While KPT’s model assumes that the police have homogenous search costs, AF allow for search costs that differ between officer races. Heterogeneity in the police force was already brought up as an issue in Antonovics and Knight (2004). They claim that a police force that has heterogeneous preferences for search renders KPT’s test invalid, a claim that is refuted in Persico and Todd (2006). Persico and Todd generalize the KPT model and allow for police heterogeneity in costs of search and tastes for discrimination. It turns out that despite this twist, KPT’s test is still applicable. However, this result does not apply to an environment with opposed tastes for discrimination where some officers are prejudiced against black motorists and others against white motorists, say, in a racially partitioned police force.
This is where AF come in. In loosening the strict assumption of a undifferen-tiated police force, they provide a solution to Persico and Todd’s generalization because AF’s alternative test is able to identify racial prejudice even when faced
Table 7: Yearly KPT Test
Motorist Hit Rates (%) p-Values for Groupings Troop/Year White Black Hisp. all White,
Black
White, Hisp.
Black, Hisp. K both 35.59 20.00 23.16 < 0.001 < 0.001 < 0.001
K 2000 36.92 19.23 31.00 < 0.01 < 0.01
K 2001 33.96 20.88 12.99 < 0.01 < 0.05 < 0.001 L both 29.96 19.85 14.77 < 0.01 < 0.05 < 0.01
L 2000 30.72 29.17 15.91
11 Note that AF’s objection is formal as well. Rejecting monolithic behavior does not imply the presence of opposed tastes. Indeed, following AF’s argument the search success rates in Table 1 imply moderate prejudice of white officers against black motorists and extensive preju-dice against Hispanic motorists. Yet black officers do not seem to be prejupreju-diced against white motorists but substantially against their own kind and Hispanic motorists. Likewise, Hispanic officers do not seem prejudiced against white motorists but somewhat against black motorists and especially against their own kind. In sum, the argument of opposed tastes is not borne out in the data.
with opposed tastes for discrimination. One particular assumption of KPT’s framework remains in AF: Officers of a given race are all assumed to have the same search costs and thus the same search (success) rates. However, a deeper look at the FHP data qualifies this assumption.
Figure 2 shows the relationship between the number of searches and the search success rates for all 727 searching officers. Note that the 742 officers that never search do not appear in the figure. Three features stand out. First, most officers rarely search. While the observations range well up to 200 searches (excluding two overachievers with over 300 and 400 searches each), the mass is concentrated on the lower end. Second, the search success rates are scattered between zero and one, rejecting the notion of search success rates that are equal for a given race of officers. Third, the more searches an officer conducts, the less successful she tends to be. These patterns apply to all officer races.
How do these features affect AF’s test? Recall that AF question the valid-ity of KPT’s test because of nonmonolithic behavior, which harbors the danger of opposed tastes for discrimination. The aggregation of nonmonolithic rates across officer group could conceal prejudice. In a similar vein, one could raise the objection that among a given officer/motorist combination, some officers might be biased against the motorists, while other officers are more lenient towards them and treat them more favorably. The average rate would then be the result of opposed tastes, where one bias drives the rate down and the other bias drives it up. However, this objection is rather a formal than a practical one.11 Even if it were so, the construction of two such opposed officer groups for each officer/ motorist combination is a rather discretionary task.
12 The definition of strong is relative. It depends on the extent of prejudice needed for a viola-tion of the rank orders, which in turn depends on the group differences in search costs. The larger these differences, the more leeway there is.
13 The upside is that a rank order violation reflects strong evidence of prejudice.
14 Of course, this scenario also depends on the relative number of searches a prejudiced officer conducts.
low power. There is some leeway in the search (success) rates due to the ordinal nature of the test. It is possible that white officers are prejudiced against black motorists, which lowers the search success rate. Yet the test will fail to detect this prejudice if the rate remains within the allowed range of the rank order. This is the case if the prejudice is not too strong.12 Statistically, this describes a type-II error, that is to say, not rejecting the null hypothesis of no racial prejudice when in fact it is false.13 Heterogeneity in prejudice therefore weakens the power of the test all the more. In AF’s model, officers of a given race are, if anything, all equally prejudiced. They thus all contribute equally to the bias shift of the aver-age rate. If however only a fraction of officers are prejudiced, the averaver-age rate is affected less, making a rank order violation less likely.14 Indeed, the fraction of
Figure 2: Number of Searches and According Search Success Rates
S
ear
ch S
u
ccess Rates
0 100 200 300 400
Number of Searches 1.00
0.75
0.50
0.25
prejudiced officers could exhibit proportionally more animus than a monolithic officer group before they violate a given rank order. Similar to prejudiced troops, prejudiced officers might get lost in aggregation. This caveat applies to KPT’s test as well, although the issue is less severe because there is no ordinal leeway in comparison to AF’s test.
5. Conclusion
Disparate outcomes in stops and searches of minority motorists have stirred up a heated discussion on racial profiling. Are the differences the result of racial prej-udice or of unbiased decision-making? Recently, models of rational choice have contributed to disentangling the cause. The empirical tests of the two dominant models by Knowles, Persico, and Todd (2001) (KPT) and Anwar and Fang (2006) (AF) cannot reject the null hypothesis of no racial prejudice in the police force in their data. However, the analysis in this paper shows that it is necessary to exercise prudence in the application of these tests. It turns out that spatial, individual, and temporal heterogeneity in policing behavior pose substantial dif-ficulties in the interpretation of the data. When drawn from the aggregate, con-clusions on the absence or presence of racial prejudice might be unfounded for specific regions or during certain periods. Disaggregation also assays the validity of the tests by verifying the model predictions on subsamples of the data.
I apply the empirical tests of both models to regional subsets of AF’s data, so-called troops. On this lower level, AF’s test indicates racial prejudice in one of the troops, a conclusion gone unnoticed in the aggregate. The application of KPT’s test with the aggregate data indicates racial prejudice against black motorists and in particular against Hispanic motorists. The results on troop level substanti-ate the prejudice against Hispanic motorists but cannot reject unbiased police behavior in a number of troops, most notably in the two largest ones. Finally, temporal disaggregation reveals significant jumps in behavior. Using KPT’s test, two troops show considerable shifts in bias against minority motorists in 2001 compared to the previous year.
data that include the sinister years. And recent surges in prejudice might fail to show up in the aggregate, stalling much-needed measures. The results of this paper emphasize that not all regions and periods should be measured by the same yardstick, in particular in consideration of efficiency and effectiveness of reme-dial policies (Persico, 2002). A disaggregated analysis can help channeling these resources to the (most) relevant regions at the right time. Moreover, it draws attention to possible exploitation of conveniently selected data.
Other results in this paper address the assumption of monolithic behavior within the police groups. In AF’s model, all officers of a given race have the same search costs and thus the same search (success) rates. However, this assumption is not empirically substantiated. While this does not invalidate AF’s test, the find-ing reduces its statistical power. Fractions of prejudiced officers are more likely to go unnoticed. This in turn raises questions of what kind of racial prejudice the models of rational choice discussed in this paper are apt to pick up. They are good at identifying systematic prejudice, that is to say, whether all officers of a given race are equally biased. But they fare worse at singling out prejudiced subgroups. This applies in particular to AF’s test which relies on ordinality conditions.
Finally, the results cast doubt on the applicability of AF’s model for some troops. The model implies inverse rank orders of the search and search success rates, an implication empirically substantiated in the aggregate data. In troops C, E, and K, however, this inverse rank order condition is violated, rendering the empirical test invalid. The implications of these violations go beyond troop level. These troops make up half of the searches in the aggregate data. It is thus debatable whether the empirical tests are applicable to the aggregate if they are invalid for such a large subset. Future research is needed to assess whether these issues apply to other data. In the meantime, the heterogeneity of the results call for caution in the application of the tests.
References
Antonovics, Kate L., and Brian G. Knight (2004), “A New Look at Racial Profiling: Evidence from the Boston Police Department”, NBER Working Paper, 10634.
Arrow, Kenneth J. (1973), “The Theory of Discrimination”, in Orley Ashen-felter and Albert Rees (eds.), Discrimination in Labor Markets, Princeton, NJ: Princeton University Press, pp. 3–33.
Ayres, Ian (2002), “Outcome Tests of Racial Disparities in Police Practices”, Justice Research and Policy, 4, pp. 131–142.
Becker, Gary S. (1957), The Economics of Discrimination, Chicago: University of Chicago Press.
Becker, Gary S. (1968), “Crime and Punishment: An Economic Approach”, Journal of Political Economy, 76(2), pp. 169–217.
Becker, Gary S. (1993), “The Evidence against Banks Doesn’t Prove Bias”, Business Week, p. 18.
Close, Billy R., and Patrick L. Mason (2007), “Searching for Efficient Enforcement: Officer Characteristics and Racially Biased Policing”, Review of Law and Economics, 3(2), pp. 263–321.
Dharmapala, Dhammika, and Stephen L. Ross (2004), “Racial Bias in Motor Vehicle Searches: Additional Theory and Evidence”, Contributions to Economic Analysis & Policy, 3(1), Article 12.
Durose, Matthew R., Erica L. Smith, and Patrick A. Langan (2007), “Bureau of Justice Statistics Special Report: Contacts between the Police and the Public, 2005”, URL http://www.ojp.usdoj.gov/bjs/pub/pdf/cpp05.pdf. Harris, David A. (2003), Profiles in Injustice: Why Racial Profiling Cannot Work,
The New Press.
Knowles, John, Nicola Persico, and Petra Todd (2001), “Racial Bias in Motor Vehicle Searches: Theory and Evidence”, Journal of Political Economy, 109(1), pp. 203–229.
Lamberth, John (1994), “Revised Statistical Analysis of the Incidence of Police Stops and Arrests of Black Drivers/Travellers on the New Jersey Turnpike between Interchanges 1 and 2 from the Years 1988 through 1991”, Legal Expert Report.
Persico, Nicola (2002), “Racial Profiling, Fairness, and Effectiveness of Polic-ing”, American Economic Review, 92(5), pp. 1472–1497.
Persico, Nicola, and David A. Castleman (2005), “Detecting Bias: Using Statistical Evidence to Establish Intentional Discrimination in Racial Profil-ing Cases”, University of Chicago Legal Forum, pp. 217–235.
Persico, Nicola, and Petra Todd (2005), “Passenger Profiling, Imperfect Screen-ing and Airport Security”, American Economic Review, 95(2), pp. 127–131. Persico, Nicola, and Petra Todd (2006), “Generalising the Hit Rates Tests
Phelps, Edmund S. (1972), “The Statistical Theory of Racism and Sexism”, American Economic Review, 62, pp. 659–661.
Yinger, John (1996), “Why Default Rates Cannot Shed Light on Mortgage Discrimination”, Cityscape: A Journal on Policy Development and Research, 2(1), pp. 25–31.
SUMMARY