© Penerbit UTHM
DOI: https://doi.org/10.30880/ijie.2018.10.02.029
*Corresponding author: [email protected]
2018 UTHM Publisher. All right reserved. penerbit.uthm.edu.my/ojs/index.php/ijie
151
HEC-RAS Hydraulic Model for Floodplain Area in Sembrong
River
Nor Azimah Marimin
2, Mohd Adib Mohammad Razi
1,*, Mustaffa Anjang
Ahmad
1, Mohd Shalahuddin Adnan
1, Siti Nazahiyah Rahmat
11
Department of Water and Environmental Engineerign, Faculty of Civil and Environmental Engineering, Universiti Tun Hussein Onn Malaysia, 86400 Parit Raja, BatuPahat, Johor, Malaysia.
2
Post-graduate student, Faculty of Civil and Environmental Engineering, Universiti Tun Hussein Onn Malaysia, 86400 Parit Raja, BatuPahat, Johor, Malaysia.
Received 01 January 2018; accepted 15 April 2018, available online 07 May 2018
1. Introduction
Natural disasters are the main cause of irrecoverable damages [1]. One of the most common natural disasters that happen all around the world is flood. Nowadays, flood has become a recurring phenomenal in most parts of the world and Malaysia itself. Focusing on the issue of flood in Malaysia, among the common flood areas in Malaysia are in the state of Johor. Batu Pahat is one of the districts that are very prone towards flooding due to its low land area. The unending rain that fall for a few hours can caused some area in Batu Pahat to flood.
Flood is a natural disaster that occurs when the maximum flow rate of drainage system exceeds the capacity that the system can accommodate [2]. This problem lead to overflow of river water to the river bank causing flood happened in that area. There are many of drainage control structures along the watersheds include facilities such as storm drains, culverts, bridges, and water quality, quality-control structures [3]. Computer model plays an important role in hydraulic analysis by aiding in determination of water surface profiles with
different flow conditions. Consistent deficiency of those computer programs has been their disadvantage in connecting information explaining the water profiles with their physical locations on the land surface [3]. Since the computed water surface elevations are manually plotted on paper maps in order to delineate the floodplains, thus the manual plotting would result in significant savings of both time and resources. Hydrologic Engineering Center’s River Analysis System (HEC-RAS) provides an ideal environment for this type of work.
Floodplain is an area that will bring an outflow of drainage where it was formed because of flooding and deposition. Figure 1 shows the concept of flooded area where it can be narrowed or enlarged depending on the topography of the area [4].
Floodplain mapping process generally consisted of three steps [5]:
i. The stream flow associated with the 100-year flood is estimated based on peak flow data or hydrologic modeling.
Abstract: The study of floodplain is significant to human life and social economy. It can be seen that by using most computer models, locations of structures affected by floodwaters, such as bridges and roads cannot be effectively compared to the floodplain location in stream floodplain analysis. The purpose of this study is to develop an output of Hydrologic Engineering Center’s River Analysis System (HEC-RAS) hydraulic model and to enable one dimensional steady flow analysis. This study is applied to Sembrong river catchment area, located in Batu Pahat. Floodplain data features such as length of streams, bank position, streamline and cross-sections were used to produce river flow and its cross-sectional shape for each station along the study area. Total of 7 flow rate values were used to indicate an increase in the water level in order to accommodate the additional amount of water that flow into river. The results show that water will overflow into the floodplain at maximum flow rate of 24 m3/s.
The hydraulic model had indicated that 33 out of 65 stations were unable to accommodate the maximum flow rate and thus will led to flooding. By developing the hydraulic model, it clearly shows that the results are more reliable and the affected area can be easily identified. The developed flood model can be a very useful tool in flood management of Sembrong river in terms of river development planning, flood mitigation measures, flood evacuation planning and addressing public awareness. This study proved that HEC-RAS is one of effective instrument for analysis and modeling.
152
ii. The 100-year flood elevation profiles are computed using hydraulic modeling.
iii. Areas inundated by floodwaters are delineated on paper maps.
Fig. 1 Concept of floodplain area [4]
Generally, this study presents the one-dimensional HEC-RAS hydraulic model of Sembrong river. The result will be discussed at the end of this paper to determine the floodplain area along Sembrong river. This study also permits HEC-RAS as an effective source of data in the floodplain management, rivers development planning, addressing public awareness and in flood evacuation planning.
2.
HEC-RAS Hydraulic Model
"HEC-RAS" is derived from the creators of the software: Hydrologic Engineering Center, which stands as a subdivision of the Institute of Water Resources, U.S Army Corps of Engineers (HEC), and "RAS" is an acronym from "River Analysis System” [6]. HEC has launched a computer model of HEC-2 to help engineers to determine the hydraulic analysis of river flows and floods.
HEC-RAS is a one dimensional steady flow model which intended for computation of water surface profile computations. HEC-RAS itself has four main river analysis possibilities: the constant flow rate at the surface of a considered river profile; simulation of an unsteady flow of water; calculations of the sediment transport and modifications of the river bed; and analysis of the water quality [7]. Other than its function that is well-suited for developing flood inundation maps for a variety application, it also can been used for the simulation of one-dimension or two-dimensions of the flood evolution [6]. The model results of HEC-RAS are typically applied in floodplain management and flood insurance studies in order to evaluate the effects of floodway encroachments [8].
3.
Materials and Methods
A methodology for developing hydraulic modeling output from HEC-RAS was presented as Figure 2. In HEC-RAS, there was a series of cross sections called river station that will present the stream morphology. The
river station number will increase when proceeding from downstream to upstream station. The distance between adjacent cross-sections is termed the reach length. While, a series of lateral and elevation coordinates will present each cross-section and usually obtained from land surveys. The numbering of the lateral coordinates begins at the left bank of the cross-section (looking downstream) and increases until reach the right bank. Figure 3 shows the result when each of the cross-sections has its own local coordinate system.
The coordinate of any given point in HEC-RAS system is based on its river station along a one-dimensional stream centerline, location along the cross-section line, and its elevation. Most of the data obtained in this study was in the form of drawing plan from Department of Irrigation and Drainage Batu Pahat. Drawing plan was obtained in the year of 1988, after the alignment of Sembrong River was made.
153
Fig. 3 HEC-RAS cross-section coordinates
3.1
Study Area
Sembrong river catchment area in Johor was chosen as the study area. Sembrong river has a drainage length of 22.3 km that covers 273 km2. It originates from
Sembrong Dam and flows through south-eastern part of Johor and afterward flows into Bekok River and Simpang Kanan River. Figure 4 shows the flow of study area. Total of 65 cross-sections were used for this analysis, starting from the downstream of river (station 1) to the upstream of river (station 65). Each of the cross-sections in one station had a length of 344 m approximately. The land usage activities along this river inclusive of industrial areas, residential areas and agriculture activities, such as palm oil mill and paddy fields [9]. As a significant catchment area, a floodplain mapping ought to be developed as to provide information and ease the rescue and relief operations during flood event.
Fig. 4 Flow of Sembrong river [10]
3.2 Primary Data Collection
Appropriate and comprehensive data collections are significant to the effectiveness of the floodplain mapping. Data collection that obtained either from survey works or secondary sources can be divided into several categories:
i. Ground survey: The purpose of conducting site visit and ground survey is to be familiar, identify, and investigate the flood-prone area and flood-affected areas. Several data such as floodplain physical characteristic, existing flood condition, flow behavior
of pre and post flooding events are paramount and need to be collected during site visits.
ii. Historical flood data: During validation and calibration process, historical flood data are the most important data to be collected because it helps in the analysis process of flood vulnerable zone. Data such as historical flood event report, flood maps on related areas, newspaper reports or article relating previous flood event at selected area, water level record, stream flow and evaporation record are to be taken in.
3.3 Secondary Data Collection
Before HEC-RAS program is run, it requires several input parameters for the process of hydraulic geometry of river channel flow and water movement analysis. These parameters are used to obtain a series of cross-sections along the stream. The cross section is located in a relatively short period of time along the river to characterize the flow carrying capacity and the adjacent flood plain. The cross section is required at each location along the flow and the location of where changes occur in the form of discharge flow rate, pitch, shape and roughness.
HEC-RAS software divides the cross section in that manner so that it can differentiate hydraulic parameters that are available. For example, the wetted perimeter in the floodway is much higher than in the main channel. Thus, friction forces between the water and channel bed have a greater influence in flow resistance in the floodway. Thus, the flow velocity and conveyance are substantially higher in the main channel than in the floodway. At each cross-section, to describe shape, elevation and relative location, HEC-RAS uses several parameters such as:
i. River station (cross-section) number ii. Left and right bank station locations
iii. Lateral and elevation coordinates for each terrain point (dry or un-flooded)
iv. Reach lengths between left floodway, stream centerline and right floodway of adjacent cross-sections
v. Manning’s roughness coefficients
vi. Channel contraction and expansion coefficients vii. Geometric description of any hydraulic structures
such as bridges and culverts
In this study, Manning’s roughness value, ŋ of 0.03 was considering since the channel was normal with clean straight grassed banks.
3.3.1 Water flow rate computation
Flow data and the condition of boundary river system are needed to produce a steady stream data that contains multiple profiles. At least one flow must be provided for each access of the system and the flow can be changed at any location within the river system. The total flow must be entered for all profiles.
Different flow rate (Eq. 1) should be included in the analysis to determine the level of drainage capacity to Downstream
of river
154
accommodate the flow rate. Total of 7 flow rate values or profile flow (PF) (0.0005, 0.001, 0.009, 0.07, 0.1, 0.9, and 24) (m3/s) were applied to indicate an increase in the
water level and also to determine the ability of Sembrong River to accommodate the additional water that flow into the river. While, border drainage system is necessary in making the maximum water level of the river system either in upstream or downstream state. Figure 5 shows flow rate values and boundary condition of drainage system when inserted into HEC-RAS.
Q = V1A1 = V2A2 (1)
where:
Q = Flow rate/discharge (m3/s)
Vn = Average velocity at cross-section n (m/s)
An = Area at cross-section n (m2)
Fig. 5 HEC-RAS flow rate values and steady flow boundary conditions
3.
Results and Discussion
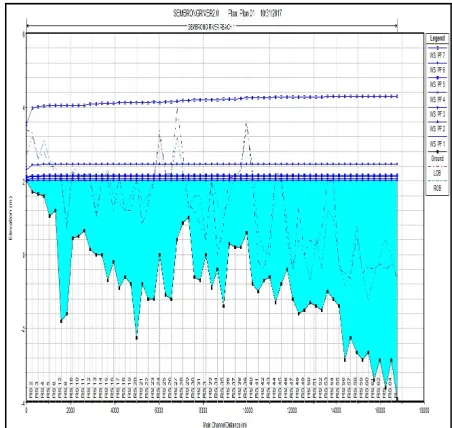
HEC-RAS using several data such as cross section, flow rate and condition of boundary system was presented much output other than cross-section for each station that was water surface profile and can be seen in Figure 6. Figure 6 shows water surface profile in general including its stations.
Hydraulic analysis of steady flow simulation that performed by using different flow rate value shows difference elevation of water surface. Water elevation was increasing from the downstream to the upstream of river. The difference between water level at the downstream (Station 1) and at the upstream (Station 65) was 5m approximately.
Fig. 6 Water surface profile along Sembrong river
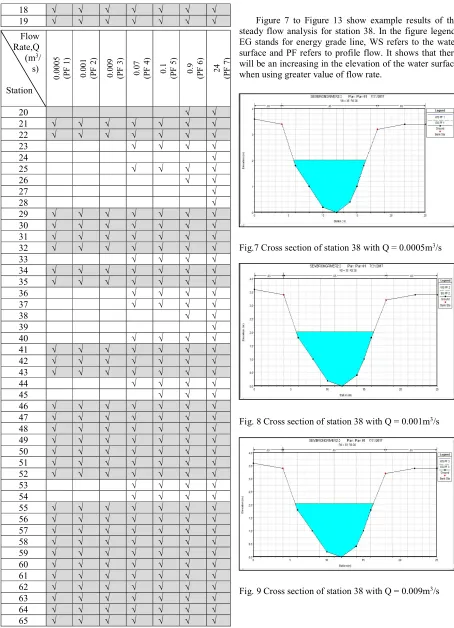
Several station had been detected to be submerged because of the overflowing of water into the river bank station. Table 1 shows flooded stations with different flow rate values. The marked signed in the table indicated that the station starting to flood. There were 33 stations that flooded starting with minimum flow rate of 0.0005 m3/s to the maximum one, 24 m3/s.
Table 1 Flooded station with different flow rate value
Flow Rate,Q (m3/
s)
Station
0.
00
05
(P
F
1)
0.
00
1
(P
F
2)
0.
00
9
(P
F
3)
0.
07
(P
F
4)
0.
1
(P
F
5)
0.
9
(P
F
6)
24
(P
F
7)
1 √
2 √
3 √
4 √
5 √ √
6 √ √
7 √ √ √ √
8 √ √ √ √ √ √ √
9 √ √
10 √ √ √ √
11 √ √ √ √
12 √ √ √
13 √ √ √ √ √ √ √
14 √ √ √ √ √
15 √ √ √ √ √ √ √
16 √ √
155
18 √ √ √ √ √ √ √
19 √ √ √ √ √ √ √ Figure 7 to Figure 13 show example results of the
steady flow analysis for station 38. In the figure legend, EG stands for energy grade line, WS refers to the water surface and PF refers to profile flow. It shows that there will be an increasing in the elevation of the water surface when using greater value of flow rate.
Fig.7 Cross section of station 38 with Q = 0.0005m3/s
Fig. 8 Cross section of station 38 with Q = 0.001m3/s
Fig. 9 Cross section of station 38 with Q = 0.009m3/s
Flow Rate,Q (m3/
s)
Station
0.
00
05
(P
F
1)
0.
00
1
(P
F
2)
0.
00
9
(P
F
3)
0.
07
(P
F
4)
0.
1
(P
F
5)
0.
9
(P
F
6)
24
(P
F
7)
20 √ √
21 √ √ √ √ √ √ √
22 √ √ √ √ √ √ √
23 √ √ √ √
24 √
25 √ √ √ √
26 √ √
27 √
28 √
29 √ √ √ √ √ √ √
30 √ √ √ √ √ √ √
31 √ √ √ √ √ √ √
32 √ √ √ √ √ √ √
33 √ √ √ √
34 √ √ √ √ √ √ √
35 √ √ √ √ √ √ √
36 √ √ √ √
37 √ √ √ √
38 √ √
39 √
40 √ √ √ √
41 √ √ √ √ √ √ √
42 √ √ √ √ √ √ √
43 √ √ √ √ √ √ √
44 √ √ √ √
45 √ √ √
46 √ √ √ √ √ √ √
47 √ √ √ √ √ √ √
48 √ √ √ √ √ √ √
49 √ √ √ √ √ √ √
50 √ √ √ √ √ √ √
51 √ √ √ √ √ √ √
52 √ √ √ √ √ √ √
53 √ √ √ √
54 √ √ √ √
55 √ √ √ √ √ √ √
56 √ √ √ √ √ √ √
57 √ √ √ √ √ √ √
58 √ √ √ √ √ √ √
59 √ √ √ √ √ √ √
60 √ √ √ √ √ √ √
61 √ √ √ √ √ √ √
62 √ √ √ √ √ √ √
63 √ √ √ √ √ √ √
64 √ √ √ √ √ √ √
156
Fig. 10 Cross section of station 38 with Q = 0.07m3/s
Fig. 11 Cross section of station 38 with Q = 0.1m3/s
Fig. 12 Cross section of station 38 with Q = 0.9m3/s
Fig. 13 Cross section of station 38 with Q = 24m3/s
In this analysis, river water will overflow and exceed the river bank station when the maximum flow rate is performed. Figure 14 shows the example of drainage condition at flooded station 65. It was found that the cross-section was in an inappropriate condition even to accommodate the minimum flow rate value.
Fig. 14 Drainage condition at flooded station 65
4.
Summary
157
Thus, the flow will come out of bank earlier than in reality and the water surface elevation in the overbanks also will be slightly lower than in reality. Flooded areas that are close to the populated areas will cause a lot of complications and losses to the public.
This study can be useful information to the authorities, such as DID itself to plan a more systematic and efficient drainage system so that the problem can be resolved. Other than that, results from this analysis also can be used in planning and designing since the errors due to the one-dimensionality of HEC-RAS are typically suitable for watershed-level-analyses.
5.
Acknowledgement
The author would like to express gratitude to the Ministry of Higher Education Malaysia, Department of Irrigation and Drainage Malaysia Batu Pahat and Universiti Tun Hussein Onn Malaysia for the support in preparing this paper. This paper was partly sponsored by the Centre for Graduate Studies UTHM. Grateful acknowledgement also goes to all that are involved directly and indirectly in completing the paper.
References
[1] Vorogushyn, S., Lindenschmidt, K.E., Kreibich , H., Apel, H., Merz, B. Analysis of a detention basin impact on dike failure probabilities and flood risk for a channel-dike-floodplain system along the river Elbe, Germany. J. Hydrol. 2012. 436, 120-131. [2] Adnan, M.S., Rahmat, S. N., Tan, L. W., Rosly, N.,
& Shimatani, Y. (2016). Application of SWAT and GIS to simulate the river flow of the Sembrong River, Johor, Malaysia: Proceedings of the International Conference on Civil, Architectural, Structural and Constructional Engineering, Dong-A University, Busan, South Korea, August 21-23, 2015. 393-397. 10.1201/b19961-84.
[3] Salajegheh, A., A.R. Keshtkar, S. Dalfardi. To Study of the Appropriate Probability Distributions for Annual Maximum Series Using L-Moment Method in Arid and Semi-arid Regions of Iran. 2008.
XIII World water congress, 1-4 Sep., Montpellier, France.
[4] Burrough, P.A. Principles of geographical information systems for land resources assessment.
Oxford: Clarendon Press. 1986
[5] Jones, J.L., T.L.Haluska, A.K. Williamson, and M.L. Erwin. Updating Flood Maps Efficiently: Building on Existing Hydraulic Information and Modern Elevation Data with a GIS. 1998. USGS Open-File Report 98-200.
[6] Iosub Marina. The Use Of Hec-Ras Modelling In Flood Risk Analysis ,U.S. Army Crops of Engineers. 2003, HEC-RAS User Manual. Davis, C [7] Tate, E., Maidment, D. Floodplain Mapping Using
HEC-RAS and ArcView GIS, Center For Research in Water Resources. 1999. Austin – Texas, p. 223.
[8] USACE, "Hydraulic Engineering Centre - River Analysis System" HECRAS Manual Application Guide - Chapter 10 Stream Junction, 2006. 207-222 [9] Marina Mazlan, M. Adib Razi, M.S. Adnan., Mustafa
Anjang, Lai Wai Tan. Hydrodynamic Modelling and Flood Mapping of Sembrong Catchment Area. 2014. 13th International Conference on Urban
Drainage, 7-12 Sep., Sarawak, Malaysia.
![Fig. 1 Concept of floodplain area [4]](https://thumb-us.123doks.com/thumbv2/123dok_us/8439178.1700693/2.612.81.302.126.249/fig-concept-of-floodplain-area.webp)
![Fig. 4 Flow of Sembrong river [10]](https://thumb-us.123doks.com/thumbv2/123dok_us/8439178.1700693/3.612.81.301.293.561/fig-flow-sembrong-river.webp)