Two-Dimensional Electron Temperature and Density Measurement
during Strong Guide-Field Reconnection by using Slide-Type
Thomson Scattering System
∗
)
Xuehan GUO, Michiaki INOMOTO, Takumichi SUGAWARA, Takenori G WATANABE,
Kotaro YAMASAKI
1), Tomohiko USHIKI and Yasushi ONO
Graduate School of Frontier Science, The University of Tokyo, Kashiwa 277-8561, Japan
1)Graduate School of Engineering, The University of Tokyo, Bunkyo 113-8656, Japan
(Received 25 November 2014/Accepted 26 January 2015)
In UTST device, magnetic reconnection with strong guide-field (strong guide-field reconnection) takes place during the ST merging period. To evaluate the energy conversion by magnetic reconnection quantitatively, the measurement of the electron temperature and density with a high confidence and accuracy is required. We devel-oped a novel slide-type two-dimensional Thomson scattering measurement system to evaluate electron heating during strong guide-field magnetic reconnection in the UTST device.
c
⃝2015 The Japan Society of Plasma Science and Nuclear Fusion Research
Keywords: magnetic reconnection, plasma merging, Thomson scattering, two-dimensional, slide-type DOI: 10.1585/pfr.10.3402017
1. Introduction
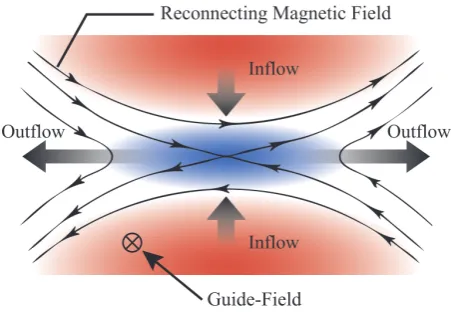
Magnetic reconnection [1, 2], the breaking and topo-logical rearrangement of magnetic field lines in plasma is an important fundamental process in a broad range of magnetized plasmas, which converts magnetic energy to particle energy. Guide-field, the component of magnetic field which is perpendicular to the reconnection plane (Fig. 1), plays an important role of the magnetic recon-nection. Magnetic reconnection occurs everywhere in the universe, such as solar atmosphere, magnetosphere, astro-physical objects and fusion plasmas and also contains a significant guide-field in comparison with the reconnect-ing magnetic field.
Magnetic reconnection is usually formulated as a steady collision-dominated event described by resistive magneto-hydrodynamics (MHD). Observations in nearly collision-less space and laboratory plasmas, however, show that the energy dissipation rate during reconnection of the classical Sweet-Parker model based on MHD pic-ture [3] is small due to the slow reconnection rate. The re-cent numerical particle simulation shows that the collision-less magnetic reconnection is triggered by the meandering orbit [4] effect when the current sheet is compressed as thin as an average orbit amplitude of meandering particles [5].
However, a major question, the mechanism of energy conversion from magnetic energy to particle energy still remains unsolved. Recent theoretical and numerical stud-ies have revealed two fluids and/or kinetic effects of both ions and electrons play an important role in collision-less author’s e-mail: [email protected]
∗)This article is based on the presentation at the 24th International Toki
Conference (ITC24).
Fig. 1 A typical reconnection geometry illustrating the recon-necting magnetic field, the flow pattern, and the out-of-plane current density (shaded region). The guide-field and reconnection electric field are also perpendicular to the plane.
magnetic reconnection [6, 7]. Generation of non-thermal particles and their behavior often governs local reconnec-tion dynamics in particle-in-cell (PIC) simulareconnec-tions, how-ever, the entire energy conversion mechanism including particle acceleration and thermalization still remains un-clear.
On the other hand, strong electron heating during plasma merging was observed in MAST spherical tokamak experiment by using 1-dimensional (radial) multi-channel Thomson scattering system [8]. The electron temperature profiles peaked sharply at the X-point during strong guide-field magnetic reconnection in MAST [9].
c
⃝2015 The Japan Society of Plasma
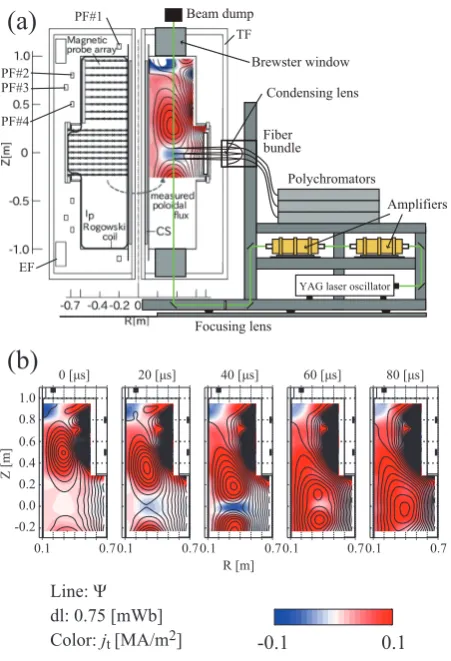
Fig. 2 (a) Cross-section at the view of UTST device shown to-gether with the internal diagnostics of magnetic probe array and schematic view of slide-type two-dimensional Thomson scattering measurement system [11]. (b) Time evolution of magnetic flux surfaces (line contour) and toroidal current density (color) of typical discharge mea-sured by the magnetic probe array.
In this paper, we present development of two-dimensional Thomson scattering measurement system to measure the electron temperature and density during strong guide-field magnetic reconnection in UTST [10]. We adopted a new method to slide radially the whole 1-dimensional Thomson scattering system that measure axi-ally [11]. As a result, the electron heating during strong guide-field reconnection was successfully observed with high accuracy.
2. UTST Device
In UTST, the initial plasmas are formed by PF coils in both upper and lower sections and then, these two ini-tial plasmas merge together through magnetic reconnec-tion as illustrated in Fig. 2 (a). Unlike TS-3/TS-4, START and MAST, all coils are placed outside the vacuum vessel. Table 1 shows the main parameters of the UTST de-vice. Typical reconnection magnetic field (poloidal field in the up-stream region) is 15 mT, while the guide-field (toroidal field) at the X-point is 250 mT, which is much larger than the reconnection field. Line contour and color
Table 1 The UTST Parameters.
Chamber radius [m] 0.7 (midplane) 0.6 (top and bottom)
Chamber height [m] 2.0
Toroidal field [mT] 250
Poloidal field [mT] 15
Major radius [m] 0.35
Minor radius [m] 0.20
Plasma current [kA] 60 (w/o CS) 180 (with CS)
Discharge gas Helium
ion gyro radius [cm] 0.5
electron inertia length [cm] 0.2 ion inertia length [cm] 10
of Fig. 2 (b) show time evolution of two-dimensional mag-netic flux surfaceΨand toroidal current density jtduring
the typically plasma merging experiment in UTST, respec-tively. These values can be derived from the magnetic field measured directly from two-dimensional magnetic probe array inside the vacuum vessel. The magnetic probe array has 128 channels in the upper section and 162 channels in the central section to measure the magnetic fieldBtandBz. By assuming the toroidal symmetry, magnetic flux surface
Ψ, toroidal current density jtand toroidal electric fieldEt
are calculated from measured magnetic fieldBtandBz.
3. Slide-Type Two-Dimensional
Thomson Scattering Measurement
System
To investigate the energy conversion mechanism of magnetic reconnection, we developed a novel slide-type two-dimensional Thomson scattering measurement system (Fig. 2 (a)) to evaluate electron heating in the strong guide-field magnetic reconnection in the UTST. Thomson scat-tering diagnostics have been used widely as a most reli-able diagnostics for electron temperature and density pro-file measurements. However, two-dimensional diagnostics of Thomson scattering have not been used widely in fu-sion experiment devices, because of requirement of many laser channels and spectrometers, which inevitably results in large-scale experimental facilities and high costs.
Fig. 3 Schematic view of the polychromator. This contains a collimation lens and four interference filters, lens ele-ments and electric circuits including an avalanche photo diode.
condensing lens, and transferred to polychromators. The axial resolution is determined according to the fiber po-sitions and the highest axial resolution is 5 mm. At the laser beam path, the images of the optical fibers are about 2.2 mm, which is smaller than the axial resolution. Since the wave vectors of the injection laser and the observed scattered light are in axial (z-) and radial (r-) directions, respectively, the system measures the electron temperature perpendicular to the toroidal guide-field.
The laser beam passed from an upper Brewster win-dow of the UTST device is focused to a beam dump by an upper lens. The absorptive neutral density glass beam dump consists of narrow blades creating a surface at a steep angle to the direction of the laser beam propagation. The upper lens and beam dump are located outside the vacuum vessel of the UTST and can be adjusted to the sliding laser path of helium neon alignment laser beam through the vac-uum vessel.
3 polychromators were assembled for the slide-type 2-D Thomson scattering system. Each polychromator contains a collimation lens, four interference filters, lens elements (relay lenses and focusing lenses) and APDs (avalanche photo diode) with preamplifier circuit. Figure 3 shows the schematic view of the polychromator. Each polychromator measures four different wavelength bands. Transmission ranges of the four interference filters are 1059 1051 (channel 1), 1055 1045 (channel 2), 1053 -1037 (channel 3), 1051 - 1009 nm (channel 4). Each inter-ference filter has high blocking power (>105) at 1064 nm, the wavelength of Nd:YAG laser, to reduce the stray light.
The position of the condensing lens and optical fibers are adjusted by measurement of Raman scattered light from nitrogen gas. The polarization of Raman scattered light is considered in absolute calibration that allows us to calculate the electron density from the intensity of Thom-son scattering signals.
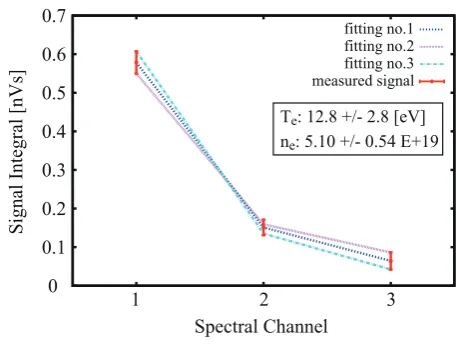
In order to maximize the signal-noise ratio, the sig-nals from APDs are integrated with time (called integrals in this paper), because the electric noise is non-stationary in time. The calculation of electron temperature and den-sity from integrals of Thomson scattering signals is per-formed by the least-squares method. Figure 4 shows a sample of the fittings to obtain the electron temperature
Fig. 4 The spectral fit performed to the signal integrals to obtain the electron temperature and density. The horizontal axis is the channel number of the APDs in a polychromator.
and density from integrals of Thomson scattering signals. The fitting of number 1 was calculated with the condi-tion that minimizes the sum of squared residuals. The fit-ting number 2 and 3 are the minimum/maximum electron density (maximum/maximum electron temperature) calcu-lated with the condition that maximizes the sum of squared residuals within the measurement errors, respectively. The noise integral is about 0.02∼0.03 nVs, which is about 5% of signal in channel 1, 15% of signal in channel 2, 40% of signal in channel 3, respectively.
To estimate the converted energy by magnetic recon-nection quantitatively, the measurement of the electron temperature and density with a high confidence and accu-racy is required. In other words, estimating an error of the measurement system is important. The fitting error of this measurement system, which is about±2 eV and±0.5×10¹⁹ of the electron temperature and density respectively, allows us to estimate the gain energy of electrons by magnetic re-connection.
4. Experimental Results
Figure 5 shows the time evolution of the two-dimensional magnetic field structure measured by the mag-netic probe array, in which the toroidal current density is shown by red/blue color. During magnetic reconnec-tion, radially elongated current sheet region similar to that predicted in classical Sweet-Parker model is clearly ob-served. In the UTST device, the magnetic reconnection event started at 751µs (defined as the timing when 10% of the upstream magnetic flux was reconnected) and ended at 804µs defined as the timing when 90% of the upstream magnetic flux was reconnected).
X-Fig. 5 Time evolution of magnetic flux surfaces (line contour) and toroidal current density (color contour) during the plasma merging experiment (strong guide-field magnetic reconnection).
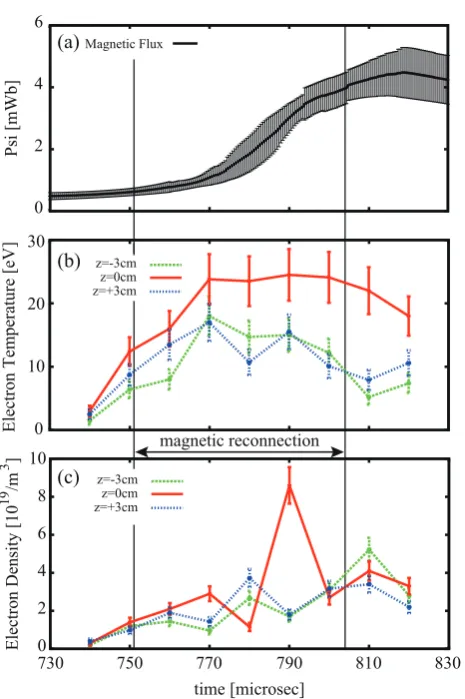
Fig. 6 Time evolutions of (a) reconnected magnetic flux at X-point, (b) electron temperature and (c) density at X-point (red) and upstream (blue and green).
point took place during strong guide-field magnetic recon-nection whereas the electron temperature outside current sheet (z = ±3 cm) showed clearly low temperature than that at the X-point. The electron heating (from 11 eV to 23 eV) that we measured was more meaningful than the fitting error of 4 - 5 eV. The electron density was peaked at
t=790µs, which was probably transient plasma pile-up in-side the current sheet. During current sheet formation, the reconnection inflow flux tends to exceed the outflow flux, increasing the plasma density at X-point, while the plasma pile-up decreases during completion of reconnection [12]. Figure 7 (a) shows the magnetic flux surfaces dur-ing strong guide-field magnetic reconnection and mea-surement positions of two-dimensional Thomson scatter-ing measurement system in UTST. We measure an axial profile of electron temperature and density (z=−3, 0 and 3 cm) in a single discharge and scan every 1.5 cm radially to measure their two-dimensional profiles.
Figures 7 (b) and (c) show the two-dimensional pro-files of electron temperature and density during magnetic reconnection, respectively. Though the spatial variation of the electron temperature and density was not very large, the new slide-system of Thomson scattering measurement has sufficient performance for observation of the energy con-verted to electrons from magnetic energy during magnetic reconnection. Figure 7 (d) shows the two-dimensional pro-files of electron pressure calculated from Figs. 7 (b) and (c). The plasma inflow from top and bottom of these fig-ures exceed the outflow flux to left and right sides, causing a significant increase in the plasma density at X-point.
5. Summary
Experimental observation of electron temperature and density are described during strong guide-field magnetic reconnection. We developed a novel slide-type two-dimensional Thomson scattering measurement system in UTST to measure the electron temperature and density
dur-ing magnetic reconnection. Usdur-ing this measurement sys-tem, we found localized electron heating at the X-point during strong guide-field magnetic reconnection. Two-dimensional profiles of electron temperature as well as density indicate clearly their peaked profiles during mag-netic reconnection. To evaluate the energy conversion mechanism of magnetic reconnection, further experimen-tal studies are required to clarify their dependencies on plasma parameters: the scaling of the electron energy in-crement with the reconnecting field and the guide-field.
Aknowledgement
The authors wish to acknowledge many helpful ad-vices from Prof. K. Narihara and Prof. S. Okada. This work was supported by JSPS A3 Foresight Program “In-novative Tokamak Plasma Startup and Current Drive in Spherical Torus”, JSPS Core-to-Core Program 22001, Grant-in-Aid for Scientific Research (KAKENHI) 2628-7143, 25820434, 22686085, 22246119, and the NIFS Col-laboration Research program (NIFS14KNWP004).
[1] M. Yamada, R. Kulsrud and H. Ji, Rev. Mod. Phys.82, 603 (2010).
[2] E.G. Zweibel and M. Yamada, Annu. Rev. Astron. Astro-phys.47, 291 (2009).
[3] E. Parker, J. Geophys. Res.62, 509 (1957). [4] T.W. Speiser, J. Geophys. Res.70, 4219 (1965). [5] R. Horiuchi and T. Sato, Phys. Plasmas4, 277 (1997). [6] R. Horiuchi, S. Usami and H. Ohtani, Plasma Fusion Res.
9, 1401092 (2014).
[7] J.F. Drake, M.A. Shay and M. Swisdak, Phys. Plasmas15, 042306 (2008).
[8] R. Scannellet al., Rev. Sci. Instrum.81, 10D520 (2010). [9] Y. Onoet al., Plasma Phys. Control. Fusion54, 124039
(2012).
[10] T. Yamadaet al., Plasma Fusion Res.5, S2100 (2010). [11] X. Guo, M. Inomoto and Y. Ono, IEEJ Trans. FM.134, 9
(2014).