M. H. F. Hazza and N. A. Najwa
Department of Manufacturing and Materials Engineering International Islamic University Malaysia
PO Box 10, 50728 Kuala Lumpur, Malaysia E-mail: [email protected]
Optimization of Cutting Parameters to Minimize Tooling Cost in High
Speed Turning of SS304 Using Coated Carbide Tool using Genetic
Algorithm Method
Muataz Hazza F. Al Hazza, Nur Amirah Najwa Bt Mohmad Bakhari
Received: 17 August 2016 Accepted: 30 August 2016 Published: 05 September 2016 Publisher: Deer Hill Publications © 2016 The Author(s)
Creative Commons: CC BY 4.0
ABSTRACT
High speed turning (HST) is an approach that can be used to increase the material removal rate (MRR) by higher cutting speed. Increasing MRR will lead to shortening time to market. In contrast, increasing the cutting speed will lead to increasing the flank wear rate and then the tooling cost. However, the main factor that will justify the best level of cutting speed is the tooling cost which merges all in one understandable measurable factor for manufacturer. The aim of this paper is to determine experimentally the optimum cutting levels that minimize the tooling cost in machining AISI 304 as a work piece machined by a coated carbide tool using one of the non-conventional methods: Genetic Algorithm (GA). The experiments were designed using Box Behnken Design (BBD) with three input factors: cutting speed, feeding speed and depth of cut and three machining levels.
Keywords: High speed turning, tooling cost, AISI 304, MRR
1 INTRODUCTION
The development of advanced manufacturing technology has been growing up rapidly. One of the advanced approaches is by increasing the machining speed to increase material removal rate and then shortening time to market, lowering cost, high accuracy and better quality. One approach for reducing the machining time in machining is by increasing the speed turning. High speed turning is difficult to define due to the fact of materials are varied for their hardness. Therefore, high speed turning for one material may still be a low speed for another for example; the high speed for titanium is a low speed for aluminium [1]. However, these technologies should be justified by economic study. One of the most effective tools for economic study is by developing a cost model.
In high speed turning the machining zone will be under high temperature and high sliding velocity. Therefore, the wear progress will be difficult to estimate and predict. However, the wear rate of the cutting tool may give unacceptable outputs and that will result a low quality of surface roughness [2]. However, estimating the tool wear is highly valuable to estimate the tooling cost due to the relationship of tool life and material removal during the life of tool. However, tool insert may reaches its life and should be removed and changed before the tool insert edge cannot give the desired and accepted roughness. If the cutting tool reaches its life very fast then this will lead to increase the tooling cost becomes. Therefore, the manufacturer needs to determine the best cutting levels that minimize the tooling cost. Thus, estimating and then determining the best levels of the independent factors in machining becomes critical and important.
2 METHODOLOGY
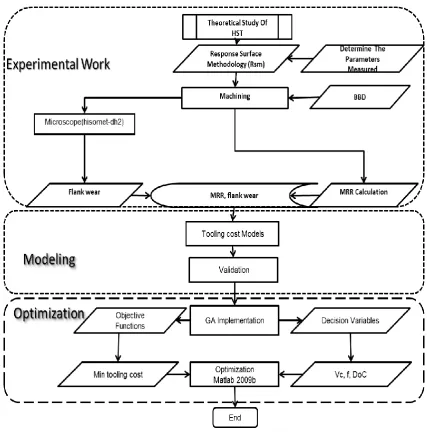
The methodology was three related integrated parts: firstly, the experimental work based on the theoretical study, then developing the cost model based on the experimental work. Finally, using the genetic algorithm in order to determine the best cutting levels that will give the minimum tooling cost. Box Behnken design (BBD) has been used in this research to conduct the experimental work for three independent factors: cutting speed, feeding speed and depth of cut. Three levels: –1, 0, and 1. However, BBD is easy to conduct in addition to the ability of sequentially. Figure 1 concluded the activities and tasks need to be done in order to achieve the objective of the research in developing tooling cost and then determine the optimum cutting parameters to minimize the tooling cost in high speed turning for SS304 Using Coated Carbide Tool.
Figure 1: Research methodology.
3 EXPERIMENT PROCEDURE
Table 1: Machining levels.
Max Min
Cutting speed (m/min) 500 700
Feeding speed (mm/min) 1000 2000
Depth of cut (mm) 0.1 0.3
4 DEVELOPMENT OF TOOLING COST MODEL
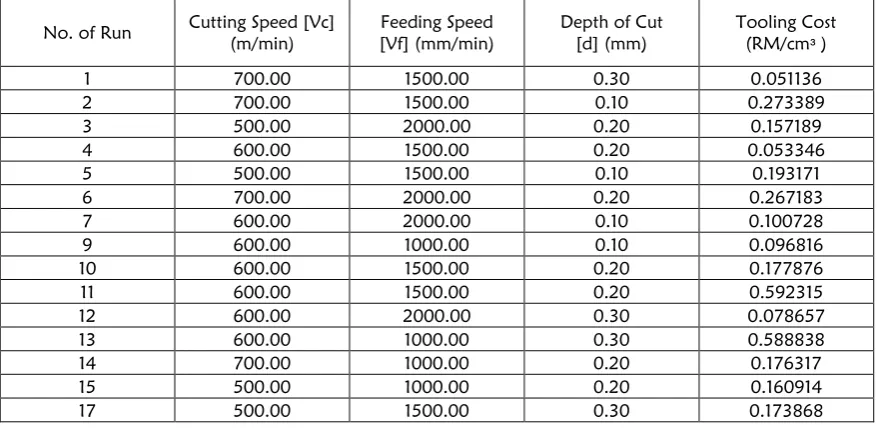
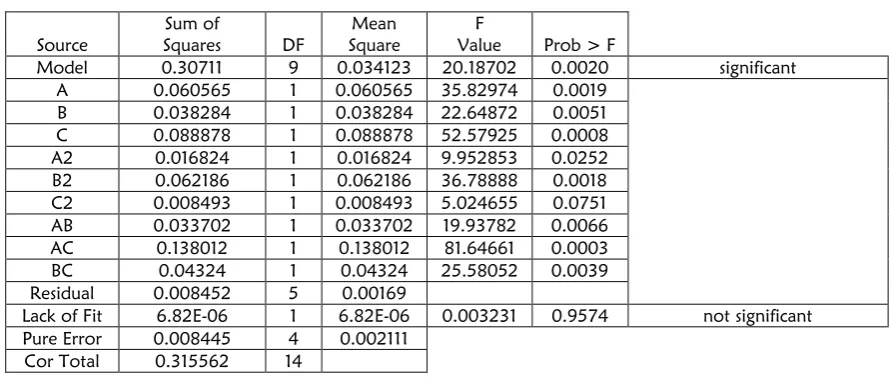
Tooling cost model developed based and is limited in this research to the cost of tool holder and tool insert. The model was developed based on calculating the cost of removal one cubic centimetre. Actually, tooling cost is inversely proportional with tool life and proportional with the machining time Therefore, the tooling cost is calculated based on the work of [4-7]. The machining time components used in this research was based on machining time model developed by [6]. However, the final tooling cost was calculated based on the following equation [3]: However, all the experimental results is concluded in Table 2. The results was analysed using the DoE 6.0.8. The analysis of variance (ANOVA) was conducted to develop an empirical model that can be used to estimate the tooling cost. Analysis of variance (ANOVA) is concluded in Table 3 which shows significant with value of 0.002 and lacks of fit of 0.9574. Therefore, the model can be used to navigate the design space. The following model has been used to determine the optimum cutting levels in the boundary of the design that can minimize the tooling cost.
5 GENETIC ALGORITHM
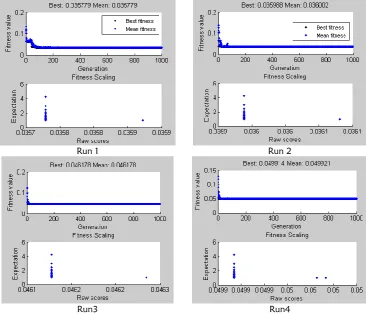
The genetic algorithm has been implemented using the developed model in the previous section in order to minimize the total tooling cost using three different independent decision variables: cutting speed, feed speed and depth of cut. Table 4 concluded the objective functions decision variables, constrains. In the implementation, the chromosome values of each individual are generated randomly from the ranges of these values. However, the simulation has been repeated for four different runs, each for 1000 iterations. The optimum results was concluded in Table 5. Finally Figure 2 shows the results for different runs that give the minimum tooling cost. The results show for different runs that after 100 iterations the values of the objective function become stable and only few points are giving results far from the final one.
3
3
(
)
(
/
)
(
)
Tc
C
Rm
Cost Rm Cm
MRV cm
Table 2: Result of experiment.
No. of Run Cutting Speed [Vc] (m/min) [Vf] (mm/min) Feeding Speed Depth of Cut [d] (mm) Tooling Cost (RM/cmᵌ)
1 700.00 1500.00 0.30 0.051136
2 700.00 1500.00 0.10 0.273389
3 500.00 2000.00 0.20 0.157189
4 600.00 1500.00 0.20 0.053346
5 500.00 1500.00 0.10 0.193171
6 700.00 2000.00 0.20 0.267183
7 600.00 2000.00 0.10 0.100728
9 600.00 1000.00 0.10 0.096816
10 600.00 1500.00 0.20 0.177876
11 600.00 1500.00 0.20 0.592315
12 600.00 2000.00 0.30 0.078657
13 600.00 1000.00 0.30 0.588838
14 700.00 1000.00 0.20 0.176317
15 500.00 1000.00 0.20 0.160914
Table 3: ANOVA table for tooling cost.
Source Squares Sum of DF Square Mean Value F Prob > F
Model 0.30711 9 0.034123 20.18702 0.0020 significant A 0.060565 1 0.060565 35.82974 0.0019
B 0.038284 1 0.038284 22.64872 0.0051 C 0.088878 1 0.088878 52.57925 0.0008 A2 0.016824 1 0.016824 9.952853 0.0252 B2 0.062186 1 0.062186 36.78888 0.0018 C2 0.008493 1 0.008493 5.024655 0.0751 AB 0.033702 1 0.033702 19.93782 0.0066 AC 0.138012 1 0.138012 81.64661 0.0003 BC 0.04324 1 0.04324 25.58052 0.0039 Residual 0.008452 5 0.00169
Lack of Fit 6.82E-06 1 6.82E-06 0.003231 0.9574 not significant Pure Error 0.008445 4 0.002111
Cor Total 0.315562 14
Tooling cost = +1.47020-9.44817E-003* Cutting speed+4.16756E-003 * feed speed-9.82922* depth of cut+7.34688E-006* Cutting speed2-6.96458E-007 * feed speed2 +5.22014* depth of cut2-2.80425E-006* Cutting speed * feed speed+0.018575* Cutting speed * depth of cut-3.17638E-003* feed speed * depth of cut
Table 4: GA objectives, decision variables, constrains and parameters.
Objective function Decision variables constrains Minimize Tooling cost Cutting speed
Feeding speed Depth of cut
500≥Vc≥700 1000≥Vc≥2000
0.1≥Vc≥0.3
Number of Individuals in Population= 20 Number of generation= 1000
Crossover Rate = 35% Mutation Rate = 8%
Table 5: GA optimization results.
Run Cutting speed Feeding speed Depth of cut Tooling cost
1 500 2000 0.3 0.35779
2 500 1989 0.3 0.035988
3 500 1467 0.3 0.046178
Run 1 Run 2
Run3 Run4
Figure 2: four different runs for 1000 iteration.
6 CONCLUSIONS
Results concluded in table 5, show that the main flexible factor is the feeding speed which varied from 1276 to 2000 mm/min. In contrast, the cutting speed and depth of cut is constant with the values of 500 m/min and 0.3 mm. The results show that to minimize tooling cost, the cutting speed should be in the lowest level while the depth of cut should be in the maximum level. In addition the lowest tooling speed will be achieved in the highest feeding speed.
REFERENCES
1. Muataz Hazza F. Al Hazza, H., Nabilah, M. Yusof, B. M., Najwa, N. A., Eikhwan, M., Khazairul, M., & Taha, A. H. (2013). Experimental Study of flank wear in High Speed Turning of Stainless Steel AISI 304. Journal of Advanced Science and Engineering Research, 3(2), 96-103.
2. Ozel, T. and Nadgir, A. (2002). Predictions of flank wear by using back propagation neural network modeling when cutting hardened H-13 steel with chamfered and honed CBN tools. International Journal of Machine Tools & Manufacture, 42(2), 287–297.
3. Adesta, E. Y. T., Al Hazza, M., Agusman, D., & Sutjipto, A. G. E. (2012). Development of Tooling Cost Model for High Speed Hard Turning. Advanced Materials Research, 418, 1482-1485.
4. Gara, S., Bouzid, W., Hbaieb, M., & Amar, M. B. (2007). Cutting speed optimization in high speed turning.
International Review in Mechanical Engineering, 1, 237-244.
5. Gara, S., Bouzid, W., Ben Amar, M. and Hbaieb M. (2008). Cost and time calculation in rough NC turning.
International Journal Advanced Manufacturing Technology, 40(9-10), 971-981.
6. Adesta, E. Y. T., & Al Hazza, M. H. (2011). Machining Time Simulation in High Speed Hard Turning. Advanced Materials Research, 264, 1102-1106.
7. Al Hazza, M. H. F., Konneh, M., Iqbal, M., Taha, A. H., & Hasan, M. H. (2015). Using the Desirability Function as an Effective Tool in Target Costing Model. Advanced Materials Research, 1115, 126-129).