Development of Non-Contact Liquid Level Measurement and Data Storage
System
Muhammad Mahbubur Rashid, Abdullah Al Mamun, Abdul Hassan Jaafar and Md. Sajib Mollik
Received: 10 May 2018 Accepted: 16 July 2018 Published: 15 September 2018 Publisher: Deer Hill Publications © 2018 The Author(s)
Creative Commons: CC BY 4.0
ABSTRACT
The normal contact type liquid measurement devices have some drawbacks since they have potential damage due to the sensor fouling or corrosion since those are continuously exposed to the liquid. Especially flash flood may cause the damage of liquid level sensor. So that, it is important to design a non-contact device for liquid level measurement in order to avoid this constrain. Distance can be measured without contact such as laser, ultrasonic and radar. In this research, ultrasonic sensor is used to provide non-contact feature of the device since it is low cost and uses ultra-sound waves rather than light. This vital sensing device is able to sense uneven surfaces, liquids, clear objects, and objects in dirty environments. This paper discussed the measurement of liquid level in a tank as well as storing historical data.
Keywords: No-contact, Ultrasonic sensor, Liquid level measurement
1 INTRODUCTION
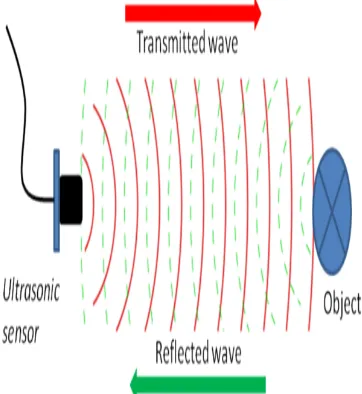
This project is aimed at designing a device that can provide non-contact level measurement of a liquid tank. The meaning of non-contact here is that the device, which is used, for liquid level measurement is not put directly in liquid. Therefore, it will reduce the potential damage of device due to the sensor fouling or corrosion while it continuously exposed to the liquid. The damage might also occur because debris when there is flood. Besides, the non-contact device also allows for easy installation on a bridge or structure over the liquid as safe and easy position. To provide non-contact feature of the device, ultrasonic sensor is used since it uses sound waves rather than light. It has different sensing capability like as uneven surfaces, liquids, clear objects, and objects in dirty environments. The cone-shape wave sound has transmitted by ultrasonic sensors where wave through in air. These sound pulses make echo and sound come back from the liquid surface and are in turn received by the sensor, which measures the time interval between the transmitted and received signal. Electronics device can be measured this distance based on sound speed where it in air [6]. Additionally, distance can be measured various way like as laser and radar. However, because of their expensive price, they are only set on the minority of instruments. Thus, the research of the distance measurement system that consider the high ratio of ability and decreased value has ended at ultrasonic sensor.
9V battery has been used for PIC Microcontroller power, a 2X16 Liquid Crystal Display (LCD), and two MaxSonar-EZ1 ultrasonic Sensor. With a LCD, it will immediately display the height of the liquid level. With the RS232 personal computer (PC) link and Windows software, the data also can be logged into PC and a graph of the liquid level can be plotted. The proposed sensor is low-cost and reliable would be a useful device to measure the liquid level in a tank either at homes, open channel and waste reservoir. It also might be a prodigious agreement and required for the budding buyers.
M. M Rashid1 ,Abdullah A. Mamun2, Abdul Hassan B Jaafar3, Md. Sazib Mollik4 1, 4Department of Mechatronics Engineering
2Department of Civil Engineering 3Department of Mechanical Engineering
International Islamic University Malaysia PO Box 10, 50728 Kuala Lumpur, Malaysia
2 OVERVIEW OF SONAR SYSTEM
Sound Navigation and Ranging (Sonar) is a technique that uses sound propagation to steer, interconnect with or sense other vessels. Sonar might be used as a means of aural location and measurement of the echo characteristics of object in the liquid. Before the introduction of radar, acoustic location in air was used. There are two types of sonar technology which are passive and active sonar. Passive sonar devices will only receive the signal without transmit any signal. It is often used in military settings and in science applications such as fish location and various marine environments. On the other hand, active sonar device consists of a sound transmitter and receiver. A wave of sound could be called a "ping" is created, and then echo or reflections of the pulse will be measured. Sonar Projector has been generated sound wave by electronically. Signal generator, power amplifier and electro-acoustic transducer has been used for this projector.
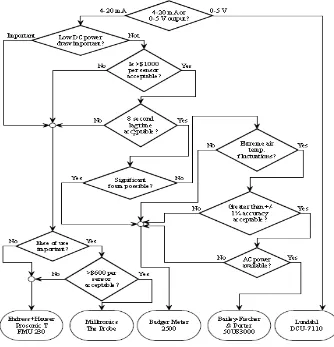
Sonar system had generated sound frequency from lower level to extremely high level. Humans are able to hear sound frequency from 20kHz to 20,000 kHz, where ultrasonic sound frequency range is higher. Music and common sounds that are considered pleasant are typically 12 kHz or less. Ultrasonic waves consist of frequencies which is larger than human lower frequency and it is exist in excess of 25 MHz and this range have used for several applications such as including plastic welding, medicine, jewelry cleaning, and nondestructive test. In nondestructive test, ultrasonic sound frequency has ability to travel in deep “see through" for detecting solid material or any other surface without affecting the material harmfully [1]. The flowchart for appropriate selection of ultrasonic sensor is given below [6]:
3 SYSTEM DESIGN 3.1 System Architecture
In Figure 3, a block diagram of the whole system architecture is presented. The system consists of a PIC 16F877 Microcontroller, two ultrasonic sensors, and a LCD for display. The system also provides a serial communication between the microcontroller and personal computer. The PIC Microcontroller will continuously take the analog signals from the sensors and will directly convert them to digital signal. In this system, no external analog to digital (ADC) is needed since it is already built in the PIC Microcontroller.
3.2. Liquid Level Calculation
The value that input by the sensors is the distance between the sensor and the liquid level and is denoted by d1 as
shown in the figure below. So that, a calculation is needed in order to get the true liquid level of the tank and denoted as d2. The calculation is as follow:
d1 + d2 + 50 = 650 [cm] (1)
So that,
Liquid level = d2 = 600 - d1 [cm] (2)
It is also very important to note that the values that given by the analog port of the PIC Microcontroller are not directly show the liquid level. It needs to multiply by a constant and in order get this constant, a simple calibration needs to be done. First, the sensor will put 50 cm above the liquid level or in other words when the liquid is full tank. The constant that need to be multiplied by current reading then calculated.
Figure 2: Flowchart for selecting an ultrasonic sensor for a specific selection.
Figure 4: Liquid level measurement
3.3 Hardware Components 3.3.1 Microcontroller
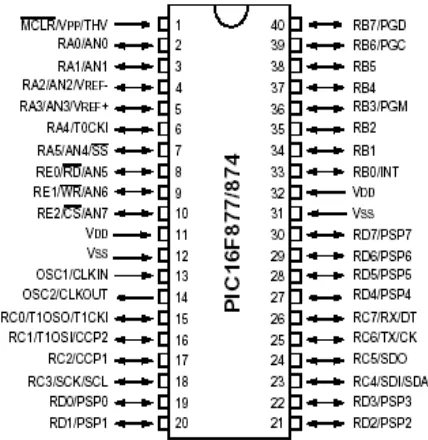
Microcontroller would be used for controlling purpose which is PIC16F877. Data acquisition system will take data from sensors, convert them to analog, calculate the liquid level, and display on LCD as well as on the personal computer. The PIC16F877 has a 25 MHz processor and this compiler runs the processor at 20 MHz, where it has 33 input and output pins, FLASH program memory (8K*14words), RAM (368*8bytes), EEPROM (256*8bytes). This microcontroller runs the program form its own memory because it does not have any operating system. Additionally, PIC16F877 has several hardware features such as an analog to digital converter (ADC), interrupts, timers, and capture/compare/PWM channels.
3.3.2 The Max Sonar-EZI Ultrasonic Sensor
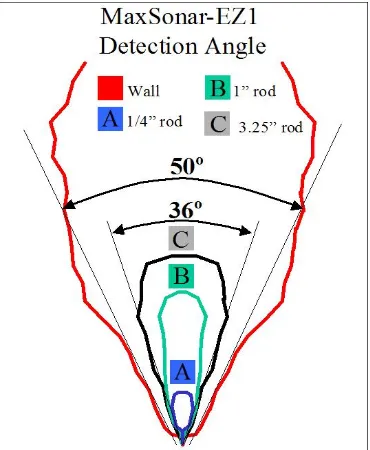
The MaxSonar EZ1 has specific detection range which is very short to long-range. Moreover, it required ultra-low power consumption. It has explicit object detection range, where the range starts from 0-inches to 254-inches and offers sonar range information from inches out to 254-inches with 1-inch resolution. Objects from 0-inches to 6-inches range as 6- 6-inches. It has pulse width output, analog voltage output, and serial digital output for interface with output. The specifications of the sensor are given in the table below (Maxbotix, 2006). For any ultrasonic range finder, the beam width is a function of the sensor used and the system gain following the sensor. Gain capability of the MaxSonarEZ1 is actively and continuously adjusted with itssystem software where it has a long comparatively narrow beam. Figure 6 shows the specification of the MaxSonarEZ1. Majority of the objects are detecting in the central 36-degree zone. The authentic detection zone is look like a cone that extends from the front of the detector face (Maxbotix, 2009).
Table 1: The Maxsonar-EZI sensor specification
Parameter Value
Width 19.9 mm
Length 22.1 mm
Weight 4.3 grams
Range 6.45 meters
Power supply 5 V
Output Analog
Figure 6: Maxsonar EZI sensor
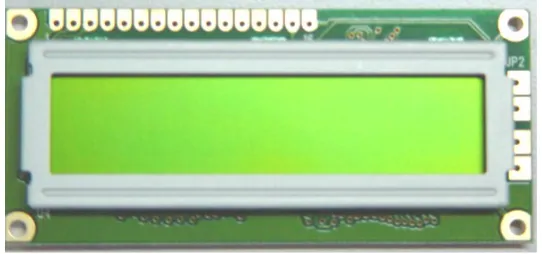
3.3.4 LCD Display
A (2X16) Liquid Crystal Display (LCD) is used to immediately display the reading from ultrasonic sensors. Two lines of the display space are suitable for the project since there two sensors reading. A total of 7 I/O pins of the PIC Microcontroller are used to communicate with the LCD. The specifications of the LCD display are given in the table below.
3.4 SOFTWARE CODE DEVELOPMENT
3.4.1 PIC Microcontroller Programming Flowchart
The PIC Microcontroller programming will be developed in C language and its flowchart is shown in the figure below. When the system is on, immediately the LCD will be initialized. The system then will take reading from ultrasonic sensor through analog pins of the PIC Microcontroller and convert them to digital. After that, the level of the liquid will be calculated and the result will be display on LCD as well as on personal computer.
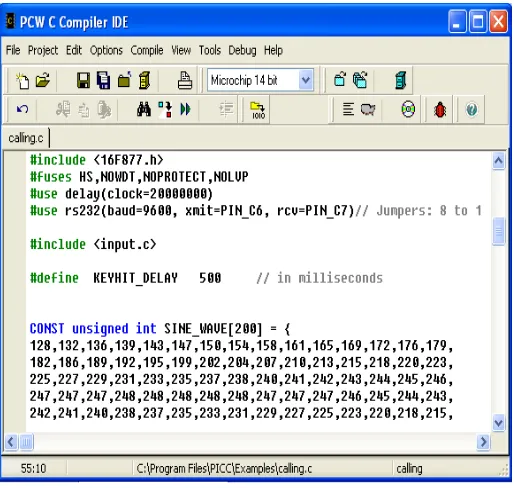
3.4.2 PCW C Compiler
PCW C compiler is a most effective software for design and write the programming code of the project in C++ language. After writing a vital code for the sensor then it is essential to compile this code as a .hex file and upload this file into the Microcontroller. Most benefits of this compiler is to provide higher level programming designer to solve their problem faster and more efficient.
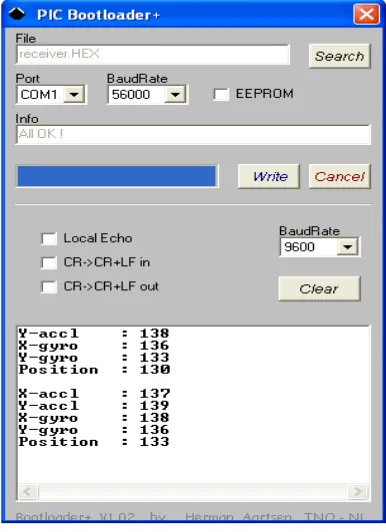
3.4.3 PIC Bootloader +
PIC Bootloader + has a specific role which is being used to download the .hex file of the source code into PIC Microcontroller. This software has a window to display the output of the code. The original of the Bootloader was made by Petr Kolomaznik (Czech Republic). PIC boot Plus is based on the Delphi sources (1.0.8.0 25.7.2001) provided by (C) 2000-2001 EHL elektronika. All enthusiasts developing PIC applications are free to use this software.
Table 2: LCD specification
Parameters Value
Display 16 characters x 2 lines
Operating temperature 0°C to 50°C
Operating voltage 4.5V - 5.5V
Backlight voltage 5.0V (100mA)
Module size 80mm x 36mm x 13.5mm
Viewing area 64.5mm x 14.5mm
Mounting hole (Diameter) 2.9mm
Figure 9: Programming flowchart.
Figure 11: PIC Bootloader+ interface.
4 RESULTS AND DISCUSSIONS
Firstly, there was a big challenge of using ultrasonic sensor to measure the level of liquid, because it was required to know the how many percent of signal is bounce back to sensor. The surface of the liquid is not suitable reflector of the transmitted signal. For that reason, a piece of polystyrene board (solid surface) is placed on the surface of the liquid as shown in the Figure 4. This will make the surface of liquid work as solid surface.
In system design part, it is shown how the level of the liquid in a tank is calculated. However, the value given does not present the real level of the liquid in centimeter (cm) unit rather than it shows the corresponding value to the voltage change. It is important to note that the value that comes from the analog port of microcontroller is always proportional to the distance of sensor from the liquid surface. After some experiments, we found that in order to get the liquid level in cm, the reading needs to be multiplied by 6.25 as below:
Liquid level = analog reading X 6.25 (3)
Furthermore, the MaxSonar-EZ1 ultrasonic Sensor has some limitations that need to be considered when use it. In Figure 6, we can see that objects are detected mostly in the central 36 degree zone. So that, the sensor must be put freely without any obstacle in this region to make sure that it gives the correct value. The obstacles can be the wall of the liquid tank or other sensor that put close together. In addition, it should be noted that the sensor is not effective for the range below approximately 30 cm to 40 cm. Any measurement below this range should be avoided.
5 CONCLUSIONS
The objective of this project is to design and implement an ultrasonic sensor based liquid level measurement system. However, due to the sensor limitation, the maximum allowable height of the tank is only up to 6 meters. But changing sensor type, range can be increased accordingly. This research showed:
1. The system is able to detect liquid surface (polystyrene) within the sensing range. 2. The system can calculate the liquid level with accepted accuracy.
3. The system can also communicate with PC through its serial port and a real time graphs is formed. 4. The system provides a lower cost and effective solution for noncontact type level measurements and
historical data storage.
circumstances and ambient conditions since it is a noncontact detection mode. So it does not get much influenced by ray, temperature, color etc. So that, despite drawbacks as discussed before, we find the main features of the device will be useful.
ACKNOWLEDGEMENT
The authors would like to thank International Islamic University Malaysia for supporting this research through research project titled “Development of An Integrated Water-Level Sensor and Data Logger System” (EDW B 0802-83).
REFERENCES
1. National Instrument (2010). Fundamentals of Ultrasonic Imaging and Flaw Detection, National Instrument. http://www.ni.com/white-paper/3368/en/
2. John, J. L. & Hugh, F. D-W (1992). Directed Sonar Sensing for Mobile Robot Navigation, Kluver Academic Publishers, Chapter 2.
3. Jaime, F., Julio, S. M. & Carlos, C. (1997). An Experiment Model for Sonar Sensors. Dept of Industrial Electronics, University of Minho, Guimardes, Portugal.
4. Maxbotix (2006). www.maxbotix.com, USA, 2006.
5. Satish, P., Dharmendra, M., Anchal, S., Atul, S., Shukla, R. K. (2008). Ultrasonic Obstruction Detection and Distance Measurement Using AVR Micro Controller, Department of Physics, University of Lucknow, Lucknow, India.
6. ITRC (1998). Liquid level sensors and data logger testing and demonstration, Irrigation Training and Research Centre, California Polytecnic State University, San Luis Obispo.
7. Zahirul, A. A.H.M., Lawal, W. A., Khan, S., Rashid, M. M. (2009). Design of multi-valued quaternary based analog-to-digital converter. American Journal of Applied Sciences, 6(8), 1521-1525.
8. A. H. M., Islam, Md. R., Khan, S., Rashid, M. M. (2009). Microelectrical mechanical systems switch for designing multi-band antenna” Journal of Computer Science, 5 (7), 479-486.
9. Jahirul, M. I., Saidur, R., Masjuki, H. H., Kalam, M.A., Rashid, M. M. (2009). Application of artificial neural networks (ANN) for prediction the performance of a dual fuel internal combustion engine. Transactions Hong Kong Institution of Engineers, 16(1), 14-20.
10.Ogbonnaya, O. C., Singh, D. & Ohakwe, J. (2011). Significant Predictors of Library Use by New International Students: The Case Study of University of Malaya, Kualla Lumpur. Malaysia Asian Journal of Applied Sciences, 4 (1), 53-62.