INTERNATIONAL JOURNAL OF INTEGRATED ENGINEERING VOL.11NO.5(2019)42-50
© Universiti Tun Hussein Onn Malaysia Publisher’s Office
IJIE
Journal homepage: http://penerbit.uthm.edu.my/ojs/index.php/ijie
The International
Journal of
Integrated
Engineering
ISSN : 2229-838X e-ISSN : 2600-7916
*Corresponding author: [email protected]
2019 UTHM Publisher. All rights reserved. penerbit.uthm.edu.my/ojs/index.php/ijie
42
Evaluation of Varied Model Order in GA-optimised Parameter
Estimation of Toothbrush Rig System
Ainul Husna Mohd Yusoff
1, Salihatun Md Salleh
1*, Shahruddin Mahzan
1,
Sufizar Ahmad
1, Hariati Taib
1, Hamimah Abd. Rahman
1, Azzura Ismail
1, Moch.
Agus Choiron
21Faculty of Mechanical and Manufacturing Engineering,
Universiti Tun Hussein Onn Malaysia (UTHM), 86400 Parit Raja, Batu Pahat, Johor, MALAYSIA
2Mechanical Engineering Department,
Universitas Brawijaya, 65145 Lowokwaru, Kota Malang, Jawa Timur, INDONESIA
*Corresponding Author
DOI: https://doi.org/10.30880/ijie.2019.11.05.006
Received 8 January 2019; Accepted 17 April 2019; Available online 10 August 2019
1. Introduction
Modeling is the step of translating a real process of the dynamic system to characterize its behavior. The modeling process is widely used in the engineering filed for better understanding the behavior of the system in improving the performance of the system by applying the control theory [1]. The model is a mathematical relationship between measured output data by loading an input signal on the system. The physical process that provides experimental data is referred as the process of the system [2]. The purpose of constructing a model for a system is to gain insights and knowledge about the system [3]. It is a vital task as the first step in scientific studies for any system analysis [4]. The constructing process of models from experimental data is called system identification [5-7]. The model chosen should represent the accurate behavior of the real system.
The steps involved in constructing a model are data acquisition, parameter estimation and validation. There are two conditions where the modelling of a model structure can occur known as white box model where all related information is provided and black box model where all parameters is fully unknown [8]. The data acquired from the experiment for the modelling is considered as a single input and single output data. There is a stage called model estimation where its
Abstract: Parameter estimation is a vital part in constructing the best model of a dynamic system. This paper
analyzed the performance of toothbrush rig parameter estimation using different model orders. Parameter estimation process of the system is performed through system identification. The approximate mathematical model that resembles the real system is obtained when the output is measured after loading the input signal. The application of real-coded genetic algorithm (RCGA) is proposed as optimization method in estimating the parameters of dynamic system. The best model is obtained by optimizing the objective function of mean squared errors. The performance is analyzed to get the approximate model of the real system using three different model orders with 10 times analysis for each model. A few criteria have been considered which are the optimization result of objective function, time execution and validation process. The estimated parameters are acceptable and possible to be used for controller development later on. Estimated parameter with model order 3 is chosen as the best model or the dynamic system as it has the highest performance compared to others.
purpose is to get the minimum error function between actual and predicted output. There are various approaches that can be adopted in model estimation process to get the accurate model such as prediction error method, instrumental variable, least square and maximum likelihood [9].
The parameter estimation is improved by applying real-coded genetic algorithm (RCGA) as an optimization technique. It is known as a global search technique because it evaluates many points that search the space and converge towards a satisfying solution [10-12]. It is also considered as a stochastic search algorithm where the solutions of a problem are represented by some codifications of the chromosomes [13]. Genetic algorithm with searching process-based adaptation concept imitates mechanisms of survival natural rules of population genetics [14]. Optimization technique of genetic algorithm is the adaptation of biological evolution process which is able to solve a complex problem [15]. It involves the evolution on the population by three operators: Reproduction, Crossover and Mutation [16-17].
The population is initialized first and then the fitness value of each individual will be calculated. The individual with high fitness value has a tendency to be paired for the crossover process. The new offspring going through the mutation process where the characteristic of the individual is altered which produces the new offspring. The new population for the next process is obtained by mutating the recombined offspring [18]. This process is repeated until the optimum solution is known. The optimization process will stop automatically when a given number of maximum generations is reached.
The conventional parameters of genetic algorithm such as maximum generation, crossover rate and mutation rate are setting up before the optimization process. Parameter settings must be adapted to the type of problem which is significant to the user’s definition [19]. The different model orders are analyzed in estimating the parameter of the model by real-coded genetic algorithm (RCGA). The validation process also involves constructing the accurate model for the system. Once the models are obtained, it is necessary to validate the models on some aspects [20-21]. The correlation analysis and percentage of model fitting can be applied in selecting the accurate model.
2. System Modelling
The model of the system studied in this paper is constructed by using system identification. It is a method that uses the measured data to develop the mathematical model of dynamics of the system which is being widely applied to various applications [22]. Modelling through system identification presents the physical process of a system in the form of mathematical expression. In this paper, the model represents the behavior of a real system in the form of transfer function.
There are a few procedures in modelling a system with identification based. The step starts from data extraction involving the other four steps; data extraction, selecting a model structure, estimating the parameter and model validation. Data extraction will be conducted directly from the toothbrush rig experiment. Another three steps will be conducted by adopting optimization method into these steps. The chosen optimization method to be integrated in the system identification is real-coded genetic algorithm (RCGA).
2.1 Experiment Structure
The plant model needs to be derived from the measured data from the system before the system identification can be applied. The input must be carefully designed prior to the experiment before being applied to a system to be identified. It is very important to obtain a good quality of data set with enough information about the system dynamics. The experiment conducted was a real-time experiment on a real system through simulation and the raw data obtained was saved automatically in the workspace. The host PC and Matlab with Simulink environment serves as the main control part to retrieve the data.
The input was applied with a specified sample time according to the number of data set acquired for the system identification. This paper obtained data set of real measurement from direct experiment on toothbrush experiment rig as shown in Fig. 1. It consists of toothbrush and tooth holder. The toothbrush holder is connected to the actuator that provides a repetitive motion of forward and backward which simulates the motion of brushing teeth. The toothbrush experiment rig is also called as plant which is interfaced with the host computer through simulation in Matlab software.
Toothbrush holder
Actuator
Yusoff, A. H. M. et al., Int. J. of Integrated Engineering Vol. 11 No. 5 (2019) p. 42-50
44
Fig. 1 – Toothbrush experimental rig.
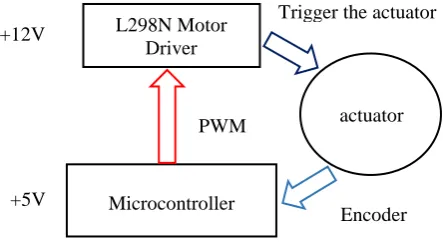
The PWM value of 255 was set up through the block in Simulink as the input for the actuator with sample time 20s. PWM value was connected to the PWM pin of microcontroller connected to the enable pin, and made the actuator operated. The voltage sensor was connected to the actuator to detect the voltage data which acted as an input. The output data which speed was measured by the encoder was attached to the actuator as in Fig. 2.
Fig. 2 – Toothbrush rig system structure.
2.2 ARX Model Structure
Model structure assembled the behavior of the dynamic of the system. The single input single output (SISO) of dynamic model was used for this modelling identification based. The chosen model structure for this study was autoregressive with exogenous input (ARX) model. Equation (1) shows the ARX model which can be defined as follows,
𝑦(𝑘) + 𝑎1𝑦(𝑘 − 1) + ⋯ . . +𝑎𝑛𝑦(𝑘 − 𝑛𝑎) = 𝑏1𝑢(𝑘 − 1)+. . . +𝑏1𝑛𝑏(𝑘 − 𝑛𝑘− 𝑛𝑏+ 1) + 𝑒(𝑡) (1)
The ARX model can also be written using the following notation:
𝐴(𝑧)𝑦(𝑘) = 𝐵(𝑧)𝑢(𝑘) + 𝑒(𝑡) (2)
where
𝐴(𝑧) = 1 + 𝑎1𝑧−1+. . . 𝑎𝑛𝑧−𝑛 (3)
𝐵(𝑧) = 1 + 𝑏1𝑧−1+. . . 𝑏𝑛𝑧−𝑛 (4)
𝑒(𝑡) is a white noise.
Equation (2) is also the polynomial model used to describe the system which is formed by the equations (3) and (4).
2.3 Real-Coded Genetic Algorithm (RCGA) Model
Some parameters needed to be estimated to obtain the accurate model of a system after the selection of model structure. It is an essential part to predict the performance of the system. Besides, estimating the parameter is required to describe the system behavior. Real-coded genetic algorithm (RCGA) is applied for estimating the parameter for the system. There are a few conventional parameters involved in searching process; number of individuals-NIND, maximum generation-MAXGEN, number of variation-NVAR and trial for each model order. All the values for each parameter were set up before starting the optimization process as presented in Table 1.
Table 1 – Conventional parameter value for optimization process
Conventional
parameter Value
NIND 100
MAXGEN 200
NVAR according to model order L298N Motor
Driver
Microcontroller
actuator PWM
Trigger the actuator
Encoder signal +12V
Trial for each
model order 10 times
All the selected values in Table 1 are the probabilities for the searching process. The values for the conventional parameters may affect the optimization performance. It also decides whether the information for the algorithm to converge to the best solution is enough or insufficient. The convergence may occur for a long time to the satisfying solution, but it may converge fast with less number, but the solution could be poor [6]. The method starts with creating the individual combination representing the parameter. The population created was based on the model order declared before starting the optimizing process. There were three different model orders used which are 2, 3 and 4. The analyzation has been done for ten (10) times for each model order.
There were three operators involved; selection (reproduction), crossover and mutation. For the selection process, every individual in the population was rearranged according to their fitness values. The fittest individual tends to be chosen rather than the less fit individual. The reproduction purpose is to reproduce more individuals with high fitness function. Some individuals were chosen as a parent to create new generation.
The crossover between parents was performed to create new offspring. Mutation was applied to avoid the search process from being stuck at local minima by altering one or more genes in a chromosome with a certain probability. The objective function taken was the mean squares of error (MSE) which needed to be optimized in estimating the parameter of the ARX model. The accurate parameters of the system can be estimated by minimizing the objective function as follow,
𝑀𝑆𝐸 =1
𝑁∑ (𝑦𝑖(𝑡) − 𝑦̂𝑖(𝑡)) 2 𝑁
𝑖=1 (5)
where
𝑦𝑖= value of actual output
𝑦̂𝑖= vale of predicted output
Equation (5) defines the objective function involved in the optimization process which is the error between actual and predicted output. As the objective function was optimized, the new generation was continuously created and evaluated until the accurate values of parameter was estimated. The algorithm terminated itself when the maximum generation was achieved. The model was validated through the correlation analysis and pole-zero map.
3.
Results and Discussion
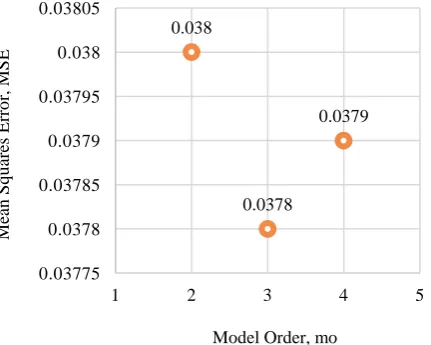
The performance of toothbrush rig parameter estimation was analyzed in real-coded genetic algorithm (RCGA) by using different model orders. The criteria taken in this study to analyze the performance of each model was the objective function value, time taken to the satisfying solution, the convergence graph to achieve the satisfying solution and validation result. Three different model orders have been analyzed for ten (10) times for each model order. One model was selected from ten models of each model order. The objective function value of each selected model is shown in Fig. 3.
Fig. 3 – Objective function value of selected model. 0.038
0.0378
0.0379
0.03775 0.0378 0.03785 0.0379 0.03795 0.038 0.03805
1 2 3 4 5
M
ea
n
S
q
u
are
s E
rro
r,
M
S
E
Yusoff, A. H. M. et al., Int. J. of Integrated Engineering Vol. 11 No. 5 (2019) p. 42-50
46
Model order 3 has the smallest objective function value, hence, indicating the best model for the objective function criterion. However, the objective function value was only one of the four criteria that needs to be considered. The smallest model order consists of simple equation, but it could be unreliable. So, there were other criteria that needed to be considered in selecting the best model. The selection step started with selecting the best model from ten models of each model order. The selection process has been done according to the criteria needed as stated in Table 2.
Table 2 – Selected model from different model order
PWM 255
Model Order 2 3 4
MSE 0.0380 0.0378 0.0379
Time Execution (s) 76.2742 80.9184 82.2749
Stab
ilit
y
Pole-zero map + + +
Valid
atio
n Auto-correlation + + +
Cross-correlation + + +
* cross (x) sign indicates the model is unstable
* plus (+) sign indicates the model pass the validation test
The result from Table 2 shows that the highest model order has the smallest MSE value. While that, the execution time has slightly increased when there was an increment of model order. Hence, to select the best model from the three models above, each model was evaluated by considering the criteria involved in selecting the accurate model. All the criteria were considered by using decision matrix method. The criteria were weighted according to the priority in selecting the best parameter of the model.
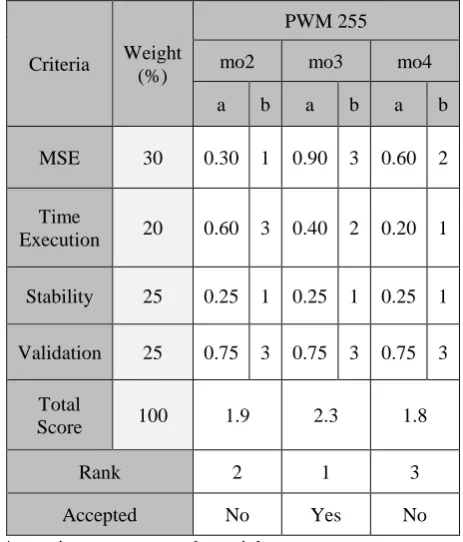
Each of the model was rated with 1 (lowest rating) to 3 (highest rating) for each criterion based on Table 2 above. The rating was then multiplied with the weight of each criterion to get the weight score. The weight score of each model was totaled up and ranked with 1 (best model) to 3 (poor model). The result of estimated model parameter is stated in Table 3.
Table 3 – Decision matrix of estimated model parameters
Criteria Weight (%)
PWM 255
mo2 mo3 mo4
a b a b a b
MSE 30 0.30 1 0.90 3 0.60 2
Time
Execution 20 0.60 3 0.40 2 0.20 1
Stability 25 0.25 1 0.25 1 0.25 1
Validation 25 0.75 3 0.75 3 0.75 3
Total
Score 100 1.9 2.3 1.8
Rank 2 1 3
Accepted No Yes No
* notation b represents the rating
From Table 3, the best model with the accurate parameter has been selected. The best model selected was the model with model order 3, where it has the objective function value of 0.03780. The time execution to converge to a satisfying solution was 80.9184s. The identified parameter for the system is stated in Table 4.
Table 4 – Estimated parameter from real-coded genetic algorithm (RCGA) optimization method
Model order
a
a0 a1 a2
3
-0.0391 -0.0541 -0.0510
b
b0 b1 b2
-0.2813 -0.2075 -0.2172
Therefore, from Table 4, the selected model transfer function in the form of ARX equation is written as,
𝑡𝑓 =
−0.2813𝑧2−0.2075𝑧−0.2172𝑧3−0.0391𝑧2−0.0541𝑧−0.0510
(6)
Equation (6) is the transfer function which represents the best model that has been selected for the system. The time execution was related to the converging process to the optimal solution. The process of reproducing, crossover and mutation was repeated until the objective function was minimized. The algorithm was on-going with the same iteration and terminated itself when the maximum generation was achieved.
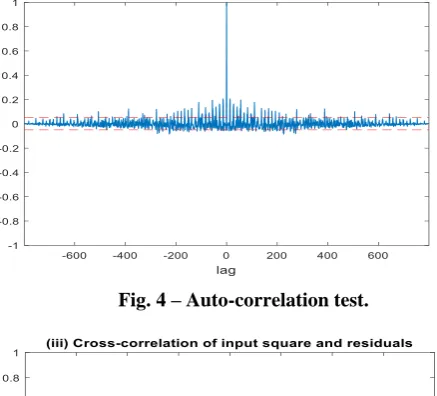
The convergence of real-coded genetic algorithm (RCGA) of the identified parameter was achieved before the 150 generation from the 200-generation done. The identified parameter of ARX model has been validated by correlation analysis. The correlation analysis consisted of two types which are auto-correlation and cross-correlation. The validation test results are shown in Fig. 4, 5, 6 and 7.
Fig. 4 – Auto-correlation test.
Fig. 6 – Cross-correlation test of input square and residuals.
Yusoff, A. H. M. et al., Int. J. of Integrated Engineering Vol. 11 No. 5 (2019) p. 42-50
48
Fig. 7 – Cross-correlation test of input square and residuals square.
Auto-correlation is a correlated signal with a sharp spike at the center. The signal was correlated by correlating two error signals. Correlated signal of cross-correlation was formed by correlating error signal and normalized input signal. All correlation analyses were accepted as most of them lied between the confident line. As a result, the identified parameter has passed the validation test.
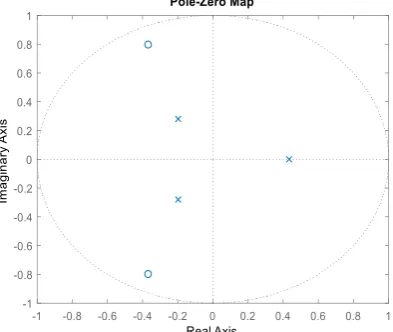
The stability of the model can be examined from the transfer function. It can be referred to pole-zero map as it was constructed from the transfer function. The zero is stated as circle (ο) and pole is stated as cross (x). The circle region is the stable region while the outside area of the circle line is the unstable region. The pole-zero map of the best model is shown in Fig. 8.
Fig. 8 – Pole-zero map of estimated parameter.
Based on Fig. 8, all poles lie inside the circle line considered as the stable region. A stable system should have all the poles lying inside the circle region. Hence, the identified parameter has all poles lying inside the circle line that makes the system to be in a stable condition.
Conclusion
This study applied real-coded genetic algorithm (RCGA) in estimating the accurate parameters to model the dynamics of the system. The real-coded genetic algorithm (RCGA) was used to optimize the objective function to achieve the optimal solution. The optimization process has been done for three different model order values. Hence, the accurate model was identified from the performance analysis through the decision matrix process. All the results obtained were evaluated in terms of objective function value, time execution, and stability and correlation analysis. The estimated parameter of model order 3 has been chosen as the best model as it has the highest score from the evaluation of all criteria needed in determining the accurate model.
Acknowledgement
The authors would like to show their gratitude to Universiti Tun Hussein Onn Malaysia (UTHM) in providing the financial support from fundamental research grant FRGS no. 1541.
[1] Adewusi S. (2016). Modeling and Parameter Identification of a DC Motor Using Constraint Optimization Technique. IOSR Journal of Mechanical and Civil Engineering (IOSR-JMCE), 13, 45-56.
[2] Lankarany M., and Rezazade A. (2007). Parameter estimation optimization based on genetic algorithm applied to DC motor. Electrical Engineering, 1-6.
[3] Othman K. A., Kamal M. M. and Hamzah N. (2009). System identification of discrete model for DC motor positioning. Proceedings of the 8th WSEAS International Conference on Circuits, systems, electronics, control & signal processing, Malaysia, 212-216.
[4] Shahraki M., Sh M. A., and Mousavinia A. (2017). Two-wheel self-balanced mobile robot identification based on experimental data. Electrical Engineering (ICEE), Iran, 883-888.
[5] Bhuvaneswari N. S., Praveena R., and Divya R. (2012). System identification and modelling for interacting and non-interacting tank systems using intelligent techniques. International Journal of Information Sciences and Techniques (IJIST), 2012 India, 02, 23-37.
[6] Kristinsson K. and Dumont G. A. (1992). System identification and control using genetic algorithms. IEEE Transactions on Systems, Man, and Cybernetics, 22, 1033-1046.
[7] Zakaria M. Z., Mansor Z., Noor A. M., Saad M.S., Baharudin M. E. and Ahmad R. (2018). NARMAX Model Identification Using Multi-Objective Optimization Differential Evolution. International Journal of Integrated Engineering, Malaysia, 10, 188-203.
[8] Lazin M. N. M., Darus I. Z. M., Boon C. N., and Kamar H. M. (2013). Genetic algorithm identification for automotive air-conditioning system. Computers & Informatics (ISCI), Malaysia, 18-24.
[9] Rabbani M. J., Hussain K., Khan A., and Ali A. (2013). Model Identification and Validation for a Heating System Using MATLAB System Identification Toolbox. IOP Conference Series: Materials Science and Engineering Proceedings of the 1st International Conference on Sensing for Industry, Control, Communications, and Security Technologies, Pakistan,51, 1-10. [10] Andrijic Z. U., Bolf N. and Rolich T. (2011). Optimizing configurable parameters of model structure using genetic algorithms.
TEDI-International Interdisciplinary Journal of Young Scientists from the Faculty of Textile Technology, 1, 49-54.
[11] Angelova M. and Pencheva T. (2011). Tuning Genetic Algorithm Parameters to Improve Convergence Time. International Journal of Chemical Engineering.
[12] Ibrahim B. S. K. K., Tokhi M. O., Huq M. S. and Gharooni S. C. (2011). Optimized Fuzzy Control for Natural Trajectory Based Fes-Swinging Motion. International Journal of Integrated Engineering, Malaysia, 3, 17-23.
[13] Barrero D. F., Gonzalez-Pardo A., Cmacho D. and Maria D. (2010). Distributed Parameter Tuning for Genetic Algortihms. Computer Science and Information Systems, 15, 661-677.
[14] Ayad A. R., Awad H. A. and Yassin A. A. (2013). Parametric analysis for genetic algorithms handling parameters. Alexandria Engineering Journal, 52, 99-111.
[15] Meilia V., Setiawan B. D. and Santosa N. (2018). Extreme Learning Machine Weights Optimization Using Genetic Algorithm in Electrical Load Forecasting. Journal of Information Technology and Computer Science, 3, 77-87.
[16] Wei-Der C. (2017). Nonlinear system identification and control using a real-coded genetic algorithm. Applied Mathematical Modelling, 31, 541-550.
[17] Whorton M. S.Closed-loop system identification with genetic algorithms. (2018). Journal of Aerospace Computing, Information, and Communication, 5, 161-173.
[18] Jafferi N. and Tokhi M. O. (2009). Multi-Objective Genetic Algorithm Optimisation Approach for The Geometrical Design of an Active Noise Control Systems. Internationa Journal of Integrated Engineering, Malaysia, 1, 73-86.
[19] Pellerin E., Pigeon L. and Delisle S. (2004). Self-adaptive Parameters in Genetic Algorithms. In Data Mining and Knowledge Discovery: Theory, Tools and Technology VI, 5433, 53-65.
[20] Muroi H. and Adachi S. (2015). Model validation criteria for system identification in time domain. IFAC-PapersOnLine, Japan, 48, 86-91.
[21] Md Zain B.A., Tokhi M.O., Md Salleh S.M. (2009). Dynamic modelling of a single-link flexible manipulator using parametric techniques with genetic algorithms. EMS 2009 - UKSim 3rd European Modelling Symposium on Computer Modelling and Simulation. 5358761, 373-378.