Published online April 2, 2013 (http://www.sciencepublishinggroup.com/j/ijmea) doi: 10.11648/j.ijmea.20130101.12
Induced airflow around the calendering drums
Karel Adámek, Jan Kolář
VÚTS, a.s., Svárovská 619, CZ-46001 Liberec
Email address:
[email protected] (K.Adámek), [email protected] (J. Kolář)
To cite this article:
Karel Adámek, Jan Kolář. Induced Airflow Around the Calendering Drums. International Journal of Mechanical Engineering and Applications, Vol. 1, No. 1, 2013, pp. 10-16. doi: 10.11648/j.ijmea.20130101.12
Abstract:
The article presents the flow field arising by the rotation of the calendering drums in the undisturbed surroundings. Thereby, the methods of numerical flow simulation were used here.Keywords:
Calendering; Induced Airflow; Numerical Flow Simulation1. Introduction
The contribution describes the flows arising by the rotation of the calendering drums in the unmoved surroundings. It is practically impossible to measure some characteristics of such flow field, above all in the contact area of a pair of rotating calendering drums with inserted treated layer. Therefore, the methods of numerical flow simulations were used for the detailed description of the flow field; first,those of all of the components of the velocity vector, and further,those of the both static and dynamic pressure etc. The presented results include both the global models of rotating drums and the detailed models of flows in small gaps among the elementary protrusions on the drum rotating surface.
2. Global Model
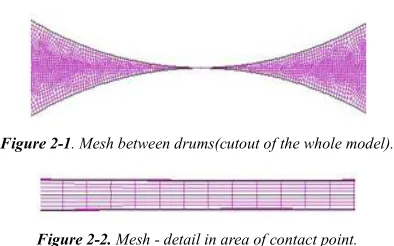
It is well known, see [1], [2], [3], [4], [5] etc.,that a surface, rotating in the unmoved surroundings, creates a complicated flow field, due to viscous forces. Some air layer is moving together with rotating surfaces and creates an uneven pressure field in the vicinity of the contact point of both drums. This layer is created along the whole drum periphery, which must be modeled entire and as moving wall. The cutout see the Fig. 2-1.
In addition, here is presented the influence of the very airy permeable textile layer which transports an indispensable flow volume through the contact area between both drums. Using standard commercial code [6], the modeled area must be divided by interfaces between moving textile layer and surrounding. And more, in the middle of the textile layer thickness of 0,2 mm approx., see the Fig. 2-2, is defined porous jump of permeability parameters evaluated from
measuring, for instance [7] etc.
Figure 2-1. Mesh between drums(cutout of the whole model).
Figure 2-2. Mesh - detail in area of contact point.
In the area of contact point the size of mesh elements should go to zero, see for instance [8]. Instead of it, between both drums is modeled here the very narrow gap of 0,2 mm, corresponding to the real textile layer thickness.Then there is the narrow connection between areas before and after the contact point, see the Fig. 2-1 and detail in the Fig. 2-2. Therefore remains some small mutual influence of both areas, decreasing a little the observed peaks of pressure (see the Fig. 2-9 below).
The defined drums peripheral velocity of 15 m/s is identical with the transport velocity of the very airy textile layer. Due to the very small gaps among the elementary protrusions on the drum surface, the mesh must be very fine. But due to the limited capacity of the working memory, it is not possible to model the whole periphery of drums with all elementary protrusions, like after the Par. 3. Instead, some global roughness is defined, only, and the simple two-dimensional model is used.
protrusions.
Used standard turbulence model k-ε, both steady and
unsteady solution, in two dimensions, double precision. The results of all solved cases are very similar; therefore, due to place saving, only one typical case is presented here. For the same geometry and mesh of the two-dimensional model, three different boundary conditions were used as follows:
- rotating drums with the incoming textile layer - furthermore, the drums are heated
- furthermore, the treated layer permeability is defined. To get more readable small graphs, the axis assignments on graphs were cut off and relevant assignments are explained just in the description of relevant graph.
Fig. 2-3 shows the streamlines of the induced flow around the rotating drums. Different colors present the origin of streamlines, for instance yellow = movement of the upper drum, red = movement of the lower drum, both with backflow from the (left) inlet wedge into the left surroundings, blue/green = air flows in surroundings, etc.
Figure 2-3. Streamlines.
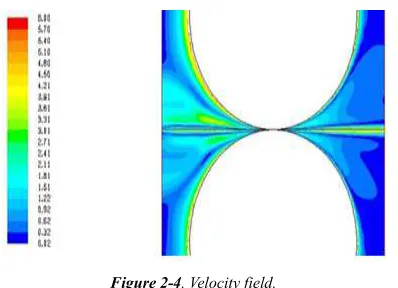
Fig. 2-4 presents the corresponding velocity isolines. On the inlet side (here from the left), there are visible two boundary flows moving together with both surfaces of the rotating drums and colliding in the inlet wedge between the drums, further the horizontal movement of a very airy treated textile layer (from left) and strong backflow after the collision from the inlet wedge (to the left). Due to air inflow in the inlet wedge, there arises some overpressure (see the Fig. 2-7 below).
Figure 2-4. Velocity field.
On the outlet side (on the right), there is visible the textile
layer movement, too, further the newly formed boundary layers of the drums along both rotating surfaces after their contact point and some air suction from the surroundings into the underpressure area at the outlet wedge, arising due to the previous flows, moving together with the rotating surfaces.
The mixing effect of both flows is well visible in the temperature field when the drums are heated 100 K over the surrounding temperature. Fig. 2-5 shows that the area of the increased temperature in the inlet wedge is “flowing” back to the left and is partially disturbed by cold flows around the rotating drums and by thecold arriving treated layer, too. In the outlet wedge, there arises a large area of increased temperature, too. At first the treated textile layer is warmed, too, and secondly the hot area is extended by the side effects of both rotating drums. Further the temperature decreases due to the suction of the cold air from the surroundings into the area of under pressure.
Figure 2-5. Temperature field between the drums.
Detail of the velocity field in the area of contact point shows the Fig. 2-6. In very narrow strip of 0,2 mm thickness the velocity remains practically constant, equal to the peripheral velocity of 15 m/s, identical with the movement of very airy textile layer; the discussed model contains the transported textile layer defined as an air layer of a transporting velocity of the same value of 15 m/s. Such simplification is acceptable because the inserted layer is very “airy”; the volume of the moving layer contains 20% of textile fibers, only and 80% of air.
Figure 2-6. Velocity field in area of contact point.
Above and below of this treated layer, in both inlet and outlet wedges, the velocity values are reduced. The airflows, moving together with rotating surfaces, are braked on the inlet side (here left) and sucked in on the outlet side (here right), due to “zero” gap in the contact point.
Figure 2-7.Pressure field in area of contact point.
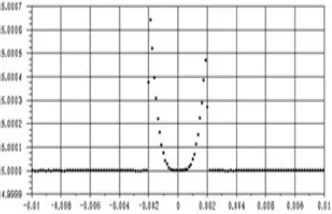
Another view is presented on profiles along horizontal line between drums. The velocity profile after Fig. 2-8 remains practically constant, equal to the peripheral velocity of 15 m/s. Two small peaks near the contact point are negligible numerical errors, only, given by changes of small mesh elements and of boundary condition.
Figure 2-8. Velocity profile between the drums (0 = contact point).
The velocity profile in the Fig. 2-9 is much more interesting. Before the contact point, the pressure is strongly increasing in the correspondence with the air compression in the inlet wedge, then it falls rapidly down in the underpressure due to air suction by the rotating drums from the surroundings and finally the pressure increases again to the value of atmospheric pressure.
Figure 2-9. Pressureprofile between the drums (0 = contact point).
It is very probably that such expressive pressure gradients could amplify the detailed effects of the flowfield, described below in the Par. 3. But at the same time it is necessary to remind that the used model contains narrow gap between two drums, which are really in contact. Therefore it is possible to expect that the real pressure values will be higher than in this simulation.
As a partial conclusion of the presented planar numerical simulations, we can state that in the contact area of the rotating drums, there arise not only mechanical pressing forces but also an increased aerodynamic influence.
3. Detailed Model
The both real “roughness” of the rotating drumsand the air viscosity induce the local velocity field which interacts with
the global flow described in the Par. 2. For the simulation of such a complex flow field, it is necessary to prepare and solve a complex three-dimensional model, but its scope is very large.
Here, there are presented the main results of one case of numerical simulation of a detailed flow field among the elementary protrusions, created on the rotating (moving) drum surface. They are the results of interaction between the immovable surroundings and small protrusions, fixed on the moving drum surface of a large diameter as to Fig. 3-1.
Figure 3-1. Typical pattern of the contact protrusions (mesh, colored by dynamic pressure values).
The elementary protrusions, situated on the rotating surface, interact with the air in the surroundings above all through the pressure and viscose forces. The relation of both force components is presented in Fig. 3-2, where it is displayed the force around any individual small cylinder. It is clear that both components should be taken into account.
Figure 3-2. Forces rate on the cylindrical body in cross flow.
The procedure of moving wall gives the flow field of air movement, arising by the rotation of the drum surface. The typical flow field is shown in Fig. 3-3 to Fig. 3-5 as the velocity components in the contact plane, defined here on the tips of the elementary protrusions. Of course, in a shorter distance from the drum surface, the velocity increases to the constant surface value of 15 m/s and becomes a more uniform character in general. The direction of rotation is here (+y).
smaller due to the flow resistance.
Figure 3-3. Main velocity component (wy=peripheral), contact plane.
Fig. 3-4 shows a cross (axial) flow, where wx direction alternates to left and right and Fig. 3-5 shows the radial flow, where wz alternates up and down, both according to the flow around the protrusions. Values of both cross components are of lower order than the main peripheral component. The dynamic pressure of those cross components can have a certain influence on the treated textile layer, i.e. on elementary fibers in the layer respectively, passing through the contact area between the drums.
Figure 3-4. Cross velocity component (wx=axial, contact plane.
Figure 3-5. Radial velocity component wz upright to the contact plane.
The possible mixing movements in the flow field are shown for instance in the serial of Fig. 3-6 to Fig. 3-8 with radial velocity in several cross sections in several radial planes x-z (across to the direction of the rotation, signed after Fig. 3-3 to Fig. 3-5 as “upper (row) – between – lower (shifted row)”. Without any next analysis, it is visible air movement in these radial planes – the details are depending on the actual position (y) of the plane of observation (y-z). In
general, there are observable some small areas of vortex movements up and down, acting up to a certain height above the outlines of protrusions.
Figure 3-6. Radial velocity component wz - cross section “upper”.
Figure 3-7. Radial velocity component wz - cross section “between”.
Figure 3-8. Radial velocity component wz - cross section “lower”.
4. Unsteady Solution
It is evident that the main influence on the treated textile layer is created by the flow field (by its velocity and pressure) in the contact area of the drums. The structure of the treated layer is here changed by aerodynamic flows and forces and then fixed by warming and pressing.
For the completion of the solution, there are presented some results of an unsteady solution, too, suitably completing the above mentioned results. The velocity field around the rotating drums is creating gradually around the whole periphery of the rotating drums, so it should be solved the whole area, not only the most interesting sector in the vicinity of a contact point, where the influence of the rotating surfaces is at maximum.
In the simplified substitutive planar model, the drums rotation of 15 m/s remains the same, with an angular velocity of 100 rad/s. To catch the influence of individual protrusion, on the surface of one drumis modeled only one protrusion. The time step of 1 ms was used, the corresponding angular rotation of 5, 73°/ time step, respectively 62, 83 steps/rev.
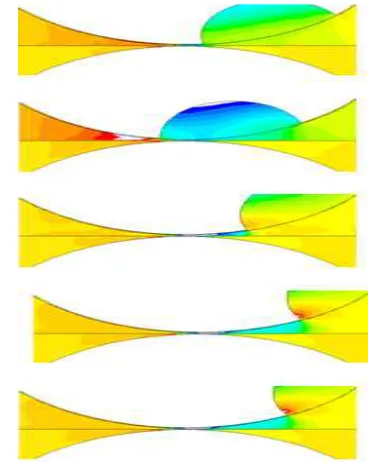
From the recorded global flow field follows that the pressure and velocity fields around both drums are identical with the above mentioned static results. The record in the format mpeg is not printable, so they are presented here some static results of the pressure field, only, in several time moments with a time step of 2 ms, see the set of detailed pressure fields in Fig. 4-1 to Fig. 4-10, focused on the contact area, where the same pressure scale from -150 to +60 Pa is used (prospective areas outside this range are not filled). In the contact area, there are visible locally limited, but strong pressure changes, similar to the previous Par. 2.
Figure 4-1 to 4-5. Pressure field in time steps of 0-2-4-6-8 ms (to be continued in the right column).
Figure 4-6 to 4-10. Pressure field in time steps of 10-12-14-16-18 ms.
The most expressive pressure change begins during the passage of the protrusion through the contact area, at the beginning as a short-time pressure increasing at the inlet side and as the short-time pressure decreasing at the end at the outlet side. An analogous situation is possible to expect during the rotation of a real gravure, but the effect will be of higher frequency, corresponding with the gravure pitch.
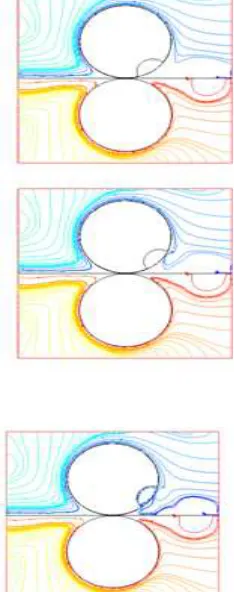
The following set of Fig. 4-11 to Fig. 4-20 presents streamlines in the same time moments from 0 to 18 ms. In the upper part of the model, there are displayed blue and green streamlines, carried away from the upper surroundings by the upper (protruded) rotating surface. In the lower part of the model, there are red and yellow streamlines, carried away by the lower (smooth) rotating surface from the lower surroundings. The time course is identical with the static results described above in Par. 2. In the inlet wedge (left), there is a permanent overpressure, causing by the supply of the air layers moving together with the rotating drums. After streamlines collision, they are flowing away in the horizontal direction, against to the inlet of the treated textile layer. In the outlet wedge, the two air layers, moving together with the rotating surfaces, create some underpressurethere, which draws some air volume from the surroundings into the outlet wedge.
down. At the outlet side, there it is a stronger suction into the upper side.
Figure 4-11 to 4-15. Streamlines in time steps of 0-2-4-6-8 ms.
Figure 4-16 to 4-20. Streamlines in time steps of 10-12-14-16-18 ms.
5. Another Application
The described force influence of viscous flow, moving together with the rotating surface, is observable in other devices, too. For instance in a feeding system, consisting from two rotating cylinders in contact, one of them made as grooved metallic, the second as smooth rubber.
The significant air flow around a grooved feeding cylinderisimpressed in the so-called inlet wedgebetween the rotating cylinders just before the contact point. Further,this effect makes some troubles in the used technology, because the incoming air is flowing out from this wedge in an unsuitable axial direction along cylinders surfaces.
Fig. 5-1 shows the suppressing of such effect. Streamlines are moving along the rotating surface in the direction of rotation (here from down). Using a simple “knife” just before the contact area (here in the horizontal plane), the air flow, rotating together with cylinder surface,is declined away from the rotating surface (here to the right) and the operating area just above the “knife” is clear, without disturbing air flow.Only few persisting streamlines from the surroundings are observable here.
Figure 5-1. Deflective effect of knife – streamlines.
6. Permeability Evaluation
The permeability of the observed fibrous layer is given by its flow resistance. After [9] etc. this resistance consists from linear term, typical for instance for soaking at small velocities (so-called Darcy’s law) and from quadratic term, typical for flows around bodies or through channels (Weissbach’s or Moody’s law)
∆p = C2 . ρ/2 . tl . w2 + µ / α . tl . w (1)
where
w = V/S (m/s) flow velocity V (m3/s) volume flow S (m2) flow cross section tl (m) layer thickness ρ (kg/m3) medium density
µ (m2/s) viscosity (for air 1,375e-5) α, C2 permeability parameters for[6].
structure usually exists some combination of both above mentioned limiting cases (linear, only or quadratic, only).
From the measured characteristics V = f (∆p), see [7] etc.
it is necessary to create an inverse characteristic ∆p = f (V) to
get the equation formally corresponding with the above mentioned formula ∆p = f (w, w2). Inthe Fig. 6-1, there is
presented the resulting function (as an example), together with simple correlation with quadratic function. The achieved correlation coefficient is very high (R2 = 0,997) so that by comparing the coefficients of linear and quadratic terms with the above mentioned formula (1) for pressure resistance it is possible to determine two unknown permeability parameters α and C2 of the measured permeable
layer. The mentioned absolute term (here 146,6) represents the absolute error of the used substitution. But for the observed case it is negligible.
Figure 6-1. Evaluated permeability (as an example).
7. Conclusions
The article presents some results of numerical flow simulations around two rotating drums in contact, one of them furnished by small protrusions. Results are valid generally, here focused in the branch of textile technology.
Along rotating and eventually profiled surfaces arisecomplicated flow fields whose dynamic pressure could have some influences (force impact) on the processed light fibrous material.And more, the detailed influences could be amplified by the global influence of overpressure on the inlet side between two jointly rotating drums.
Of course, a complex three-dimensional model could give a better image about the flow field, in comparison with the presented simple planar (2D) model, but the mesh of very fine (small) protrusions fixed on the large drum diameter must be very fine, too, and for such a complex model the actual working memory is not sufficient.
The solution in three dimensions was used for detailed survey of the flow filed in the vicinity of small protrusions on the surface of the drum.
Last but not least, the contact area ofrotating drums, together with moving fibrous layer between them, is not accessible for any measuring sensors; that is why, the method of numerical flow simulation is the sole possibility for the description of the flow field arising by the rotation of such two drums.
Specific application of presented effects of the flow field on the treated fibrous layer is the object of the producer’s know-how; that is why, some more details is not possible to publish now.
References
[1] K. Adámek, J. Kolář, “Influence of the induced airflow on calendering”, in Proc. of the Experimental Fluid Mechanics 2011 (EFM11), Tech. Univ. in Liberec, Czech Rep., Jičín, November 2011,pp. 45-52
[2] K. Adámek, “Einfluss der induzierten Luftströmung beim Kalandrieren, in Proc. of the 13. Chemnitzer Textiltechnik Tagung, Tech. Univ. in Chemnitz, Germany, March 2012, 8 pages
[3] K. Adámek and J. Kolář, “Numerical flow simulations used in industrial problems”, in Proc. of the ECCOMAS 2012, Tech. Univ. in Vienna, Austria, Vienna, September 2012, 14 pages
[4] J. Pelant and K. Adámek, “Air flow around moving surface”, in Proc. of ECCOMAS In, University of Jyväskyla, Finland, Jyväskyla, July 2004, 20 pages
[5] J. Pelant, K. Adámek and M. Kyncl, ”Application of the 3D Navier-Stokes equations for Axis-symmetrical Viscous Turbulent Flow, in: Proc. of the 6th ICCSM, Tech. Univ. in Zagreb, Croatia, Dubrovnik, October 2009, 8 pages
[6] Fluent v. 6.3.26
[7] K. Adámek, “Prodyšnost textilních vrstev” (Air permeability of textile layers), in Proc. of the XVI. int. sci. conf. Application of Exp. and Numer. Methods in the Fluid Mechanics, University of Žilina, Slovakia, April 2008, 6 pages
[8] J. Kolář and K. Adámek: “Optimization of damping unit”, in OPTI 2012, Wessex Inst. of Technol., New Forest, UK, presented at Fluid Structure Interaction IV, Univ. of Central Florida, Orlando, USA, May 2011, 6 pages