http://www.sciencepublishinggroup.com/j/acis doi: 10.11648/j.acis.20180604.12
ISSN: 2328-5583 (Print); ISSN: 2328-5591 (Online)
3D Face Feature Location Method Based on Stripes and
Shape Index
Li Chang
*, Shuai Liu
School of Information Science and Engineering, Shenyang University of Technology, Shenyang, China
Email address:
*Corresponding author
To cite this article:
Li Chang, Shuai Liu. 3D Face Feature Location Method Based on Stripes and Shape Index. Automation, Control and Intelligent Systems. Vol. 6, No. 4, 2018, pp. 47-53. doi: 10.11648/j.acis.20180604.12
Received: November 5, 2018; Accepted: December 22, 2018; Published: December 27, 2018
Abstract:
A 3D face feature location method based on stripes and shape index is proposed in order to locate the feature points in face exactly and quickly. The grating projection technique is used to obtain 3D face image. Based on the difference between the background fringe image and the deformed fringe image, the basic information of the human face in the image is determined. The basic information includes left and right edge lines, upper and lower edge coordinates and the width of the human face in the image. And then, the approximate position of the ear is quickly determined according to the left or right edge line. The found areas of the tip of the nose and the inner canthus are reduced according to the position of the ear. The position of the tip of the nose and the inner canthus are determined according to the height and shape index information. The experiment was conducted in a dark environment, with an average total time of 4.05 seconds and an average time of positioning of 1.07 seconds. When the allowable error is 15 pixels, the positioning accuracy is 85.34% for different poses, and the positioning accuracy is 96.88% when the face rotation angle is less than 20 degrees.Keywords:
3D Face Localization, Grating Projection, Feature Points, Gaussian Curvature, Mean Curvature, Shape Index1. Introduction
Face positioning method is mainly divided into two parts: face location method based on two-dimensional image and face location method based on 3D image [1-3]. Positioning methods based on 3D face images are based on the height and concavity of the face. Therefore, it has some advantages over the method of locating based on two-dimensional face images. For example, it is less influenced by light changes, face pose changes and skin color changes [4, 5]. However, the apparatus for acquiring 3D images is complicated. Since 3D images contain more information, the calculation amount is larger and the processing time is longer.
The 3D face positioning methods include template matching, statistical feature position, relative height and curvature methods and so on. The curvature is more commonly used. When dealing with real 3D face images, the biggest problems by using surface fitting to calculate the curvature of each point in the image is slow operation speed caused by the large data amount. Dorai proposed the Shape
Index feature based on Gaussian curvature and mean curvature, which can represent the bump degree at each point on the surface, the position of nose tip and eye angle is determined by judging the shape index of each point in 3D face image.
A 3D face feature location method based on stripes and shape index is proposed in this paper. The method uses grating projection to obtain 3D face image. Before performing 3D face location, the search area is quickly determined based on the difference between the background stripe image and the deformed stripe image acquired by the raster projection method. This method reduces the time for 3D face positioning and makes the positioning result more accurate by determining the search area in advance.
2. The Overall Process of the Method
The overall process of the 3D face location method based on the stripe and shape index proposed in this paper is as follows:
background stripe images, and four deformed stripe images are collected. The effective part with stripes is cropped out according to the background image and the background stripe image. After the cutting is completed, a 3D topography measurement technique based on a grating projection method is used to acquire a 3D face image.
Secondly, the position of the human face in the image and the basic information of the human face in the image are determined by the difference between the deformed fringe image and the background fringe image. The basic information of the face includes the left edge line, the right edge line, the upper edge coordinates, the lower edge coordinates, and the width of the human face in the image. The position of the ear is determined based on the trend of the left edge curve (or the right edge curve) and the width of the face. Finally, the search area of the tip of the nose is determined according to the ear position and the position of the tip of the nose is determined based on the height and shape index information. After the position of the tip of the nose is determined, the search area of the left and right inner canthus is determined based on the position of the tip of the nose. The position of the inner canthus is determined based on the height and shape index information.
3. 3D Shape Reconstruction
The grating projection method is a 3D topography based on structured light. It is a relatively mature method for measuring the 3D appearance of an object, and it has applications in the fields of topography measurement, industrial inspection, machine vision and etc. This method has the advantages of high measurement accuracy, wide measurement range and relatively simple realization [6-8]. Therefore, the grating projection technique is used in this paper to obtain 3D face image. This 3D face image will be used for face location.
To obtain a 3D face image using a raster projection method, the 4-step phase-shifted grating fringe images need to be respectively projected onto the human face and obtained by a camera. The four deformed grating fringe images acquired are shown in figure 1.
Figure 1. Deformed fringe images.
The phase measurement profilometry (PMP) is used to obtain the wrapped phase according to the four background stripe images and the four deformation stripe images acquired by camera. The calculation formula of the wrapped phase is shown in (1):
( )
( )
( )
3
1 0
3
0
2 , sin
4
, tan
2
, cos
4 i
i
i i
I x y i
x y
I x y i
π ϕ
π
− =
=
×
=
×
∑
∑
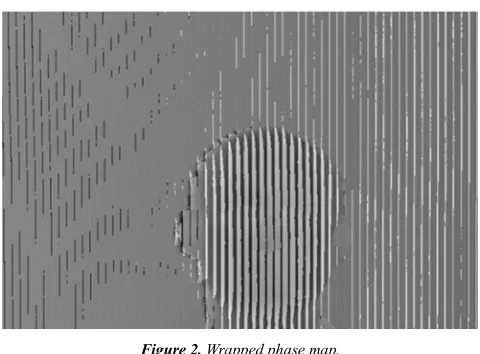
(1)Where x and y are the abscissa and ordinate of the image respectively, Ii (x, y) is the phase value of the ith image, φ(x, y)
is the wrapped phase of the range (-π, π). The wrapped phase map is shown in figure 2.
Figure 2. Wrapped phase map.
Solving the solution of the adjacent phase difference of wrapped phase and the adjacent phase difference of unwrapped phase under the least square method, the unwrapped phase value is obtained by (2) [9, 10]:
(
)
(
)
M 2 N 1 2
1, , ,
0 0
M 1 N 2 2
, 1 , ,
0 0
min i j i j i jx
i j
y i j i j i j i j
P
− − + = = − −
+ = =
= Φ − Φ − ∆
+ Φ − Φ − ∆
∑ ∑
∑ ∑
(2)
Where min{ } is the minimum operation, M and N are the number of rows and columns of the image respectively, Φi+1, j -
Φi, j is the lateral difference of the unwrapped phase, Φi, j+1- Φi, j is the longitudinal difference of the unwrapped phase, ∆xi,j
and ∆yi,j are the wrapped phase differences in horizontal and
vertical axes, respectively.
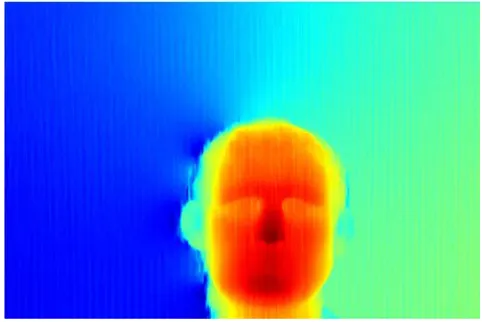
calculation of the curvature afterwards. The inaccuracy of the curvature calculation will directly affect the accuracy of the positioning of the tip of the nose and inner canthus, so these problems need to be solved.
Figure 3. Original 3D face image.
Since the problems did not affect the overall trend of the image, the method of curve fitting is used to repair the 3D image. If the length of a single fit curve is too long, the intrinsic roughness of the face will be smoothed. If the length of the fitting curve is too short, smooth unevenness will still appear and it will take longer. After experimental verification, the single-fit curve length taken in this paper is 1/6 of the width of the human face in the image. The quarto curve will be used for curve fitting because the face's unevenness is complex. It is shown in (3).
4 3 2
y= × + × + × + × +a x b x c x d x e (3)
Where x and y are the serial number of a point in the curve and the height of the point.
The 3D face image after processing is shown in figure 4.
Figure 4. 3D face image after processing.
4. 3D Face Positioning
The amount of 3D face image data is very large, and it takes a very long time to perform 3D face location directly. In order to accelerate the positioning speed, the search area is
determined based on the fringe image before accurate positioning. The specific positioning steps are shown as follows:
Firstly, get face silhouette image through image preprocessing and determine the basic human face information in the image. The basic human face information includes the left and right edge lines, the upper and lower edge coordinates and the width of the human face in the image;
Secondly, the fourth curve is fitted based on the left edge (or right edge) of the face, and the ear position is located according to the curve;
Finally, the search area is determined based on the position of the ear and the basic information of the face. In the determined search area, the positions of the tip of the nose and the inner canthus are accurately located based on the height and shape index [11-14].
4.1. Initial Positioning of the Face Image
To confirm the approximate position of the entire face based on the fringe image, the difference between deformed grating fringe image and background grating fringe image needs to be subtracted to get the deformed fringe image with the background removed. And then the binarization was used for removing the tiny error points. After that, the point-by-point search (from top to bottom and from left to right) was used for searching the pending effective point with the value of 1.
After that, search the pending valid point with a value of 1 point by point following the order from top to bottom and from left to right. After the pending valid point is searched, set this point to the starting point at the top left corner of the 3×3 area (when searching from right to left, this point is the upper right corner of the area), and then determine the number of pending valid points in the area. If the number is greater than 5 (the agreed number), determine the point as a valid point. If the number is less than or equal to 5 (the agreed number), then the point is invalid.
When a valid point is determined, determine the point as the left edge of the face and save its coordinates. Next, use this method to search another valid point from right to left in the row. Use this point as the right edge of the face, save its coordinates and calculate the length between the two valid points as the width of the face on that line in the image. After the left and right two valid points are found, the value of the pixels between the two points are changed to 1, and the value of the pixels on both sides become 0.
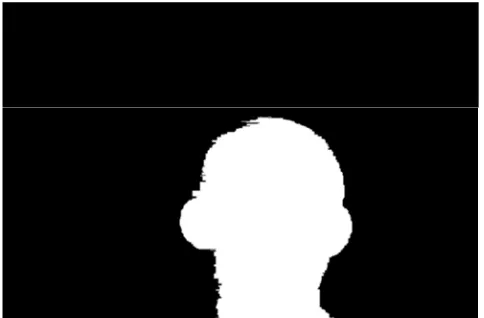
After the processing completes a row of pixels, the next row will be processed until the processing of the entire image is completed.
Figure 5. Face silhouette image.
4.2. Location of the Ear
It can be seen from the silhouette image of face that the location of the human ear is the widest position in the face, and the face side edge points can be connected into a quadratic curve. However, the acquired image may contain shoulders, it is shown in figure 6. And then the acquired side edge is not a quadratic curve, but a quartic curve with one valley (peak) and two peaks (valleys). The fitted quartic curve is obtained according to the left (right) edge points. The formula of the fitted quartic curve is shown in (3):
Figure 6. Face silhouette image including shoulders.
After completing the curve fitting, the position of the ear can be determined based on the number of extreme points of the left edge (or right edge) curve of the human face and the width of the human face:
If the edge curve has only one crest (or trough), this point is the position of the ear, and the cut-off point below the curve (which has a relatively large coordinate value) is the position of the neck;
If the edge curve has a peak (or valley) and a valley (or peak), then the upper peak (or valley) is the position of the ear, and the lower valley (or peak) is the position of the neck;
If the edge curve has two crests (or troughs) and one trough (or crest), then the upper crest (or trough) is the position of the ear, and the trough (or crest) is the position of the neck.
The edge of the face is not a standard curve, so the peak
(valley) of the curve is not the exact location of the ear. Therefore, the position where the face width value is the largest is searched near the position of the ear (1/3 of the distance from the neck to the upper edge point). This position is the final position of the ear.
4.3. Pinpoint the Nose Tip and Inner Canthus
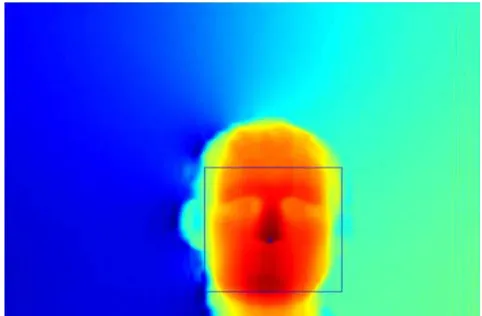
After the position of the ear is determined, the search area of the tip of the nose is determined according to the coordinates at the edge of the human face, the position of the ear, and the width of the face at the ears. Centering on the position of the ear, extend 1/4 of the length of the face upwards and downwards as the upper edge and lower edge of the search area of the tip of the nose. The left and right edges of the ear respectively extend towards the center by 1/6 of the width of the human face as the left and right edges of the search area of the tip of the nose. The search area of the tip of the nose is shown in figure 7.
Figure 7. Search area of the tip of the nose.
The point with the highest height (the highest value) in the search area of the tip of the nose is set as the tip of the nose to be determined, and then the first-order gradients fα, fβ and
second-order gradients fαα, fββ, fαβ at this point are calculated
according to (4) and (5):
(
)
(
) (
)
(
,,)
(
, 1, 1) (
,,)
f f f
f f f
α β
α β α β α β
α β α β α β
= + −
= + −
(4)
(
)
(
) (
)
(
) (
)
(
)
(
)
(
) (
)
(
) (
)
(
)
(
)
(
) (
)
(
) (
)
(
)
, 1, ,
, 1,
, , 1 ,
, , 1
, 1, 1 , 1
1, ,
f f f
f f
f f f
f f
f f f
f f
αα
ββ
αβ
α β α β α β
α β α β
α β α β α β
α β α β
α β α β α β
α β α β
= + −
− − −
= + −
− − −
= + + − +
− + −
(5)
Where α and β are the abscissa and ordinate of the point, respectively, and f (α, β) is the pixel value at (α, β) in the image.
curvature H according to the first-order gradient and second-order gradient. It is shown in (6):
(
)
(
) (
)
(
)
(
)
(
)
(
(
(
)
)
(
)
)
(
)
(
)
(
(
)
)
(
)
(
)
(
)
(
)
(
(
)
)
(
)
(
)
(
)
(
) (
) (
)
(
)
(
)
(
)
2
2 2
2 2 2 2
2 2
3 3 3
2 2 2 2 2 2 2 2 2
, , ,
,
1 , , 1 , ,
, 1 , , 1 , 2 , , ,
,
1 , , 1 , , 1 , ,
f f f
K
f f f f
f f f f f f f
H
f f f f f f
αα ββ αβ
α β α β
αα β ββ α α β αβ
α β α β α β
α β α β α β
α β
α β α β α β α β
α β α β α β α β α β α β α β
α β
α β α β α β α β α β α β
= −
+ + + +
+ +
= + −
+ + + + + +
(6)
The shape index is calculated according to (7):
1 1 2
1 2
1 1
tan 2
ShapeIndex κ κ
π − κ κ
+ = −
− (7)
2
1 H H K
κ = + − (8)
2
2 H H K
κ = − − (9)
Where κ1 and κ2 are the maximum curvature and the
minimum curvature.
Judge whether this point is the nose point by the shape index. If the shape index is greater than the pre-set value, this point will be designated as the tip of the nose. If not, this point and its nearby 3×3 area will be removed and searching will continue until the tip of the nose is found. The positioning result of the tip of the nose is shown in figure 8.
Figure 8. Positioning result of the tip of the nose.
After the position of the tip of the nose is determined, the inner canthus search area is determined according to the position of the tip of the nose, the width of the face, and the length of the face. The height of the search area is 1/2 of the length between the tip of the nose and the upper edge, and the width of the search area is 1/3 of the width of the face at the ears. The found area of inner canthus is shown in figure 9.
Figure 9. Search area of inner canthus.
Find the lowest height point in the left and right search areas as the inner canthus to be determined respectively. If the shape index of this point is less than the set value, it is determined that this point is the position of the inner canthus. If the shape index of the point is greater than or equal to the set value, the area is removed and the search is continued until the positions of the inner canthus are searched. The positioning results of inner canthus as shown in figure 10.
Figure 10. Positioning results of inner canthus.
5. Experimental Results
the deformed fringe images. The 3D face positioning experiment is completed using MATLAB R2014a on the Windows operating system.
The size of the image captured with camera is 1920×1080, this image contains many useless areas. If the original image is processed directly, the speed will be very slow. Therefore, the effective part with stripes in the image needs to be automatically cut out according to the fringe information in the image before the specific processing. The effective image size after the cut is 841×621, a total of 584,361 pixels.
This experiment collected 116 groups of face images. Part of the experimental results is shown in figure 11.
The time for 3D face image reconstruction and image restoration is between 2.86 seconds and 3.24 seconds, and the average time is 2.98 seconds. The processing time of 86 groups of images is less than 3.00 seconds.
The time for positioning the nose and inner corners is between 1.01 and 1.17 seconds. The average positioning time is 1.07 seconds. The positioning time of 99 groups of images is less than 1.10 seconds.
Figure 11. Parts of the positioning results.
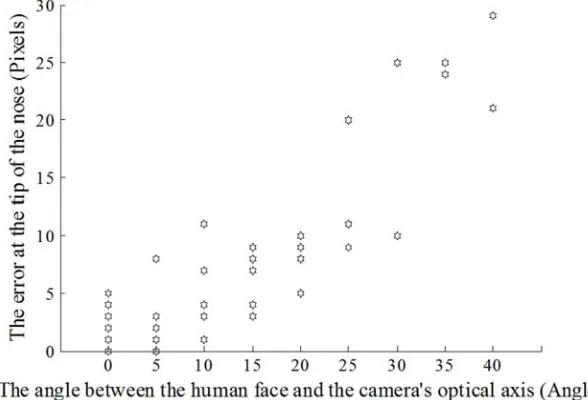
Before the experiment, the position of the nose and inner corners of the resin portrait was marked. The difference between the positioning result and the label position is calculated. The positioning error is equal to the difference of the abscissa plus the difference of the ordinate. The scattered plots of error distribution at the tip of the nose and inner canthus are shown in figure 12 and figure 13.
Figure 12. Scattered plot of error distribution at the tip of the nose.
Figure 13. Scattered plot of error distribution at inner canthus.
0 5 10 15 20 25 30 35 40 0
5 10 15 20 25 30 35 40
The angle between the human face and the camera's optical axis(Angle)
T
h
e
e
rr
o
r
at
t
h
e
i
n
n
er
c
an
th
u
s(
P
ix
e
ls
It can be seen from figure 12 and figure 13, when the face is frontal or rotated to the left or right by less than 20 degrees, the positioning error is relatively small. The positioning error of the tip of the nose is within 10 pixels (approximately 2.5 mm), and the positioning error of the inner canthus is within 15 pixels (approximately 3.8 mm). When the face rotation is greater than 20 degrees, the feature will be occluded and the error will increase. As the rotation angle increases, the positioning error at the tip of the nose and the inner canthus increases. When the face rotates more than 40 degrees, the features at the tip of the nose and the inner canthus are blocked to a greater degree, and the positioning results will show larger deviations.
When the allowable error is 15 pixels, there are 99 images in 116 3D face images with different facial poses, which can accurately locate the positions of the nose tip and the inner canthus. The positioning accuracy rate is 85.34%. When the face rotation angle is less than 20 degrees, the positioning accuracy rate is 96.88%. The experimental results show that the 3D face feature location method based on the stripe and shape index is feasible.
6. Conclusion
A 3D face feature location method based on stripes and shape index is proposed in this paper. This method locates the tip of the nose and inner canthus based on the characteristics of the fringe image and the features of the human face. Determine the basic information of the face in the image and the search area based on the difference between the background stripe image and the deformation stripe image. Then complete the exact positioning according to the height information and shape index. The determination of the search area can not only reduce the amount of computation, but also eliminate some of the interference points and problematic points in the image. Experimental results show that the positioning method proposed in this paper has higher accuracy and faster positioning speed.
Acknowledgements
The paper is supported by the Science and Technology Foundation of Shenyang under project F16-205-1-11.
References
[1] Andrea F A, Michele N, Daniel R and Gabriele S. 2D and 3D face recognition: A survey. Pattern Recognition Letters 2007; 28: 1885-906.
[2] Wang Y-M, Pan G and Wu Z-H. A Survey of 3D Face Recognition. JOURNAL OF COMPUTER-AIDED DESIGN & COMPUTER GRAPHICS 2008; 20: 819-29.
[3] Cai Z-M and Yan J-W. Face recognition: From 2D to 3D. Computer Engineering and Applications 2011; 47: 155-9. [4] Chellappa R, Wilson C L and Sirohey S. Human and machine
recognition of faces: a survey. Proceedings of the IEEE 1995; 83: 705-41.
[5] Yuan F-L and Zhong J-G. Data obtain and automatic orientation of 3D facial model. Computer Engineering and Design 2006; 27: 2966-9.
[6] Takeda M and Mutoh K. Fourier transform profilometry for the automatic measurement of three-dimensional object shapes. Applied Optics 1983; 22: 3977-82.
[7] Srinivasan V, Liu H-C and Halioua M. Automated phase-measuring profilometry of 3-D diffuse objects. Applied Optics 1984; 23: 3105-8.
[8] Li W-S, Su L-K and Su X-Y. Phase-Measuring Profilometry in Big Scale Measurement. ACTA OPTICA SINICA 2008; 20: 819-29.
[9] Dennis C G and Louis A R. Robust two-dimensional weighted and unweighted phase unwrapped that uses fast transforms and iterative methods. Journal of the Optical Society of America A 1994; 11: 107-17.
[10] Guo Y, Chen X-T and Zhang T. Robust phase unwrapped algorithm based on least squares. Optics & Lasers in Engineering 2014; 63: 25-9.
[11] Zhu S-H, Zhang L, Luo Y and Chen Y-H. Characteristics positioning of facial point cloud based on spin image. COMPUTER ENGINEERING AND DESIGN 2017; 38: 2209-12.
[12] Dorai C and Jain A K. COSMOS-A representation scheme for 3D free-form objects. IEEE Transactions on Pattern Analysis & Machine Intelligence 1997; 19: 1115-30.
[13] Li X-L and Da F-P. 3D Face Recognition Based on Profile and Rigid Regions. Journal of Image and Graphics 2010; 15: 266-73.