ISSN 2334-2447 (Print) 2334-2455 (Online) Copyright © The Author(s). All Rights Reserved. Published by American Research Institute for Policy Development DOI: 10.15640/jges.v3n1a1 URL: http://dx.doi.org/10.15640/jges.v3n1a1
An Annual Streamflow Reconstruction of the Red River, Kentucky Using a White Pine (Pinus Strobus) Chronology
C. Andrew Day1 and Jeremy Sandifer2
Abstract
Using tree ring data (dendrochronology) a reconstruction of the historical annual stream flow of the Red River Basin of Kentucky was performed. Tree ring widths provide a surrogate record of the past climate and hence stream flow of a particular area, with thicker rings corresponding to wetter periods and thinner rings corresponding to drier conditions. This type of research is common in river basins across the western USA which are prone to serious droughts and flooding on annual and decadal scales. However, little research has been conducted in this manner in the eastern USA, Kentucky in particular, despite the potential for intermittent dry and wet periods over time. The use of the Daniel Boone National Forest is the focus of this study due to the well documented past flooding and drought events of the Red River during the 20th Century. The technique provided a reconstructed record from 1713 up to the end of the observed period in 1999. The results show that there has been a decrease in the number and frequency of prolonged wet and dry periods, although there has been an increase in the extreme wet and dry conditions during the later observed record which suggests a shift in the hydroclimatological regime of the river basin.
Keywords: dendrochronology, streamflow reconstruction, southeastern US
1. Introduction
Records of historical pluvial (wet) and drought (dry) conditions across the US typically originate from streamflow gauge records supplied by federal and state agencies, most notably the US Geological Survey (USGS). However, whilst the spatial coverage of these streamflow gauge records is fairly dense, especially for the southeastern region of the US, the temporal coverage rarely exceeds beyond the twentieth century.
1
Dept. of Geography and Geosciences, University of Louisville, Louisville, KY, 40292, USA. Email: [email protected], Tel: 502-852-2703, Fax: 502-852-4560
2
This provides a very limited dataset for water resources and river basin ecological management purposes. In particular current water resources management practices will determine future variability based on the short term gauged history (Woodhouse & Lukas, 2006a; 2006b; Milly et al., 2008). Almost no consideration of potentially more serious or changing conditions having occurred before the gauged period is taken into account due to a lack of readily available and accurate data. One of the major breakthroughs in this research area has been the development of dendrochronology in reconstructing historical streamflow beyond the gauged history of a river basin. This technique utilizes the annual tree rings present in moisture sensitive tree species as a surrogate record of various environmental conditions at the time of tree ring formation (Speer, 2010). Studies investigating the link between annual tree growth and streamflow began as far back as the 1930s in the US, although they were simple estimates of wet and dry conditions (Hardman & Reil, 1936; Hawley, 1937). One of the first studies to fully investigate the statistical relationship between tree rings and streamflow was conducted by Stockton & Jacoby, (1976).
Nevertheless, previous research has developed tree ring chronologies for past environmental reconstructions across the southeastern US. Blasing, Duvick, and West (1981) reconstructed May-June precipitation across eastern Tennessee and then expanded upon this research by reconstructing precipitation across the wider southeastern US region, identifying cyclical wet and dry periods, both more extreme than any previously recorded (Blasing, Stahl, & Duvick, 1988). In a more recent study, Henderson and Grissino-Mayer (2009) noted significant correlation between spring/summer precipitation and longleaf pine (Pinus palustris) growth across the southeastern coastal plain stretching from east Texas to South Carolina. Regarding streamflow reconstructions across the southeastern/Atlantic US, Cook and Jacoby (1983) successfully reconstructed June-August streamflow between 1730-1977 using five tree ring chronologies from multiple species for the Potomac River. This reconstruction was further extended to 950-2001 for May-September streamflow by Maxwell, Hessl, Cook, and Pederson (2011) which better replicated the mean and variance of the instrumental record and confirmed the presence of periodicity in the seasonal streamflow. Elsewhere a study by Cleaveland (2000) used chronologies obtained from Baldcypress (Taxodium distichum) trees to reconstruct June-August streamflow between 1023-1985 for the White River (Arkansas), discovering that the twentieth century experienced more extreme low flow events and a larger number of high flow events due to climatic and anthropogenic changes. The purpose of this research is to expand upon the limited tree ring database for the southeastern US by developing a tree ring site chronology to reconstruct the annual streamflow for the Red River, eastern Kentucky. Of particular interest are whether the record gauged drought and pluvial events have been exceeded during this extended history, and whether the occurrence and frequency of these events has been changing over the extended reconstruction.
2. Study Area
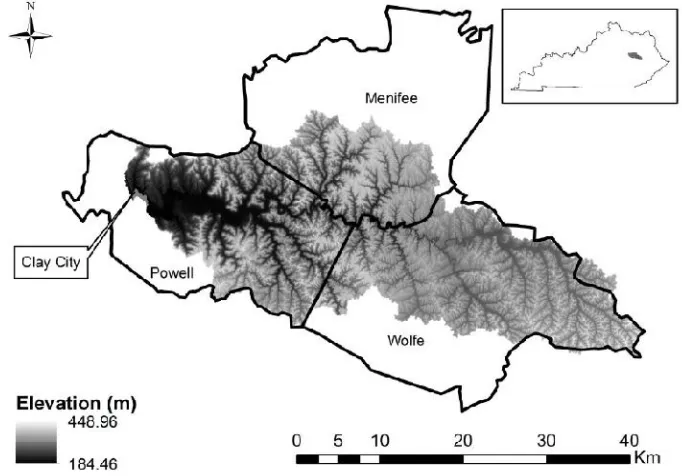
The mean annual gauged flow (1939-2012) of the Red River at Clay City is
14m3/sec, to give a mean annual streamflow volume of approximately 4.42MIL cubic
meters.
Figure 1: Red River Basin Elevation and Location within Kentucky
3. Data and Methods
3.1 Streamflow Data
The US Geological Survey provided an unbroken record of annual streamflow data (1939-1999) for the streamgauge located at the Red River outlet by Clay City, Kentucky (USGS #03283500). The mean annual discharge for each year was converted from a discharge in cubic feet/sec to a volume in cubic meters.
3.2 Tree Ring Data
As no tree ring site chronologies currently existed in the vicinity of the Red River Basin, a site chronology was developed by obtaining tree ring samples from 32 individual white pine trees (Pinus strobus) within the basin, in cooperation with the Daniel Boone National Forest Service. A 5mm Haglof Incremental borer extracted the core samples from each tree. Once extracted, the cores were left to dry for approximately one week, before being glued into specially prepared wooden core holders. Following this, sanding of each core took place using progressively finer grains of sandpaper ranging from 50 grit (125-149µm) to 400 grit (20.6-23.6µm) making individual tree ring identification easier (Speer, 2010).
3.3 Streamflow Reconstruction
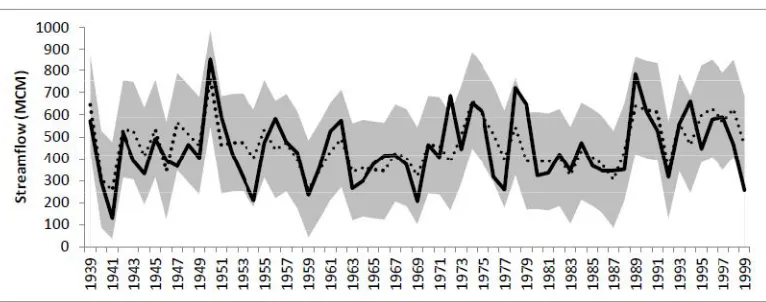
To reconstruct historical annual streamflow beyond the gauged period, linear regression was applied using the site chronology tree ring widths as the predictor variable with the annual streamflow volume as the predictand. Calibration and validation of the regression model used the split-sample procedure in which a portion of the observed record was withheld from calibration, and then utilized for the validation component in order to ensure the calibration and validation datasets were independent of one another (Woodhouse, 2003). In this study the model calibration utilized data for the period 1939-1978, and then validated for the period 1979-1999. Several statistical measures provided information on the fit and overall ability of the
regression model to reconstruct observed annual streamflow volume, including R2
(variance explained by the model), SE (standard error), RE (reduction of error- the
validation equivalent of R2), and RMSE (root mean square error).
4. Results and Discussion
4.1 Model Calibration and Validation
Figure 2: Observed (Black) Vs. Reconstructed (Hatched) Streamflow 1939-1999. Gray Area Represents 95% Confidence Interval
Table 1: Calibration and Validation Statistics
Table 2: Observed Vs. Reconstructed Streamflow (MCM) Statistics 1939-1999
4.2 Streamflow Reconstruction
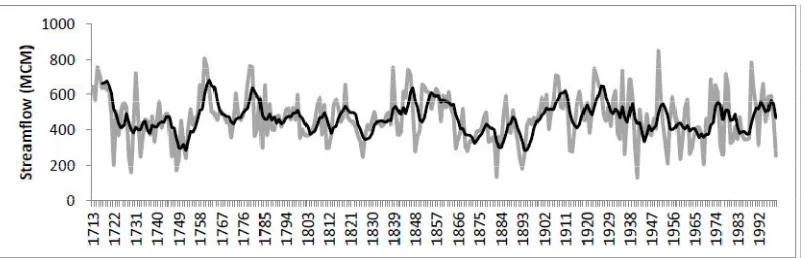
Annual streamflow volume was reconstructed for 1713-1999 when applying the regression model (Figure 3). Table 3 displays the descriptive streamflow volume statistics for the observed (1939-1999) and reconstructed (1713-1938) periods. While the mean and median annual streamflow volumes were very similar between the gauged and reconstructed periods, the observed period experienced a greater variance in annual streamflow volume, confirmed by the larger standard deviation (SD) and greater range between the minimum and maximum volumes. This was expected as a result of the potential model under-prediction.
Figure 3: Reconstructed Streamflow (1713-1999) With 5 Year Running Mean (Solid Black Line)
Table 3: Observed Vs. Reconstructed Streamflow (MCM) Statistics
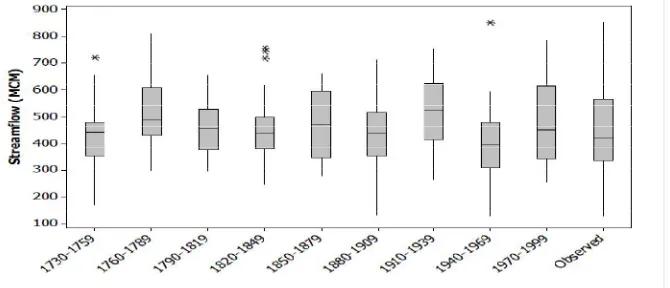
In comparison, the period 1790-1819 which marked the beginning of the stable period experienced a much lower variance of 778.9MCM. All reconstructed periods had higher median streamflow than the observed period initially suggesting a shift in the operation of the Red River Basin hydroclimatological system in line with research by Milly et al. (2008).
Figure 4: Boxplots of 30-Year Streamflow for Observed and Reconstructed Periods
Regarding the hydrological conditions (wet versus dry), the observed period
contained a higher proportion of individual wet years (≤0.2 percentile), accounting for
41% of the total period versus 35% for the reconstructed period (Table 5). This agrees with the statistics in Table 3 in that the observed period, whilst not experiencing any prolonged extreme wet or dry conditions has certainly experienced a greater proportion of dry years in total. However, the reconstructed period experienced a greater proportion of wetter conditions overall (49%) compared to the observed period (41%). Furthermore, the observed period hydrological conditions are fairly evenly split at approximately 20% each, while the reconstructed period is skewed towards the wetter conditions.
Table 5: Observed vs. Reconstructed Streamflow Hydrological Conditions
Figure 5: Reconstructed Streamflow (1713-1999) with Prolonged Wet (Light Gray) and Dry (Dark Gray) Periods Highlighted. Mean Streamflow Shown
with Hatched Line
5. Conclusions
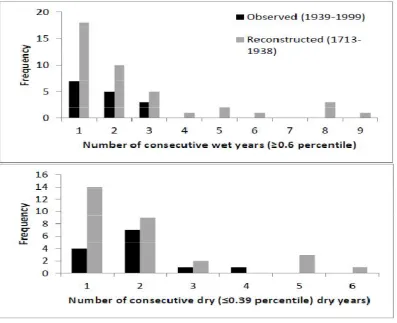
Dendrochronology has proven to be a valuable tool in reconstructing historical streamflow far beyond the gauged history of many river basins. It provides an extended assessment of the past hydrology and hence climate of the region. Historical data of this nature are a fundamental source of information for water resource planners, flood hazard researchers and river basin ecologists for better understanding challenges that may lie ahead in terms of the future variability of streamflow in response to wetter or drier conditions. Currently these planners and researchers will base their analysis and research on the extremes of hydrological conditions from the gauged history, which may not be an accurate documentation of either the magnitude or frequency of these conditions following an extended reconstruction of streamflow. The basis of this research was to provide an extended streamflow history for a region that is currently lacking this kind of research, yet has displayed a wide range of hydrological extremes over its gauged history and provides a unique habitat for several moisture sensitive plant and tree species. It is apparent from this research that while the more recent observed streamflow record has witnessed a reduction in the number and frequency of extended wet and dry periods, there has been an increase in the extremes of wet and dry conditions. This suggests that the predictability of annual wet and dry conditions is declining in light of the reconstructed data. This could imply a shift in the operation of the hydroclimatological system of the Red River basin with further individual wet and dry extremes possible in the future. This could ultimately result in an increase in short-term flood and drought hazard issues. However, further research should be conducted which incorporates other tree ring chronologies, both internal and external to the basin. This could also include other species to document the historical hydroclimatological record of the Red River Basin to potentially increase the model viability in reconstructing historical streamflow.
Acknowledgements
6. References
Barnett, F.A., Gray, S., & Tootle, G. (2010). Upper Green River Basin (United States) streamflow reconstructions. Journal of Hydrologic Engineering, 15, 567-579.
Blasing, T.J., Duvick, D.N., & West, D.C. (1981). Dendroclimatic calibration and verification using regionally averaged and single station precipitation data. Tree-Ring Bulletin, 41, 37-43.
Blasing, T.J., Stahle, D.W., & Duvick. D.N. (1988). Tree ring-based reconstruction of annual precipitation in the South-Central United States from 1750 to 1980. Water Resources Research, 24, 163–171.
Cleaveland, M.K. (2000). A 963-year reconstruction of summer (JJA) streamflow in the White River, Arkansas, USA, from tree-rings. The Holocene, 10, 33–41.
Cook, E.R., & Jacoby, G.C. (1983). Potomac River streamflow since 1730 as reconstructed by tree rings. Journal of Climate and Applied Meteorology, 22, 1659–1672.
Earle, C.J. (1993). Asynchronous droughts in California streamflow as reconstructed from tree rings. Quaternary Research, 39, 290-299.
Fritts, H.C. (1976). Tree rings and climate. London, UK: Academic Press.
Gedalof, Z., Peterson, D.L, & Mantua, N.J. 2004. Columbia River flow and drought since 1750. Journal of the American Water Resources Association, 40, 1579-1592.
Hardman, G., & Reil, O.E. (1936). The relationship between tree-growth and stream runoff in the Truckee River basin, California-Nevada. The University of Nevada Agricultural Research Station Bulletin, 141, 1-38.
Hawley, F.M. (1937). Relationship of southern cedar growth to precipitation and runoff. Ecology, 18, 398-405.
Henderson, J.P., & Grissino-Mayer, H.D. (2009). Climate-tree growth relationships of longleaf pine (Pinus palustris Mill.) in the southeastern coastal plain, USA. Dendrochronologia, 27, 31-43.
Larson, D.O. (1994). California climatic reconstructions. Journal of Interdisciplinary History, 25, 225-253.
Maxwell, R.S., Hessl, A.E., Cook, E.R., & Pederson, N. (2011). A multispecies tree ring reconstruction of Potomac River streamflow (950-2001). Water Resources Research, 11, W05512.
Milly, P.C., Betancourt D.J., Falkenmark, M., Hirsch, R.M., Kundzewicz, Z.W., Lettenmaier, D.P., & Stouffer, R.J. (2008). Stationarity is dead: whither water management? Science, 319, 573-574.
Rinn, F. (2011). TSAP-WinTm. Time series analysis and presentation for dendrochronology and related applications. Version 4.64 for Microsoft Windows. User reference. Heidelberg, Germany: Rinntech.
Speer, J.H. (2010). Fundamentals of tree-ring research. Tucson, AZ: The University of Arizona Press.
Stockton, C.W., & Jacoby, G.C. (1976). Long-term surface-water supply and streamflow trends in the Upper Colorado River basin based on tree-ring analyses. Lake Powell Research Project Bulletin, 18, 1-70.
Treeflow. (2014). Streamflow reconstructions from tree rings. [Online] Available http://treeflow.info/index.html (July 19, 2014).
White, D.L., & Drozda, N.C. (2006). Status of Solidago albopilosa Braun (White-Haired Goldenrod) [Asteraceae], a Kentucky endemic. Castanea, 71, 124-128.
Wise, E.K. (2010). Tree ring record of streamflow and drought in the upper Snake River. Water Resources Research, 46, W11529.
Woodhouse, C.A. (2003). A 431-yr reconstruction of western Colorado snowpack from tree rings. Journal of Climate, 16, 1551-1561.
Woodhouse, C.A., Gray, S.T., & Meko, D.M. (2006). Updated streamflow reconstructions for the Upper Colorado River basin. Water Resources Research, 42, W05415.
Woodhouse, C.A., & Lukas, J.J. (2006a). Multi-century tree-ring reconstructions of Colorado streamflow for water resource planning. Climatic Change, 78, 293-315.
_________. (2006b). Drought, tree rings and water resources management in Colorado. Canadian Water Resources Journal, 31, 297-310.