Formation of Forward and Reverse Shock Waves
in a Magnetized Plasma: Two-Dimensional Particle Simulations
∗
)
Tatsunori URAGAMI and Mieko TOIDA
Department of Physics, Nagoya University, Nagoya 464-8602, Japan
(Received 19 November 2012/Accepted 9 September 2013)
Interactions of exploding and surrounding plasmas are studied with two-dimensional (2D) electromagnetic particle simulations, for a case in which the initial velocity of the exploding plasma is perpendicular to an ex-ternal magnetic field. It is confirmed that essentially the same phenomena (the penetration of exploding ions, the formation of a strong magnetic-field pulse, and the generation of forward and reverse shock waves) as in the previous one-dimensional (1D) simulations occurred in the 2D simulation. Further, modified two-stream insta-bilities excited by relative cross-field motion between ions and electrons are investigated with attention to their effects on the 2D structure of the strong magnetic-field pulse and on ion reflection by the pulse.
c
2013 The Japan Society of Plasma Science and Nuclear Fusion Research
Keywords: collisionless shock, modified two-stream instability, whistler wave, particle simulation DOI: 10.1585/pfr.8.2401155
1. Introduction
Shock waves can be generated from strong distur-bances, such as solar flares and supernova explosions, and are believed to play an essential role in producing high energy particles. Particle simulations have demonstrated that a large-amplitude magnetosonic shock wave can ac-celerate ions, electrons, and positrons through various non-stochastic mechanisms caused by strong electromagnetic fields near a shock front [1, 2]. These studies were con-cerned with acceleration processes after formation of a shock wave.
Shock formation process from a strong disturbance in a collisionless plasma has also been an important issue in plasma physics [3, 4] because it would be quite different from that in collisional fluids. In Ref. [5], interactions of two plasmas, surrounding and exploding plasmas, and resultant generation of large-amplitude waves in an exter-nal magnetic field have been investigated with theories and simulations. It has been shown that a strong magnetic-field pulse is produced near the initial boundary of the two plas-mas, from which the forward and reverse shock waves are created. Furthermore, the generation of large-amplitude Alfven waves and acceleration of electrons in these waves [6] have been reported. These theories and simulations [5,6] are concerned with one-dimensional (1D) effects, and multidimensional effects on the wave evolution have not been investigated.
In this study, by using two-dimensional (2D) electro-magnetic particle simulations, we investigate the interac-tions of exploding and surrounding plasmas for a case in which the initial velocity of the exploding plasmav0 is
author’s e-mail: [email protected]
∗)This article is based on the presentation at the 22nd International Toki
Conference (ITC22).
perpendicular to the external magnetic fieldB0. After de-scribing the simulation model and parameters in sec. 2, we verify the previous 1D result [5] with the 2D simulation in sec. 3. We confirm the theoretical predictions for plasma motions and show that forward and reverse shock waves are created after the formation of a strong magnetic-field pulse. In sec. 4, we study the 2D structure due to modified two-stream instabilities excited by relative cross-field mo-tion between ions and electrons through interacmo-tion with whistler waves. Multidimensional effects on ion reflection by the strong magnetic-field pulse are also discussed.
2. Simulation Model and Parameters
We use a 2D (two spatial coordinates and three veloc-ity components) relativistic electromagnetic particle code with full ion and electron dynamics to study the interac-tions of exploding and surrounding plasmas and the resul-tant formation of shock waves. A uniform external mag-netic field is in thezdirectionB0=(0,0,Bz0), and the
sim-ulation plane is (x,z) with a sizeLx×Lz=8192Δg×512Δg,
whereΔgis the grid spacing. The total number of simula-tion particles isN1.1×109.
Att=0, we have an exploding plasma with a fluid ve-locityv0 =(v0,0,0) in the regionx<band a surrounding plasma at rest in the regionx>b. The values ofbandv0 are set to beb=3300Δgandv0=12vA. The initial density ratio of exploding to surrounding plasmas isnE0/nS0 =2. The ion-to-electron mass ratio ismi/me =200. The light speed isc/(ωpeΔg)=4.0, and the electron and ion thermal
velocities in the upstream region are vTe/(ωpeΔg) = 0.5
andvTi/(ωpeΔg) = 0.035, respectively, where ωpe is the electron plasma frequency averaged over the entire region. The magnetic field strength is|Ωe|/ωpe =0.5; hence, the
c
2013 The Japan Society of Plasma
Alfven speed isvA/(ωpeΔg)=0.14.
3. Evolution of 1D Averaged
Quanti-ties
In this section, we compare the 2D simulation results with the previous 1D theories and simulations. A theory of characteristic curves for plasma motions is presented in Ref. [5], where the effects ofEyinduced by the cross
field-motion of exploding ions are analyzed for the time scale |Ωe|−1 <t ∼ |< Ωi|−1, whereΩeandΩiare electron and ion gyro-frequencies, respectively. It is shown that the trajec-tories of particles that are initially at the boundaryx = b
are written as
xiEb=vdt−(v0−vd) sin(−Ωit)/Ωi+b, (1)
xiSb=vdt+vd(1+r2xy/2) sin(−Ωit−rxy)/Ωi
+b+vdrxy/Ωi, (2)
xeb=vdt+b, (3)
withvd = cEy/Bz andrxy = Ex/Ey. Here, xiEb and xiSb
are for exploding and surrounding ions, respectively. As for electrons, the two kinds of electrons, which are initially separated in the coordinate space, will not mixed up later if the drift approximation is valid. This boundary is denoted byxeb.
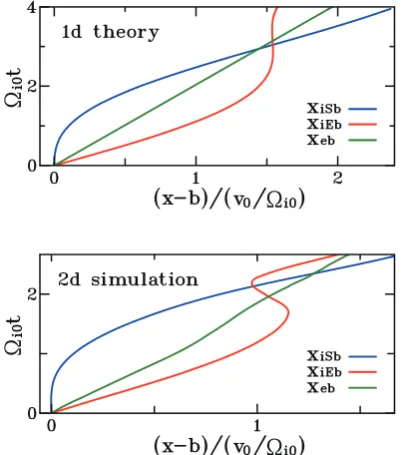
The upper panel in Fig. 1 shows the theoretical char-acteristic curves given by eqs. (1)-(3), for which we have setEy/Bz0 = 0.25,rxy = 0.1 (these values are consistent
with the simulation result), andΩi = Ωi0, which is
cal-Fig. 1 Characteristic curves for ions and electrons that are ini-tially at the boundary of exploding and surrounding plas-mas. The upper panel shows the theoretical curves (1), (2), and (3), and the lower panel displays the trajectories of 2D simulation particles.
culated using the external magnetic field strength. In the early phase,xiEbmoves faster thanxiSb, indicating that the
exploding ions penetrate in the surrounding plasma, and the exploding and surrounding ions overlap in the region
xiSb<x<xiEb. The electric fieldEyinduced by the
cross-field motion of exploding ions quickly accelerates the sur-rounding ions in theydirection. Because ofv×Bforce,
vyof the surrounding ions is converted tovx, andvxof the
exploding ions is converted tovy. As a result, the two
char-acteristic curvesxiSbandxiEbsubsequently intersect again.
The lower panel in Fig. 1 shows the trajectories of 2D simulation particles; we followed the orbits of particles that were initially in the regions b −Δg < x < b and
b < x < b+Δg for exploding and surrounding plasmas, respectively, and plotted their averaged orbits. A compar-ison of the two panels in Fig. 1 shows that the trajectories of 2D simulation particles can be explained by eqs. (1)-(3), although the time and space scales in the lower panel are different from those in the upper panel; this is because the 2D simulation particles experience the magnetic field that is gradually intensified, which is not considered in the the-ory.
We now consider the evolution of magnetic field Bz
averaged along thezdirection, ¯Bz. Figure 2 shows ¯Bzas a
function ofxandt, wherexiSb,xiEb, andxebare the same
as in the lower panel in Fig. 1. In the early stage,Ωi0t<1, ¯
Bzis intensified in the regionxeb < x<xiEb, and a strong
magnetic-field pulse is formed. AtΩi0t1, the pulse splits into two pulses, which then develop into shock waves, one going forward and the other backward. This is caused by the ion reflection. The surrounding (exploding) ions are reflected forward (backward), which produces the forward (reverse) shock wave. The ion phase-space plots will be discussed later.
It is thus confirmed that essentially the same phenom-ena in the 1D simulation (the penetration of exploding ions, overtaking of surrounding ions, intensification of the magnetic field, and formation of two pulses) have been ob-served in the 2D simulation.
Fig. 3 Profiles of z-averaged Bz and ne, contour map of 2D
fluctuation ofBz, and ion and electron phase-space plots
(x,px) atΩi0t=0.55. Pink and green dots represent
ex-ploding and surrounding particles, respectively.
4. Multi-Dimensional Structure
Relative cross-field motion between ions and elec-trons in the ion-overlapping regionxiSb<x<xiEbcan
ex-cite modified two-stream instabilities through interaction of whistler waves [7, 8], which are not included in 1D sim-ulations. We study the evolution of the instabilities in the magnetic field being gradually compressed because of a collision of two plasmas.
Figure 3 displays the xprofiles ofz-averaged Bz and
electron density ne, ion and electron phase-space plots (x,px), and the contour map ofBz−B¯zin the (x,z) plane at
Ωi0t=0.55; the pink and green dots are for the exploding and surrounding particles, respectively. The bottom panel shows that 2D fluctuations are excited in the region where the surrounding and exploding ions overlap.
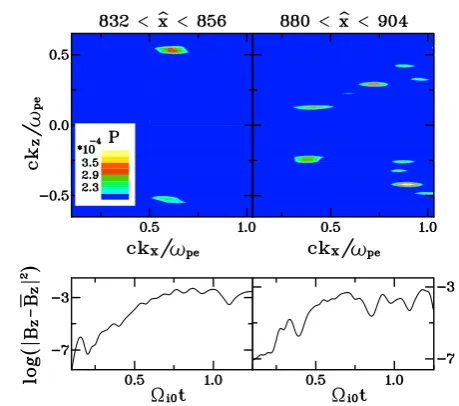
The upper panel in Fig. 4 shows the power spectra
p(kx,kz) of the magnetic field in the regionsxiSb<x<xeb
andxeb < x< xiEb atΩi0t =0.55. These regions are the
left- and right-hand sides of the electron boundaryx=xeb,
respectively, which we call left and right regions. The wavenumber of the dominant mode in the left region is (ckx/ωpe,ckz/ωpe)=(0.62, 0.53), which is different from
that in the right region (0.89,−0.42). This difference may be caused by the fact that the magnetic field in the right region is intensified, compared to that in the left region. The lower panel in Fig. 4 shows the time variations of the amplitudes of these dominant modes.
We compare the simulation results with a linear the-ory. We assume that ions are effectively unmagnetized while electrons are magnetized. Then, a linear dispersion relation for a system with two ion beams interacting with
Fig. 4 Power spectra,P(kx,kz), ofBzin the left- and right-hand
sides ofxebatΩi0t=0.55 and time variation of the
am-plitudes of the dominant modes.
whistler modes is written, in the electron rest frame, as ω2
Ω2 e
− c4k4cos2θ ω4
pe(1+c2k2/ω2pe)2 − ω2
ω2 pe
c2k2/ω2pe
1+c2k2/ω2 pe
⎡ ⎢⎢⎢⎢⎢
⎣ ω
2 pa (ω−kxVa0)2 +
ω2 pb (ω−kxVb0)2
⎤ ⎥⎥⎥⎥⎥ ⎦
=0, (4)
where the subscripts a and b denote two different ion groups (surrounding and exploding ions), andθis the prop-agation angle of whistler modes. Equation (4) predicts that ifVa0 >Vb0, waves excited by a-ions have greater growth rates than those by b-ions. The condition for the destabi-lization is
θ < θmax=arctan[(mi/me)1/2vA/2Va0]. (5) Because the magnetic field is intensified in the right region, θmax for this region, 78◦, is greater than that for the left region, 63◦. We have estimatedθmax by substituting the observed values of magnetic field, plasma density, and ion speed in Eq. (5). The upper panel in Fig. 4 shows that the excited waves satisfy the condition (5). The value ofθof the dominant mode is 65◦ for the right region (49◦for the left region). The theoretical growth rate of the dominant mode, which is calculated from Eq. (4), isγ = 0.029|Ωe| for the right region (0.034|Ωe|for the left region), which is close to the observed growth rate shown in the lower panel in Fig. 4,γ=0.022|Ωe|(0.031|Ωe|). From Eq. (4), we can estimate thatθand wavenumberkfor the modes that have maximum growth rates areθ69◦andck/ωpe1.7
for the right region, and θ 48◦ andck/ωpe 2.0 for
Fig. 5 (a) Profiles of ¯Bz(x), ¯Ex(x), and of the magnitudes of
the 2D fluctuations of Bz and Ex defined by Eq. (6) at
Ωi0t=0.875. Electron and ion phase-space plots are also
plotted. (b) Variations of Bz and Ex alongzat fixed x
positions whereσ2
Bzandσ 2
Ex become maximum,
respec-tively.
than the theoretical ones; the former is about 58% of the latter for the right region and 41% for the left region. This may be because askincreases, whistler waves approach electrostatic waves; atΩi0t 0, amplitudes of magnetic fluctuations were quite small at the wavenumbers where the theoretical growth rate becomes maximum, compared to those at smaller wavenumbers. Because the modes with the smaller wavenumbers are also unstable, we observed, atΩi0t = 0.55, large-amplitude magnetic fluctuations at
these wavenumbers in the upper panel of Fig. 4.
We now study the nonlinear evolution of the instabili-ties. Figure 5 (a) shows thexprofiles ofz-averagedBzand Exand of the magnitudes of 2D fluctuations ofBz andEx
atΩi0t=0.875, whereσ2
FwithF=BzorExis defined as
σ2
F(x,t)=
1
Lz Lz
0
dz[F(x,z,t)−F¯(x,t)]2, (6) where ¯F(x,t) is thez-averagedF(x,z,t). We note that the magnitudes of the 2D fluctuations are noticeably great near the boundary of the exploding and surrounding electrons,
x=xeb, and near the positions where ¯Bzhas a strong slope.
Figure 5 (b) shows the variations ofBzandExalong thez
direction; the values ofBzandExare at fixedxpositions
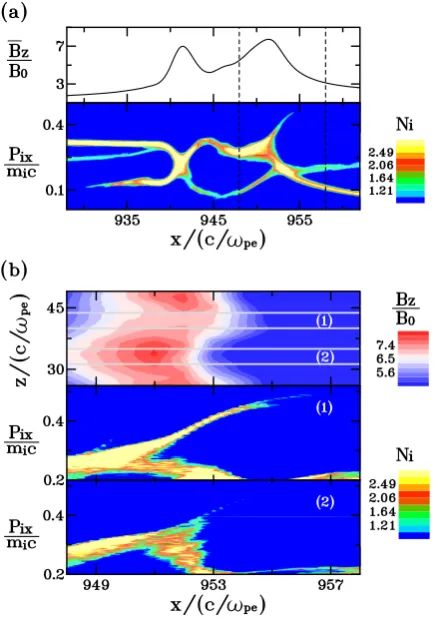
Fig. 6 (a) Profile of ¯Bzand ion phase-space plot atΩi0t=1.125.
(b) Expanded view of right-pulse region. Contour map of Bzin the (x,z) plane and ion distributions for differentz
ranges.
whereσ2
Bz andσ
2
Ex become maximum, respectively. For
comparison,BzandExat earlier time,Ωi0t=0.55, are also
plotted. The 2D fluctuations at later time (Ωi0t ∼ 0.875)
have longer wavelength and greater amplitudes. The mech-anism for the intensification of 2D fluctuation with longer wavelengths near x = xeb is unclear, although it seems
that this nonlinear development is caused by strong current flowing there.
AtΩi0t =0.95, the strong magnetic-field pulse starts
to reflect surrounding ions forward and exploding ions backward. Figure 6 (a) shows the profile of ¯Bzand the ion
phase space plot (x,px) atΩi0t = 1.125, where the color
indicates the ion number density including both the sur-rounding and exploding ions. Because the ion reflection has already started, there are two pulses in Fig. 6 (a). The ions in front of the right pulse [952 < x/(c/ωpe) < 955] withpix > 0.3micare reflected surrounding ions, and the ions behind the left pulse [930 < x/(c/ωpe) <940] with
pix<0.2micare the reflected exploding ions. The strength of ion reflection depends on the position z because the electromagnetic fields vary alongzdirection, as shown in Fig. 5. Figure 6 (b) displays the expanded view of the right pulse region. The upper panel shows the contour map ofBz
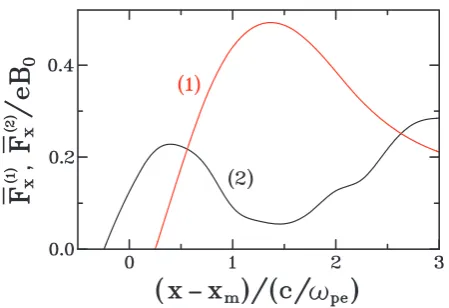
Fig. 7 Ion forces in thexdirection atΩi0t=0.9 for thez-ranges
(1) and (2) of Fig. 6.
958 and 26<z/(c/ωpe)<49. The middle and lower pan-els show distributions of ions withpix>0.2micfor the dif-ferent range ofz, 40<z/(c/ωpe)<44 denoted by (1) and 31 <z/(c/ωpe) <35 denoted by (2). This clearly shows that the ion reflection in region (1) is strong, whereas that in region (2) is weak. Because the reflected ions tend to compress magnetic field [9], magnetic field lines bend for-ward in the region (1) compared to region (2). Further, because the reflected ions gain energies from the electro-magnetic field, the ion reflection causes the damping of
Bz[9]. Therefore,Bzis weaker in the region (1) than in the
region (2) atΩi0t=1.125, which is slightly after the time when the ion reflection starts.
Figure 7 shows the forces on ions in thez-ranges (1) and (2) of Fig. 6 atΩi0t =0.9. This time is just before the
time when the ion reflection starts. We define the averaged ion force as
F(x,z)=q[E(x,z)+u(x,z)×B(x,z)/c], (7) whereuis the ion fluid velocity,
u(x,z)= vf(x,z,v)dv
f(x,z,v)dv. (8)
We write thexcomponent ofFaveraged over thez-ranges (1) and (2) as ¯F(1)x and ¯F(2)x , respectively. This figure clearly
shows that in front ofxm, wherexmis the position at which ¯
Bz becomes maximum, ¯F(1)x is much stronger than ¯F(2)x .
This confirms that the strong ion reflection is caused by the strong ion force in thexdirection, because the change in the positionzof ions during the period fromΩi0t=0.9
to 1.125 is negligibly small.
5. Summary
We have studied shock formation processes arising from the collision of exploding and surrounding plasmas with 2D electromagnetic particle simulations, for the case in which the initial velocity of the exploding plasma is per-pendicular to an external magnetic field. As in the previous 1D simulations, a strong magnetic-field pulse is formed because of the penetration of the exploding ions, and the pulse reflects ions, generating forward and reverse shock waves. The 2D structure of the pulse and its effect on ion reflection were also investigated with attention to the evolution of whistler wave instabilities caused by relative cross-field motion between ions and electrons. Long-time evolution of 2D structures of forward and reverse shock waves is a future subject.
Acknowledgments
This work was carried out as part of the collaboration program under Grant No. NIFS12KNSS036 of the Na-tional Institute for Fusion Science, and of the joint research program of the Solar-Terrestrial Environment Laboratory, Nagoya University, and was supported in part by a Grant-in-Aid for Scientific Research (C) Grant No. 21540510 from the Japan Society for the Promotion of Science.
[1] Y. Ohsawa, Phys. Fluids28, 2130 (1985).
[2] T. Iwata, S. Takahashi and Y. Ohsawa, Phys. Plasmas19,
022302 (2012) and references therein.
[3] D.W. Forslund and C.R. Shonk, Phys. Rev. Lett.25, 1699
(1970).
[4] L. Spitzer,Physical Processes in the Interstellar Medium
(Wiley-Interscience, New York, 1978).
[5] K. Yamauchi and Y. Ohsawa, Phys. Plasmas14, 053110
(2007).
[6] Y. Takeyama, S.-I. Nakayama and Y. Ohsawa, Phys. Plas-mas18, 092307 (2011).
[7] J.B. McBride and E. Ott, Phys. Lett. A39, 363 (1972). [8] J.B. McBride, E. Ott, J.P. Boris and J.H. Orens, Phys.
Flu-ids15, 2367 (1972).