Acoustic power flow into the ear
and the auditory microstructure
A thesis submitted for the degree o f Doctor o f Philosophy
o f the
University o f London
ProQuest Number: U642881
All rights reserved
INFORMATION TO ALL USERS
The quality of this reproduction is dependent upon the quality of the copy submitted.
In the unlikely event that the author did not send a complete manuscript and there are missing pages, these will be noted. Also, if material had to be removed,
a note will indicate the deletion.
uest.
ProQuest U642881
Published by ProQuest LLC(2016). Copyright of the Dissertation is held by the Author.
All rights reserved.
This work is protected against unauthorized copying under Title 17, United States Code. Microform Edition © ProQuest LLC.
ProQuest LLC
789 East Eisenhower Parkway P.O. Box 1346
Abstract
An experimental technique to determine the acoustic power absorbed by the human ear at absolute threshold is described and applied to data recorded in adult subjects. A previously published method o f electroacoustic probe calibration in terms o f equivalent Thevenin source parameters is substantially ameliorated.
Careful and detailed measurements o f continuous tonal aural sound pressure (CTASP) are presented. Ear canal input impedance, reflectance and absolute power flow constituents are derived from CTASP data.
Auditory microstructure, characterised by spectral periodicity, is observed and validated in CTASP, impedance, reflectance and power flow parameters at a 20 dB SPL stimulus level, but undetectable at 60 dB SPL. Periodicity in the ear canal acoustic parameters elicited at low stimulus levels is found to be commensurate with absolute threshold microstructure.
An elementary analogue network model o f the peripheral auditory system is formulated, enabling cochlear input impedance and reflectance to be inferred from ear canal acoustic parameters. At a 20 dB SPL stimulus level a non-zero cochlear reflectance is inferred, implying that energy propagates basally, as well as, apically. Microstructure amplitude in cochlear input impedance is shown to be 4 dB greater than that in ear canal input impedance, a consequence o f decoupling o f the probe from the tympanic membrane.
A proportionality between transmittance and auditory sensitivity exists, implying that the ear couples more efficiently to the sound source, and consequently extracts proportionally more power, at peaks in sensitivity. However, the measured change in coupling is inadequate to wholly explain threshold microstructure. An explanation is offered by applying empirical data to a phenomenological model o f power flow within the peripheral auditory system. It is argued that threshold microstructure arises predominately from a phasic interaction o f the basalward and apical travelling waves effectively modifying the spatial distribution o f energy within the cochlea.
Acknowledgements
I would like to thank Prof. David Kemp and Dr. David Brass for their supervision and support throughout this project. Thanks also to the experimental subjects for their time and patience.
A special thanks go to Gail, Mum and Dad and Jon for their encouragement over the past years.
Also, big thanks go to Jenny Hill, Katherine Denman-Johnson, Andrew Simpson and Siobhan Ryan for lunch-breaks.
This work was supported by the Medical Research Council. The auditory biophysics (ILO) fund provided additional financial support.
Table of contents
1.0 Introduction 11
1.1 Anatomy and function o f the ear 11
1.2 Specification o f the peripheral auditory system 14
2.0 Literature Review 17
2.1 Ripples in the audiogram 17
2.2 Microstructure in equal loudness data 19
2.3 Auditory microstructure observable in the ear canal 20
2.4 Periodicity in auditory micro structure 23
2.5 Coincidence in frequency location o f auditory microstructure extrema 25
2.6 Physical basis for auditory microstructure 27
2.7 The nature o f wave motion in the cochlea 28
2.8 Wave reflection model o f auditory microstructure 29
2.9 The active cochlea 31
2.10 Modification o f cochlear input impedance due to the basal travelling
wave 33
2.11 Method to measure ear canal input impedance 35
2.12 Method to estimate Thevenin parameters 36
2.13 Ear canal acoustic measurements 3 8
2.14 Summary 39
2.15 Scope o f thesis 40
2.16 Outline o f thesis 41
3.0 Probe assembly calibration: Theory 43
3.1 Formalism o f the least mean squares solution o f an overdetermined
set o f system equations 43
3.2 Definition o f an over-determined system 43
3.3 Matrix representation o f overdetermined system equations 44
3.4 Principle o f least mean squares 45
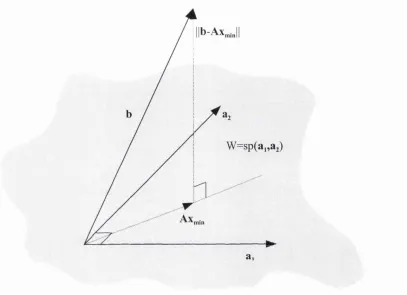
3.5 Graphical construction approach to method o f least mean squares 45
3.6 Variance and Standard errors 47
3.7 Minimisation o f error function 49
4.0 Probe assembly calibration: Methods 51
4.1 Probe construction 51
4.2 Choice o f reference loads 51
4.3 Mathematical modelling o f acoustic loads 53
4.4 Construction o f reference loads 56
4.5 Stimulus generation and data acquisition 56
4.6 Propagating and evanescent modes 57
4.7 The effect o f the evanescent wave upon acoustic measurements 61
5.0: Probe assembly calibration: Results 62
5.1 Sound pressure measurements 62
5.2 Measuring microphone frequency response 65
5.3 Electroacoustic probe Thevenin parameters 67
5.4 Errors in calibration 70
5.5 Varying sound source constructions 74
5.6 Making input impedance measurements 77
5.7 Propagation o f errors 77
5.8 Measured input impedance o f hard walled rigidly terminated tube 78 5.9 Measured input impedance o f Briiel & Kjær ear simulator 81
5.10 Measured input impedance o f adult ears 83
6.0: Ear canal acoustic measurements 87
6.1 Introduction 87
6.2 Nature and influence o f Spontaneous OAEs 87
6.3 Subjects 89
6.4 Influence o f the probe upon SOAEs 91
6.5 Ear canal acoustic measurement system 93
6.6 Continuous tonal aural data 96
6.7 CTASP spectral periodicity 101
6.8 Measurements o f CTASP at different stimulus levels 106
6.9 Network analysis o f CTASP data 108
6.10 Nature of the subtracted sound pressure 112
6.11 Sources o f error in the subtracted sound pressure 116
6.12 Summary 117
7.0 Derived ear canal parameters 118
7.1 Introduction 118
7.2 Definition o f network parameters 118
7.3 Definition o f scattering parameters for one port networks as applied to
ear canal acoustics 119
7.4 Power flow in a one port network as applied to ear canal acoustics 120 7.5 Power flow constituents: an alternative scheme 121
7.6 Ear canal input impedance: empirical data 122
7.7 Bar canal reflectance 127
7.8 Power flow in the ear canal 129
7.9 Summary 131
8.0 Cochlear parameters inferred from ear canal measurements 132
8.1 Introduction 132
8.2 Phenomenological modelling approach: 2-Port network theory 133
8.3 Deconstructing the peripheral auditory system 137
8.3.1 Representation o f the acoustic response o f electroacoustic
probe 138
8.3.2 Acoustic description o f the occluded ear canal 138 8.3.3 Modelling the mechanics o f the middle ear complex 139
8.3.4 Range o f validity 142
8.4 Cochlear input impedance inferred from ear canal input impedance 144 8.5 Physical basis o f the origin o f microstructure 146 8.5.1 Theoretical treatment o f cochlear input impedance 147
8.5.2 High level linear regime 148
8.5.3 Low level linear regime: Role o f cochlear pressure reflectance 152 8.5.4 Nature o f cochlear pressure reflectance 153 8.6 Two-port network model incorporating scattering parameters 156
8.7 Inferred cochlear pressure reflectance 159
8.8 Modelling stimulus frequency otoacoustic emissions 163 8.9 Utility o f group delay applied to ear canal acoustic measures 166
8.10 Summary 169
9.0 Microstructure in auditory threshold 170
9.1 Introduction 170
9.2 Methods for the determination o f absolute auditory threshold 171
9.3 Experimental method 174
9.4 Experimental Results 176
9.5 Role o f SOAE in the calculation o f impedance 179
9.6 Quantifying absolute threshold o f sensory systems 180 9.7 Ear canal power flow under an iso-sensation drive condition 182 9.8 Phenomenological model o f power flow in the peripheral auditory
system 184
9.9 Illustration o f standing waves within the cochlea 187
9.9.1 Bi-directional energy flow model 187
9.10 Summary 191
10.0 Conclusions and further research 192
10.1 Conclusions 192
10.2 Further research 194
11.0 References 196
12.0 Appendix; A note on software 209
List of figures
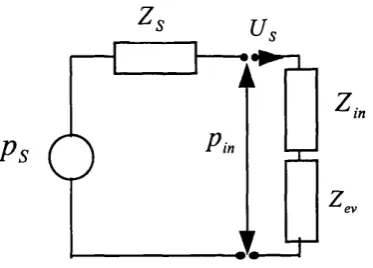
Figure 2.1 : Analogue o f an electroacoustic probe coupled to an acoustic load 36
Figure 3.1: Schematic construction illustrating the relationship between the 46 vectors under the least squares condition
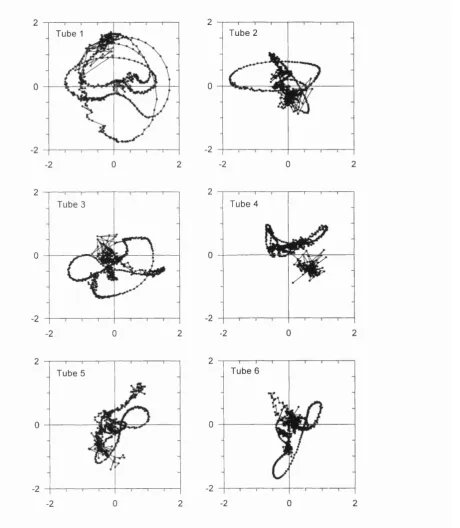
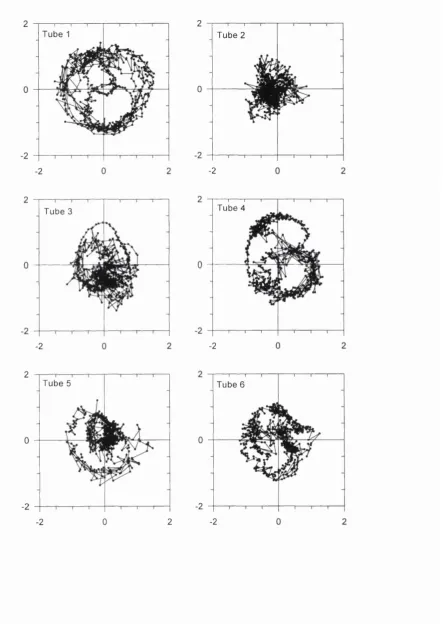
Figure 4.1 : Input impedance o f each tube in the calibration tube set. The 55 parameter in each panel refers to the tube listed in Table 4.1
Figure 4.2: Network analogue illustrating the effect o f the additional 60 evanescent term
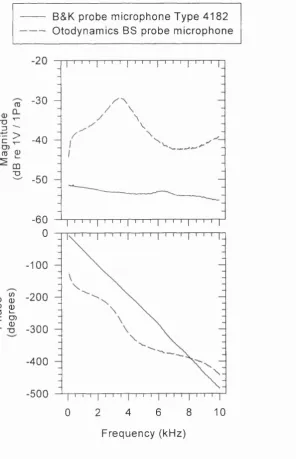
Figure 5.1: Schematic o f the stimulus delivery and sound pressure 62 measurement system used for Thevenin electroacoustic probe calibration Figure 5.2: Difference in sampling at the probe tip compared to the terminating disc 64 Figure 5.3: Frequency response o f two microphones under white noise ffee-field 66
conditions
Figure 5.4: Thevenin parameters o f the Otodynamics BS probe against frequency 68 Figure 5.5: Standardised residual errors pre-minimisation 72 Figure 5.6: Standardised residual errors post-minimisation 73 Figure 5.7: Effect o f acoustic resistor upon Thevenin parameters 75 Figure 5.8: Effect o f length o f port tubing upon Thevenin parameters 76 Figure 5.9: Measured input impedance o f a cylindrical hard walled tube 79 Figure 5.10: Measured input impedance o f Briiel and Kjær ear stimulator Type 4157 81
Figure 5.11: Measured input impedance o f adult ear 83
Figure 5.12: Effect o f the occluded ear canal length upon the ear input impedance 85
Figure 6.1 : Narrowband spectral analysis o f ear canal sound pressure against 90 frequency for each subject
Figure 6.2: Schematic o f the experimental set-up 94
Figure 6.3: Sound pressure measured in the occluded ear canal, [co, , 96 o f subject SS at two stimulus levels
Figure 6.4: Sound pressure measured in the Brüel and Kjær ear simulator 98 Type 4157, at two stimulus levels
Figure 6.5: CTASP data for four subjects 100
Figure 6.6: Quantitative analysis o f CTASP microstructure periodicity 102
Figure 6.7: CTASP data at various stimulus levels 107
Figure 6.8: Block diagram relating network parameters applicable for the analysis 110 o f CTASP data
Figure 6.9: Transfer function derived from CTASP data shown in figure 6.3 111 Figure 6.10: Vector representation, from Kemp and Chum (1980), o f , A] 114
at two stimulus levels
Figure 6.11: The subtracted sound pressure, [co, ], for two female subjects 115
Figure 7.1 : Calculated ear canal acoustic input impedance in the plane o f the 122 probe assembly tip, , at two stimulus levels
Figure 7.2: Normalised ear canal resistance and reactance against frequency 125 at two stimulus levels
Figure 7.3: Ear canal reflectance against frequency at two stimulus levels 127 Figure 7.4: Bar canal power constituents, incident, reflected and absorbed, 129
at two stimulus levels
Figure 8.1 : a) Representation o f a generic linear n-ported network, ’ . 134 b) When only two pairs o f independent terminals, or ports, can
be identified the formalism reduces to a 2-port network, *
Figure 8.2: Deconstructing the peripheral auditory system 137 Figure 8.3: Network topology of Zwislocki analogue network o f middle ear 141
less the stapes/cochlear complex branch, relating each block on the basis o f functional anatomy
Figure 8.4: Cochlear input impedance inferred from ear canal input impedance 145 at two stimulus levels
Figure 8.5: Model cochlear and ear canal input impedance as a function o f 154 cochlear pressure reflectance
Figure 8.6: Inferred cochlear pressure reflectance from derived ear canal 160 pressure reflectance
Figure 8.7: Simulated stimulus frequency otoacoustic emission as a function 165 o f cochlear pressure reflectance
Figure 8.8: Network transfer function for a second order bandstop filter 167
Figure 9.1 : Example o f subject’s response during an adaptive up-down procedure 174 Figure 9.2: Measurements o f pure tone absolute auditory threshold microstructure 176
Figure 9.3 : Iso-sensation ear canal power flow 183
Figure 9.4: Phenomenological model o f power flow in the peripheral auditory 185 system
Figure 9.5: Section o f cochlear duct, o f length Ax, modelled as a one dimensional
linear transmission line 188
Figure 9.6: Illustration o f standing waves within the cochlea 190
List of tables
Table 4.1 : Dimensions o f tubes used in calibration routine 52 Table 4.2: Thermodynamic constants used in the modelling o f acoustic loads 54 Table 4.3: Table o f inflection points o f the m!’' order Bessel function o f the first kind 58
Table 4.4: 1/e distances for circular tube, a=4.5 mm 59
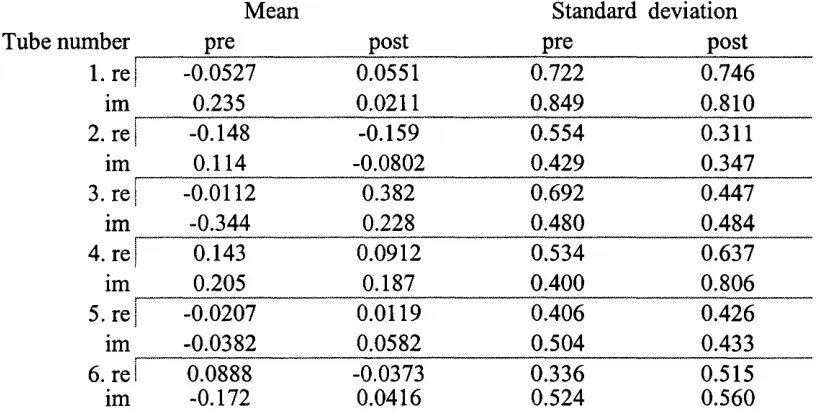
Table 5.1: Quantitative analysis o f standardised residual errors 74
Table 7.1 : Thermodynamic constants appropriate for ear canal acoustics 125
Table 8.1: Parameters o f the average, standardised, occluded ear canal 139 (ANSI S3.25-1979)
Chapter 1 : Introduction
Chapter 1 : Introduction
1.1 Anatomy and function of the ear
The earl jg a transducer: sound^ energy approaching the pinna is transformed and encoded into electrical impulses on the auditory nerve. Therefore, not only is the ear a transducer in the physical domain, but a sensory organ in a biological sense. The human ear is made up o f three components, the outer, middle and inner ears. The mode o f energy transfer provides a useful method for the demarcation between the three components. Anatomical and functional descriptions, with increasing levels o f detail, can be found in Kinsler et al (1982), Pickles (1988) and de Boer (1980, 1984 and 1991).
A proportion o f the sound impinging upon the pinna o f the outer ear is absorbed, providing the acoustic input to the peripheral auditory system. Sound propagates, via the ear canal, to its oblique medial termination known as the tympanic membrane (TM), inducing motion o f the TM, thereby transforming sound energy to mechanical energy.
The middle ear occupies an air filled irregular volume, the tympanic cavity (TC). The TC is fenestrated by three windows; the TM, oval window (OW) and round window (RW). The Eustachian tube couples the middle ear with the pharynx and regulates the static pressure within the tympanic cavity, such that under normal function the net static pressure across the TM is zero. The tympanic cavity is traversed by a chain o f three mobile bones, known as the ossicles; the malleus whose vertical process, the manubrium, is directly coupled to the TM, the incus and the stapes. With the incus located between the malleus and stapes, the trio o f ossicles provide a mechanical linkage and transmission path between the TM and OW.
' Throughout this thesis, unless where specified, reference to the ear is taken to m ean only those
structures involved in the auditory process in man are considered. Components o f the vestibular system
are ignored. Therefore, the ear and the perip heral auditory system are synonym ous.
2 Reference to sou nd is used with caution due to semantic ambiguity; does sound refer to a physical
quantity or a psychological phenomenon? In this study, so und refers to 1) a w ave phenom enon resulting
from oscillations o f pressure, particle velocity, stress etc., w hich 2) evokes an auditory sensation. It is
noted that not all phenomena conforming to 1) lead to 2), for exam ple, ultrasound. Additionally, sound
provides a distinction between static, d.c., pressure and fluctuating pressure.
Chapter 1 : Introduction
An interior view from the stapes reveals the fluid filled inner ear, and specifically the bulbous entrance chamber known as the vestibule. The inner ear, embedded deep in the temporal bone, incorporates the functional, sensory units, or organs, for both audition and the vestibular system. Located within the inner ear is the cochlea, a logarithmic spiral shaped organ. The cochlea displays a high degree o f cellular spatial order, which is able to detect minute changes in pressure. Spiralling along the cochlea are three canals, termed scalae; the scala vestibuli (SV) which is continuous with the vestibule, the scala tympani (ST) and scala media (SM). The Reissner’s membrane separates the SV from SM, while it is important to state for reasons o f cellular electrophysiology outlined below, that the boundary between the SM and ST is the reticular lamina (RL) ^ (Dallos, 1992). Running along the length o f the cochlea is the basilar membrane (BM), a rugose, fibrous, corrugated membrane. Attached to one surface o f the spiralling BM is the organ o f Corti, a highly specialised cellular matrix which consists o f sensory hair cells, numbering approximately 15,000 per cochlea and a number o f differentiated supporting cells. The organ o f Corti together with the BM, RL, fluid chamber in the tunnel o f Corti and a gelatinous flap, known as the tectorial membrane, make up the cochlear partition (CP).
Vibration o f the OW effectively launches a water wave in the cochlear fluid o f the scala vestibuli, resulting in a hydromechanical wave which propagates apically. The BM exhibits a highly graded mechanical characteristic which acts in similar fashion to a nonuniform tapering transmission line. Such a system supports a travelling wave, whose speed and wavelength under harmonic stimulation decreases as the wave travels towards a point along the BM which is preferential for that frequency, known as the characteristic place. Energy at different frequencies is concentrated onto different characteristic places, a property referred to as tonotopicity; displacements o f the cochlear partition at the apex are maximal during low frequency harmonic vibration at the OW, while high frequencies maximally displace the cochlear partition more towards the base. In essence, the cochlea acts as an acoustic prism.
^ It is often stated, incorrectly, that the basilar membrane separates the SM and ST (Pickles, 1988; Gulick
et al, 1989).
Chapter 1 : Introduction
The sensory cells are categorised into two groups, inner hair cells (IHC) and outer hair cells (OHC), whose membranes are semipermeable, i.e., only particular ions can penetrate the membrane. In common with neurones, the intracellular potential is negative with respect to the immediate environment. On the upper surface o f both the IHC and OHC is an array o f narrow cylindrical structures referred to as stereocilia. Significantly, the stereocilia are bathed in an endolymphatic fluid while the base o f the cell is swamped in perilymph, with the reticular lamina forming the ionic barrier between the two fluids. Endolymph and perilymph, possess distinct ionic composition and therefore have different electrical properties resulting in a net electrical potential across the membrane o f the hair cells.
Displacement o f the IHC stereocilia results in a change in intracellular potential. However, the magnitude o f the change is maximal to radial displacements, i.e., movements perpendicular to the direction o f the travelling wave. Displacement towards the lateral side, towards the stria vascularis, depolarises the cell, while movement in the opposite direction, towards the spiral limbus, leads to hyperpolarisation. This observation provides the basis o f the idea that lateral displacement o f the stereocilia enable ion (K^) flow into the cell which depolarises the cell, hence the usage o f the term ‘ion channels’ to describe the mechanism. At the base o f the cell are voltage dependent calcium channels which govern the release o f neurotransmitters that act onto the dendrites o f the afferent neurones, generating an action potential in the fibres that make up the auditory nerve.
Chapter 1 ; Introduction
1.2 Specification of the peripheral auditory system
Sounds that are significant to humans vary in amplitude, phase and frequency with time. For instance, a speech waveform is a continuously spectrally changing acoustic signal. From a design perspective, the ear must be able to initiate an array o f neural spikes in the fibres, that make up the auditory nerve, in a spatial and temporal fashion, in order to represent the time varying stimulus. The temporal and spectral characteristics o f a signal are reciprocally related. At one extreme, an impulse o f infinitesimally short duration is capable o f delivering energy at an infinite number o f frequencies. In contrast at the other extreme, energy at a single frequency, or spectral component, requires a sinusoidal oscillation o f infinitely long duration. Speech and other naturally occurring sounds lie on the continuum somewhere between these extrema.
In general, the constraints governing the analysis o f signals reflect this reciprocal relationship, since high frequency resolution is achieved by sampling the signal for a long duration, with narrow filters. Conversely, higher temporal resolution is achieved with broader filters. It has been stated that the ear has evolved to find a near optimal solution to these conflicting requirements (Dallos, 1992).
Quantifying auditory temporal resolution, Plomp (1964) found that the gap threshold, the shortest duration o f silence that was perceptible between two noise bursts, was typically 2-3 ms.
To describe the frequency analysis capabilities o f the ear, or more properly the. whole auditory system, reference is made to two auditory measures; frequency resolution and frequency discrimination.
The ability to resolve a signal in the presence o f noise relates to the measure o f frequency resolution, such that the subject has to filter out noise in order to detect the signal. The width, or resolution o f the filter determines the resolving power and the quality o f frequency analysis o f the auditory system. For normal hearing humans, the 3
Chapter 1 : Introduction
dB bandwidths are typically 10 to 15 %, equivalent to a whole musical tone^ (Moore and Glasberg, 1983).
Frequency discrimination, or frequency difference limen, is defined as the minimum difference in frequency that is perceptible between two tones presented one after another. Under this paradigm, a frequency change o f 0.2 to 0.3%, equivalent to l/25th o f a semitone, can be discriminated by normal hearing subjects.
There is a numerical disparity in the parameters yielded for each measure, reflecting two different paradigms in the presentation o f the stimuli. Frequency resolution reflects the spectral capabilities only o f the auditory system and is a measure which is used in many physical fields, whereas, the frequency difference limen is a measure o f the ability to discriminate between two neural patterns at different times.
The range between the lowest and highest frequency o f pure tones which elicit a sensation o f pitch defines the auditory frequency range. The frequency range o f the human ear from 0.02 to 20 kHz ^ is relatively considerable, spanning 10 octaves. In contrast, the eye operates over only 1 octave and the olfactory system approximately 3.5 octaves (Turin, 1997). Encoding o f acoustic waves with air-borne wavelengths between 17.5 m to 1.75 cm takes place in the human cochlea, which has an uncoiled length o f 3 cm. Therefore, sound waves that are perceptible to humans have wavelengths comparable to dimensions o f everyday objects in the environment, which is significant due to diffraction effects.
The lowest stimulus level at which there is an auditory sensation is described by the threshold o f hearing. The greatest sensitivity, that is the lowest threshold o f hearing, is
^ For the even tempered musical scale the ratio o f two frequencies separated by a sem itone is defined as 2'^'^. This equates to a percent change o f 5.9 %.
^ From studies by B ékésy (1960), it was demonstrated that sinusoidal stimuli o f frequencies below 20 Hz were perceptible. However, at 5 Hz threshold was roughly 120 dB SPL, leading to the possibility o f the generation o f aural harmonics w hich may cue perception. Additionally, it was observed that at such frequencies and intensities, the stimulus did not elicit a pitch, but rather a percept akin to a tactile sensation.
Chapter 1 : Introduction
in the mid, 1-2 kHz, frequency range^, corresponding to a power incident upon the TM o f 50 aW. At the threshold o f hearing, the corresponding displacement amplitudes o f the structures in the auditory periphery are subatomic, fractions o f an angstrom (10 '° m). Thermal noise arising from the displacements o f the cilia o f hair cells is estimated to be o f the same order o f magnitude, leading to the conclusion that the sensitivity o f the auditory system is not limited by a design compromise, but by the physical limits imposed by Nature.
The auditory system exhibits a relatively large dynamic range, defined as, the ratio o f the stimulus level at which the extraction o f useful information ceases^, to the threshold o f hearing. The power incident upon the TM corresponding to the upper limit is approximately 50 pW , that is, o f the order o f one million million times greater (120 dB) than the minimum power required to elicit an auditory sensation.
^ A s a note o f interest, the 2 kHz octave band corresponds to the frequency range that conveys the m ost information in speech.
^ Im plied in the use o f the term ‘extraction o f useful information’ is the notion that sounds impinging upon the ear are ultimately analysed in terms o f the information w hich is carried in the signal.
Chapter 2: Literature review
Chapter 2: Literature review
2.1 Ripples in the audiogram
Elliot (1958) described a ripple effect in the pure tone audiogram o f normal unimpaired human subjects. Absolute thresholds o f the right ears o f two subjects were presented, although the experimental methodology was not described except that the audiogram was measured from 0.4 to 3 kHz in 10 Hz steps. The resulting audiograms showed a regular and repeatable characteristic pattern o f undulations with frequency, exhibiting threshold variations o f up to 10 dB. Elliot reported that the ripple o f the left ear differed from that o f the right, implying that the pattern is unique to the ear under test. Additionally, the ripple pattern in the audiogram o f one subject did not match, either in frequency location o f extrema or ratio o f maxima to minima, the audiogram o f a second subject. The ripple pattern present in the audiogram shows no interaural or intersubject correlation. Elliot stated that the pattern o f extrema was stable, reproducible and repeatable over a time course o f at least two months. Due to the repeatability, the ripple must be interpreted as a signal reflecting the response o f a physical, physiological or psychological mechanism, rather than noise, or experimental error, o f an uncorrelated random characteristic.
Van den Brink (1970), Thomas (1975) and Kemp and Martin (1976) report similar findings o f an undulation in the pure tone audiogram. Van den Brink (1970), while principally investigating binaural diplacusis\ found large fluctuations in the audiogram for small changes in signal frequency. Thomas (1975) states that the difference in intensity between adjacent peaks and troughs is typically 12 dB. Additionally, the pitch o f the stimulus remained constant as the frequency was swept between peaks, but jum ped in a quantal fashion when the frequency was swept across a peak. Kemp and Martin (1976) predicted an active mechanism in order to account for the high Q-factors o f the ripples in the audiogram.
^ A n auditory phenom enon in which a fixed frequency stimulus presented binaurally elicits different pitches between left and right ears.
Chapter 2; Literature review
W ilson (1980b) observed that threshold ripple was dependent upon intracochlear static pressure, a factor which affects the impedance presented at the stapes footplate. Changes in hydrostatic pressure, assumed to induce changes in intracochlear static pressure, were achieved by tilting the body to another posture. When the body was inverted the position o f the peaks and troughs reversed, w hile tilting the body at one particular angle obliterated the ripple.
Long (1984) studied both absolute and masked thresholds and demonstrated that the ripple flattens out with increasing masker level. For simultaneous masking with broadband noise no undulation was seen when masked thresholds were above 40 to 50 dB SPL re 20 pPa 2. Additionally, it was shown that the pattern o f undulation in the
threshold was invariable over a period o f 18 months.
Cohen (1982) implemented a rigid, fixed choice psychoacoustic paradigm in a detailed study o f auditory threshold across a narrow frequency sweep. However, it was concluded that neither the frequency spacing between neighbouring maxima and minima, nor the ratio o f maxima to minima exhibited an observable regular pattern. Such a finding suggests that the auditory threshold ripple is not universal, but rather is present in a proportion o f subjects.
Here, auditory microstructure is defined as a characteristic o f a hearing phenomenon which exhibits a reproducible locally quasiperiodic series o f maxima and minima with frequency^, manifesting a spectral periodicity equal to the frequency taken to complete one cycle, and spectral amplitude determined as the ratio o f maximum to minimum within one cycle. The ripple in the audiogram is therefore an example o f auditory microstructure.
^ From now on w e define dB SPL as the sound pressure level in decibels referenced to 20 pPa rms. ^ A note on nomenclature. Fine structure, rippling effect, undulation and irregularities are, w ithin this report, taken to be synonym ous with microstructure.
Chapter 2; Literature review
2.2 Microstructure in equal loudness data
Kemp (1979a) conducted a detailed study o f auditory microstructure. As well as pure tone absolute threshold, suprathreshold psychoacoustic measurements such as, equal loudness experiments and frequency discrimination tasks were undertaken. During equal loudness experiments, the subject was instructed to vary the level o f a tone at one frequency so that it matched the loudness o f a fixed level tone at another, reference frequency. The procedure was repeated for tones o f frequencies around the reference tone. The resulting curve o f the subject's level responses give an equal loudness contour. At low levels, i.e., reference levels o f 5 dB SPL, the equal loudness contour exhibited pronounced microstructure. As the level o f the reference tone was increased, in steps o f 5 dB SPL, the ratio o f maxima to minima amplitude decreased. At 40 dB SPL the equal loudness contour exhibited no undulation.
Due to the lack o f proportionality between the amplitude o f microstructure and applied sound pressure level, the data clearly demonstrates a compressive nonlinear^ auditory
^ D iscussion on the definition o f linearity, when applied to system s, is facilitated with reference to a
Volterra series (Sim on and Tomlinson, 1984), where the output, yftj, is related to the input, x{tj, by a
Volterra series,
00 00 00
y ( t ) = hQ+ \ h ^ ( x ) x ( t - x ) d x + \ \ h2(x X2) x ( t - x J x ( t - X2) dx ^ 6x2 +
—00 -00-00
where - are the Volterra kernels. A linear system is defined as a special case, in w hich the
Volterra series is truncated after the first-order kernel, A, . The system transfer function, H((ù), is then
related to the system unit impulse response, h(t), by a single Fourier transform operation. Inclusion o f
the higher order terms o f the series reflect nonlinearity in the system response. U nderlying the principle
o f linearity is that o f superposition; for a given linear system, if the output to an input x^(t) is y ^ ( t) and
the output to X2( t ) is ^2( V , th^n the output to a^x^(t) + a2X2( t ) is a^yi(t) + a2y2 ( 0 where a, and « 2
are arbitrary constants (Ruston and Bordogna, 1966). That is, the output to tw o inputs presented
sim ultaneously, is simply the algebraic sum o f the outputs when presented separately. Such a statement is practical since it states that a linear system can equally be characterised by analysing its response to either sinusoids or impulses, the two simplest but most distinct signals. H owever, there exists a plethora o f nomenclature applied to the definition o f linearity, w hich m ay be less rigorous as the definition above,
but are more applicable to when the input is sinusoidal. Further definitions separate the previous
definition into one o f (restricted) superposition and hom ogeneity, often referred to as proportionality (K uo, 1962). The restricted superposition drops the reference to the two arbitrary constants a, and a ; , and is more properly referred to as additivity. The level dependence is then governed b y the principle o f
hom ogeneity; if the input level is changed, by a factor k, w hich gives rise to a corresponding change, k, in
the output level, then homogeneity is preserved. Often the principle o f additivity, rather than applied to signals o f arbitrary complexity, is restricted to two sinusoidal inputs o f different frequencies (M oore, 1986); such that, the response o f a system to two frequencies presented sim ultaneously is equal to the sum o f the responses when the frequencies are presented separately. For m echanical system s, linearity im plies that vibration is harmonic if the return force is directly proportional to displacem ent (Main, 1994). I f the dependency is different then the system is nonlinear and supports vibrations w hich are
Chapter 2: Literature review
phenomenon which is most prominent at low stimulus levels and is obliterated at moderate to high levels.
The data discussed above support the view conjectured by Kemp (1979a) that auditory parameters such as pure tone threshold, loudness and pitch are not smooth, slowly varying functions o f frequency, but display a microstructure which, in the case o f absolute thresholds, is not observed in conventional audiometry.
The microstructure observable in the pure tone audiogram, masked thresholds and equal loudness data required experimental paradigms that are psychoacoustic, i.e., required a subjective action in response to acoustical stimulation. This leads to the question, “is microstructure observable in a purely physical measure o f an auditoiy phenomenon?”.
2.3 Auditory microstructure observable in the ear canal
Microstructure is observable in low level sweeps across frequency o f raw ear canal sound pressure measurements, (Kemp, 1979a; Kemp and Chum, 1980; Wilson, 1980ab; Zwicker and Schloth, 1984). The experimental method reported in Zwicker and Schloth (1984) required measurement o f the vector sound pressure in the ear canal during continuous tonal stimulation from a high impedance source under constant electrical drive conditions. The stimulus was swept slowly in frequency, between 1350 and 1550 Hz, and at various stimulus levels; 0 to 35 dB SL ^ in 5 dB steps. The greatest fluctuation in both magnitude and phase can be seen at 0 dB SL with the spectral ripple abolished at a stimulus level o f 60 dB SL.
It was observed that the phase curves at the lowest stimulus levels are identical, as well as an invariance in the shape o f the magnitude curves, but which are separated by an interval corresponding to the stimulus level increment, a homogeneity which befits a
anharmonic. However, the response o f the transverse BM velocity or displacem ent to harmonic
stimulation is not ideally linear but resembles to a certain degree, as if it exhibited, a linear characteristic. Hence the use o f the term quasilinear, defined as the response to a sinusoid is largely sinusoidal, when considering cochlear m echanics (Kanis, 1995; Brass and Kemp, 1993).
^ dB SL is defined as the intensity in decibels above threshold o f audibility. W ith reference to section 2.1 and specifically discussion on auditory microstructure, sensation level appears to be a rather approximate and inappropriate measure due to the often 12 dB difference between threshold m axim a to minima.
Chapter 2: Literature review
linear system. The data at high stimulus levels indicate, due to the deviation from homogeneity, the presence o f a nonlinearity similar to that shown in equal loudness data (Kemp, 1979a).
Such sound pressure measurements are occasionally referred to as stimulus frequency otoacoustic emissions (SFOAEs)^ (Zwicker, 1979 and 1990). This interpretation can appear confusing since SFOAEs usually describe a signal that is purely o f cochlear origin (Brass and Kemp, 1991).
Continuous tonal sound pressures consist o f two signals; one signal that reflects the gross linear response o f the auditory periphery^, and a second cochlear originating signal that is level dependent. A method to extract the cochlear originating signal was proposed by Kemp (1979a) by using a complex pressure, i.e., vector, subtraction method, which was developed in Kemp and Chum (1980) and utilised in Zwicker and Schloth (1984) and Guinan (1990). A pressure response at 70 dB SPL, which is sufficiently high so that the additional level dependent signal is negligible, is, with suitable scaling, subtracted from the low level response. The subtracted, or residual, signal was termed the SFOAE (Kemp and Chum, 1980).
An alternative method to extract the SFOAE by simultaneously generating a continuous stimulus tone and a pulsed probe tone o f the same frequency was described in Kemp and Souter (1988) and developed in Brass and Kemp (1991). By applying the probe tone at appropriate positions in the cycle o f the stimulus tone a cancellation o f both the probe and stimulus was achieved to reveal a nonlinear residual at the stimulus frequency. The residual is not strictly the SFOAE, but rather reflects the suppression by the probe tone o f the stimulus tone evoked SFOAE. The, nontrivial, relationship between the residual and SFOAE is given in Brass and Kemp (1991). The residual exhibits a compressive nonlinearity indicative o f an OAE (Harris and Probst, 1990).
6 Otoacoustic em issions (OAEs) are ear canal acoustic m anifestations o f cochlear biom echanics. OAEs are conventionally classified in terms o f the stimulus that elicits the response. Under no stimulation the category o f spontaneous OAEs (SO AEs) is used. W hen a stimulus is applied the OAE is evoked, hence EOAE. EOAEs are further distinguished by the stimulus; distortion product (DPOAE), transient, or click, (TEOAEs) and stimulus frequency (SFOAEs).
^ Such a response recorded in the ear canal is a function o f the m echanics o f the ear canal, m iddle ear and cochlea.
Chapter 2: Literature review
Caution in the comparison o f SFOAEs derived from the two paradigms, vector subtraction and probe stimulus cancellation, must be exercised. SFOAEs derived from the vector subtraction method are not exactly equivalent to SFOAEs detected under the probe stimulus cancellation paradigm. This is because the former carries information o f the nonlinearity between the low to high stimuli levels, often separated by 50 dB, whereas the latter method elicits SFOAEs under stimuli that are o f comparable intensities.
Due to the ‘fuzziness’ o f terminology, we refer to the raw ear canal pressure measurements as continuous tonal aural sound pressures (CTASP), whereas reference to SFOAEs will, without clarification, imply a subtraction or cancellation procedure.
A rippling pattern in CTASP across frequency was present at levels down to -40 dB SPL (Wilson, 1980a). The existence o f such an interference pattern at subthreshold stimuli levels, demonstrates that the spectral ripple phenomenon is independent o f processes in, or a function of, the neural pathway, such as reflex loops, since the response is present without any nerve spike generation.
When two sinusoidal stimuli o f different frequencies are applied to the ear simultaneously a number o f spectral components recorded in the ear canal at frequencies not present in, but algebraically related to, the stimuli are present. The existence o f such additional spectral components, referred to as distortion products (harmonic, difference and combinational tones), implies that the ear is a nonlinear forced vibrator.
Microstructure is also seen in measurements o f distortion product otoacoustic emissions (DPOAE) (He and Schmiedt, 1993). In order to elicit a DPOAE, two tones, referred to as primaries, o f frequency f j and (/^ is usually taken to be greater than/ y ) , and level I,
and I2, constitute the stimulus presented in the ear canal. He and Schmiedt (1993),
recorded the lower third order, cubic, distortion product, corresponding to a signal at a frequency o f 2/y-/^. Primary levels were equal and varied from 45 to 65 dB SPL in 2.5 dB steps. Primary frequencies were changed in steps o f 1/32 octave, while keeping the f / f i ratio constant at 1.2. Peak to valley amplitude ratios o f up to 20 dB SPL are shown.
Chapter 2: Literature review
However, the peakiness, or degree, o f microstructure in the DPOAE data does not manifest a level dependence with a diminishing peak to valley amplitude ratio with increasing primary level.
2.4 Periodicity in auditory microstructure
W hen displayed on a logarithmic frequency scale, microstructure observed in auditory measurements show neighbouring maxima and minima that are, roughly, equally spaced (Zwicker, 1990; Zweig and Shera, 1995; He and Schmiedt, 1993). Such a qualitative observation evinces an approximate spectral periodicity^ in the microstructure.
Quantitatively, oscillatory components that are constituent parts o f the undulating microstructure can be extracted either by plotting a simple histogram o f binned values o f the interpeak spacings resulting in a probability distribution, or by performing a Fourier transform. An underlying single periodicity in the microstructure will be manifest as a clearly defined peak in the histogram or amplitude plot o f the Fourier transform.
He and Schmiedt (1993), plotted a probability distribution o f the interpeak frequencies o f DPOAE microstructure, categorised in bins o f width 1/32"^* o f an octave, which was maximal at a bin corresponding to 3/32"*^ o f an octave.
Zweig and Shera (1995) performed a Fourier transform on CTASP data and report a distribution centred on a pronounced peak equal to a frequency spacing, /Sf/f, o f 1/15, equivalent to 1/10^^ o f an octave.
Schloth (1983) investigated the frequency spacing between spontaneous otoacoustic emissions (SOAE), i.e., nonevoked OAEs. The spectral analysis between 775 Hz and
^ In the follow ing discussion, spectral periodicity refers to a spectrum w hich w hen shifted along the abscissa a frequency (which is relative, rather than absolute, in this context) equal to a multiple integer o f the fundamental frequency, i.e., the reciprocal o f the period, superimposes onto the original spectrum. In other words, the autocorrelation function o f the spectrum has peaks at m ultiple integers o f the fundamental frequency only. The consequence o f shifting the spectrum along the frequency axis a small w hole number o f spectral periods resulting in approximately the original spectrum, reveals a ‘discrete spectral sym m etry’ (Zw eig and Shera, 1995).
Chapter 2: Literature review
3990 Hz, o f sound pressure recorded in the occluded ear canal manifested a series o f narrowband peaks, referred to as SOAEs. The frequency separation between neighbouring SOAEs, i.e., interpeak frequency, when displayed as a probability density against linear frequency histogram showed a bi-modal distribution between 70 Hz to
130 Hz.
In the language o f critical-band rate, commonly referred to as the z-scale (Zwicker and Terhardt, 1980), the periodicity in CTASP was found to be equivalent to approximately 0.4 Bark (Zwicker, 1990), with an interquartile range from 0.35 to 0.46 Bark. Interpeak frequency o f SOAEs when binned and represented as a probability density against Bark frequency histogram revealed a distinct peak located at 0.4 Bark (Dallmayr, 1985; Zwicker, 1989). Zweig and Shera (1995) produced a histogram o f counts using SOAE data from Talmadge et al (1992) which exhibited a similar characteristic value. Around 500 Hz, the interpeak distance is roughly 40 Hz, while at 3 kHz it is approximately 250 Hz. Zwicker (1990) found that the distribution o f the interpeak spacing between the threshold microstructure minima o f 8 subjects peaked at 0.4 Bark.
The Bark is an auditory unit derived from psychoacoustical experiments on the tuning characteristics o f the auditory system. Masking paradigms are undertaken to determine the width o f the auditory filter at a particular centre frequency. The width o f the filter, termed the critical bandwidth, is equivalent to one Bark. The tonotopic nature o f the response o f the cochlea, in which frequency is mapped spatially, warps the frequency, to a first approximation, in a logarithmic manner, with filter bandwidth approximately equal to one third o f an octave. The Bark relates to a constant length along the BM corresponding to 1.1 mm, therefore 0.4 Bark corresponds to length o f 0.44 mm along the BM. Plotting psychoacoustical data, such as threshold values derived from masking experiments, against the critical-band rate results in filter shapes which are invariant irrespective o f frequency, therefore normalising the frequency warping effect o f the auditory periphery.
The Bark unit is, itself, derived from psychoacoustical experiments, using moderate, around 50 dB SPL, stimulus levels. The critical bandwidth has been shown to be a fimction o f frequency, with narrower filters, implying improved frequency selectivity,
Chapter 2: Literature review
for lower stimulus levels. The use o f a psychoacoustic unit such as the Bark, derived at moderate stimulus levels, to quantify an attribute o f a purely physical measure recorded at stimulus levels close to threshold appears to be inappropriate. For this reason reference to the Bark will be limited.
The similarity in periodicity observed in auditory thresholds, suprathreshold psychoacoustic measurements, CTASP sweeps, DPOAEs and the regular frequency separation between consecutive peaks o f SOAEs suggest a common fundamental mechanism. Such a mechanism must exist in the peripheral auditory system since OAEs are preneural signals (Wilson, 1980a). The results reported above evince that auditory microstructure is a physical phenomenon observable in physical and psychoacoustical measurements which is intrinsic to, and the by-product of, the normal hearing process in the auditory periphery.
However, the regularity o f the microstructure, as noted thus far is not universal, but rather is present in only a proportion o f subjects (Wilson, 1980b). Shera and Zweig (1993) report data derived from CTASP measurements swept over frequency where an irregular, anomalous region is sandwiched between a regular, ordered microstructure.
2.5 Coincidence in frequency location of auditory microstructure extrema
Data from Zwicker and Schloth (1984) display that frequencies at which both the CTASP magnitude and SOAE are maximal coincide with the minima in threshold microstructure, leading to the observation that at frequencies where the ear emits most powerfully hearing acuity is greatest (Shera and Zweig, 1993).
The threshold data shown in Zwicker and Scholth (1984) is the rms electrical voltage level in decibels applied to the earphone. Alternatively, threshold data can be acquired by measuring the sound pressure level in the ear canal during stimulation at a level corresponding to threshold. Differences in the methodology o f threshold measurement may give rise to differences in the derived threshold microstructure.
Chapter 2: Literature review
As Kim (1983) notes, the acoustic signal in the ear canal can be made up o f three components; firstly, the component resulting from electrical stimulation o f the earphone, referred to as the applied stimulus; secondly, the stimulus frequency OAE signal component; and thirdly, the spontaneous OAE component. The second and third components are o f cochlear origin, as well as dependent upon the transmission characteristics o f the middle ear. The applied stimulus component is common to both methods, electrical and SPL, o f threshold measurement, whereas the SPL derived threshold measure carries information about the two additional cochlear originating signals.
Wilson (1980) states that, for three subjects, there was an intrasubject correlation, but no intersubject correlation found between the frequency position o f the CTASP maxima and threshold minima. The maxima in the sound pressure level measured in the ear o f one subject coincided with the frequency o f the threshold minima, the second subject’s SPL data displayed a correspondence with threshold maxima, while the microstructure recorded from the third subject was somewhere between the two. Such a finding is, according to Wilson, not surprising since the phase relationship between the stimulus and reëmitted signal in the ear canal may be quite different at the level o f the sensory mechanism.
To investigate the possible relationship between the applied stimulus, reëmitted signal and threshold microstructure, reference to the role o f the sound delivery system and influence o f energy reflectance has to be made.
Absolute sound pressures measured across frequency in ear canals during continuous tonal stimulation are a function o f the source impedance o f the sound delivery system. For a low source impedance relative to the load impedance, the sound delivery system approximates to a constant sound pressure source; sound pressure across the acoustic load is independent o f the magnitude o f the load impedance. Conversely, a constant volume velocity source approximation is valid when the source impedance is very much greater than the load impedance. CTASP derived data carries information relating to the sound source. This observation illustrates the proportionality between sound pressure level and load impedance magnitude for a constant volume velocity drive
Chapter 2: Literature review
condition, leading to the conclusion that fluctuations in the microstructure o f low level CTASP are maximal when recorded using a high impedance source.
Zwicker (1990) investigated the acoustic characteristics o f the sound delivery system in relation to CTASP and auditory thresholds. Two probes, designated A and B, were developed, with differing source impedances. Probe A was constructed with a relatively high degree o f acoustic damping, whereas probe B exhibited a lightly damped Helmholtz resonator characteristic with a resonance at 1250 Hz. Measurements were taken over a frequency range o f 900 to 1100 Hz, i.e., in the compliance controlled frequency region o f the source impedance o f probe B. Microstructure in CTASP data was evident with both probe A and probe B, with the frequency spacing between neighbouring maxima similar for both probes. However, the data displays a shift along the frequency axis such that maxima measured with probe B coincided with minima measured with probe A.
Allen et al (1995) observed a small shift in frequency, o f 8 Hz, between the frequency position o f a SOAE, recorded with an in-the-ear probe assembly, and the maxima in the threshold microstructure, where the stimulus was delivered via headphones. The frequency shift was explained by the use o f different transducers in each measure.
2.6 Physical basis for auditory microstructure
Auditory microstructure mirrors, to a first approximation, that o f the pressure standing wave pattern seen in transmission line^ models, such as an organ pipe. Implicit in the analysis o f such systems is the existence o f backward, as well as forward, travelling waves (TW), the consequence o f which is twofold. Firstly, power flows bidirectionally along the length o f the transmission line. Secondly, the input impedance o f the transmission line is modified by the presence o f the backward TW.
^ A transmission line is defined as a system that supports w ave m otion such that propagation is constrained in a spatial sense. N ote that the resulting w ave m otion is not necessarily one dimensional. A dditionally, evanescent as w ell as propagating modes may arise.
Chapter 2: Literature review
The concept that the cochlea can support waves that propagate basally, as well as apically, was considered to be unrealistic and erroneous during the nascent era o f measurements o f basilar membrane dynamics, and as indicated by von Békésy (1960) was somewhat paradoxical. An unconventional method o f cochlea stimulation can be achieved by applying the stimulus at the apex, in the proximity o f the helicotrema, or by bone conducted stimulation. Measurements indicated that the TW was initiated at the conventional place where the stiffness was greatest, i.e., at the base, resulting in the uncomfortable observation that the TW propagated towards the source. This apparent preference for uni-directional wave motion can, however, be explained by noting the possible wave motions possible within the cochlea.
2.7 The nature of wave motion in the cochlea
Vibration o f the stapes generates acoustical waves in the fluid filled columns o f the cochlea. Peterson and Bogert (1950) and Lighthill (1991) note that, wave motion in a system o f two tubes, such as that seen in the cochlea, where the very high compliant Reissener’s membrane can be considered mechanically transparent, consists o f two types o f waves; fast and slow waves. The fast wave, as the term suggest has an extremely high propagation speed, and gives rise to equal pressure in both perilymphatic ducts resulting in zero net pressure across the cochlear partition along the length o f the cochlear duct. The effect o f the fast wave, or in other words the longitudinal wave, is that there is no net force upon, and therefore no motion of, the cochlear partition. In contrast, the slow wave gives rise to equal and opposite pressures across the cochlear partition, developing a pressure gradient close to the base. Due to the tapering nature o f the cochlear partition mechanics the slow wave then propagates apically resulting in a hydro-mechanical wave. For modelling purposes, it is valid, especially at the basal end, that the slow wave can be approximated to a shallow wave, or long-wave approximation, since the wavelength o f the TW is large compared to the height o f the scalae. The result o f such o f an approximation is that the pressure is uniform across each traverse section o f the cochlea, leading to a geometry that is for modelling purposes one-dimensional.
Chapter 2: Literature review
The energy o f the hydro-mechanical wave is shared between the mass o f the fluid columns, which controls the kinetic energy, and the stiffness o f the cochlear partition which determines the potential energy. The basilar membrane has a unique mechanical characteristic. Firstly, the stiffness o f the basilar membrane is highly graded; a four to five orders o f magnitude difference between base to apex. Secondly, the basilar membrane is highly anisotropic, leading to the observation that along its axis, neighbouring sections are very weakly linked and can be considered to vibrate independently. The result is that the speed o f the hydro-mechanical wave slows down, the wavelength decreases and energy ‘piles-up’ at a point which is preferential and characteristic for that frequency.
The TW apparently propagating towards the source during non-stapes stimulation o f the cochlea can be explained as a result o f the existence o f a fast wave at the site o f stimulation which travels towards the base and due to the impedance mismatch at the boundary, namely the OW and RW, leads to a conventional apically travelling hydro mechanical wave.
2.8 Wave reflection model of auditory microstructure
Kemp (1978) postulated that reflected EOAEs are a consequence o f a basal TW which is initiated by reflection o f an apical TW due to micromechanical impedance discontinuities in the cochlear partition. Reflected OAEs can then be thought o f as a measure o f the mechanical response o f cochlear structures, hence the term evoked cochlear mechanical response (ECMR) prevalent in incipient studies (Kemp, 1979b). M ost generally, such a postulation provides the basis for the wave reflection model. The existence o f anomalies in the mechanics o f the cochlea can arise on account o f anatomical disorder in the structures that make up the cochlear partition (de Boer,
1984). Cochlear models that exploit anatomical structural disorder are referred to as place-fixed models. Furthermore, Kemp (1978) hypothesised that the mechanical response o f the cochlear partition, primarily in the region o f the TW peak manifests a nonlinear characteristic. It is this nonlinear mechanical response that creates the micromechanical impedance discontinuity. Wave reflection models, in which the TW
Chapter 2: Literature review
itself governs the mechanism that modifies cochlear mechanics initiating a basal TW, are termed wave-fixed models.
Anatomical differences across species support this view. Primate cochleae show relatively more microstructural disorder compared to the regular ‘almost crystalline’ arrangement in the organ o f Corti in rodents (Wright, 1984). The magnitude o f TEOAEs in primates are correspondingly greater than in rodents. Schmiedt et
found that, even with a stimulus amplitude o f 80 dB SPL peak, TEOAEs in gerbils proved difficult to record. Wit and Ritsma (1980) could not elicit TEOAEs in gerbil nor guinea pig, however, Zwicker and Manley (1981) measured reliable signals in guinea pigs.
Reverse transmission factors, in particular the role o f the middle ear, may explain the difference across species. This seems unlikely due to large DPOAEs observed in rodent ears in contrast to small emissions in humans (Schmiedt and Adams 1981; Kemp 1979); the amplitude o f the 2fl-f2 distortion product in humans is typically 50 to 70 dB less that the primary amplitudes (Lonsbury-Martin et al, 1990), whereas 30 to 50 dB lower in chinchillas (Zurek et al, 1982). It is noteworthy that this observation suggests a difference in the mechanisms involved in the generation o f DPOAEs verses TEOAEs.
Focusing on the spectral periodicity evinced in auditory microstructure, suggests a regularity in the construction o f the cochlear partition. Such an observation leads to ‘the paradox o f periodicity’ (Shera and Zweig, 1993), in which chaos in the structure o f the cochlear partition, revealed from anatomical studies, is at odds to the order seen in the microstructure o f numerous auditory phenomena.
The wave reflection model makes explicit the notion that energy propagation along the cochlea can be modelled by a transmission line (de Boer, 1984), the analysis o f which is analogous to electrical transmission line theory (Russell and Hjerpe, 1993). Under the long wave approximation, a short section o f the cochlear can be modelled as an electrical network consisting o f a series impedance and shunt admittance’®. The series
Admittance is the reciprocal o f impedance. Immittance, a term coined by B ode, refers to both
impedance and admittance.
Chapter 2: Literature review
impedance represents the inductance per unit length, or for the cochlea, the mass o f fluid per unit length. The shunt admittance then represents the specific acoustic admittance per unit length o f the cochlear partition. The basis o f the local irregularity can now be made explicit as a local change in the shunt admittance compared to the gross, average change arising due to the graded mechanical property.
The effect o f such a local immittance irregularity is the generation o f a reflected, as well as transmitted wave. Reflected, or basal travelling waves, would give rise to a proportion o f the incident energy propagating toward the OW. At the OW-TC interface, an impedance mismatch would in turn reflect a fraction o f the wave back to an apically TW. However, a fraction o f the basal TW incident upon the OW will, due to coupling by the middle ear, be transmitted to the ear canal, as an additional wave o f cochlear origin. In other words, stimulation o f healthy ears results in the reemission o f sound.
Reflection o f the hydro-mechanical wave at a point along the BM is valid. However, it was argued with reference to cochlear models, that the resulting basal TW encountered reflection over and above that for the apically TW (de Boer and Viergever, 1984). The consequence o f such a mechanism leads to reflection o f cochlear waves which is manifestly asymmetric. As Shera and Zweig (1991) show, the existence o f such an asymmetry is an artefact o f the boundary conditions in the model.
2.9 The active cochlea
Wave reflection in the cochlea, with the existence o f apical and basal travelling waves, leading to the phenomenon o f wave interference only partially satisfies the demands that auditory micro structure data imply. Most notably is the level dependent, nonlinear^ ^ ratio o f maxima to minima in the undulating microstructure, which is contemporarily explained with reference to an active cochlea’
” The existence o f a nonlinearity does not imply an active process. A s Brass and Kemp (1993) note, such nonlinearities could reflect a passive attenuating system operating at high stimulus levels.
W e use active to describe a process in w hich the power flow ing out o f a section is greater than the power flow ing into the section. More specifically, there is greater power flow ing past the characteristic place on the cochlear partition than flow ing into the ear canal (Brass and Kemp, 1993).
Chapter 2: Literature review
It has been suggested that the existence o f spontaneous OAEs, i.e., signals that are present in the ear canal without external stimulation, evince an active process in the auditory system, specifically the cochlea. However, ear canal signals could equally originate from narrowband filtered noise, due to brownian motion within the cochlea, as suggested by Allen (1980). Statistical analysis o f SOAEs suggest that such signals are generated by an active nonlinear system (Bialek and Wit, 1984), however not all classes o f passive nonlinear systems were postulated. Perplexingly, a number o f nonmammalian vertebrates, for example the bam owl, manifest no evidence o f cochlear activity, but exhibit SOAEs (Manley and Taschenberger, 1993).
Gold (1948) first proposed the existence o f activity in the cochlear response to explain the high degree o f frequency selectivity, or bandpass filtering, achieved in the auditory periphery. An active process manifest as a synchronous, cycle-by-cycle boost o f mechanical vibration o f a frequency-specific nature, acting as a high-Q resonator, is referred to generically as the cochlear amplifier (Davis, 1983). Such a biomechanical amplification process requires metabolic energy and displays a preferential operating level which is greatest at low intensities.
Brass and Kemp (1993) argue that analysis o f BM transverse velocity measurements using the Mossbauer technique indicate mechanical activity in the cochlear. They compared BM transverse velocity amplitude measurements to amplitude data derived from a lossless passive model determined from measured BM transverse velocity phase data. The consequence o f the presence o f a cochlear amplifier, o f gain o f up to 40 dB, compared to the absence o f such a mechanism, is a widening o f dynamic range, an increase in sensitivity and a sharpening o f frequency selectivity.
The compressive nonlinear nature in the microstructure is then explained as resulting from the cochlear amplifier whose relative response is maximal for low intensities. Specifically, the ratio o f BM motion to stapes motion is greater for lower stimulation levels, resulting in a more pronounced undulation in the microstructure.