Improved Segmentation Techniques For Image
Manipulation With Shadow Based Digital Forgery
Using Vanishing Point Computation
N.R Gladiss Merlin, B. Santhosh Kumar, R. Cristin, R.Arun Sekar
Abstract: Now a day, in the visual imagery trend image manipulation appears to be in every domain or field where imagery plays a significant role. From newspapers, articles, magazines to scientific research papers, image manipulation is blow-out. Shadows in an image are unavoidable. The shadows are present in the image because of the objects in the image scene content. When an image forger tries to manipulate the image containing shadow, special effort should be shown to make the shadow inconsistency in the image clueless. Either the shadow of the object in the image has to be copied from different image containing same object or shadow of the objects is distinctively copied and pasted on to the image. This paper proposes to develop a new forgery detection methodology based on shadow inconsistency. The intent is to estimate the position of the light and shadow vanishing point of the image and to compare the vanishing point. If any difference in vanishing point exists, it resembles the inconsistency of the shadow present in image and judge whether the image is tampered.
Index Terms: Vanishing point, shadow, digital forgery, segmentation
—————————— ——————————
1.
INTRODUCTION
TO authenticate the originality of the image, several forgery detection methods are applied In the main, to enlighten the impact of the image forgery an example of fake image generated in real life is reflected; ‗Robert Cape‘s Falling Soldier photograph‘ captured during 1936 Griffin, M.,[1]. The image specifies the moment of the death of a Spanish civil war soldier who is twisting towards the ground. This image is considered one of the shines in the photography. But now the thing has changed, the same image is found to be manipulated with different background. Robert Cape‘s controversial image was taken in age when the visual imagery is not more sophisticated, even then the image is manipulated. But now the imagery is within the palm of a person which increases the chance of forgery. Thus the need for the forgery detection is increasing. By analysing the photometric properties of the shadow present in the image, the image forgery can be detected Q. Liu, et al.[2]. Now a day the different the machine learning algorithms are used in different application like agriculture T.daniya and S.Vigneshwari [10], forgery detection, Medical etc,
2
BACKGROUND
However, the technique which covers the minute constraint of the shadow is necessary Ke, Yongzhen et al[3]. Explicit estimation of the light source responsible for shadow is another key difficulty in the shadow based detection methods
Bin Yang, et al.[4]. Difficulty in handling shadow constraints and time consumption for the detection is another limitation in shadow based image manipulation exposure techniques Kee et al.[5].Common requirement of independent number of shadow properties of shadow projector is not fully analysed for the authenticity verification Cao et al.[6].
3.
METHODOLOGY
The first contribution in this paper is geometrical representation technique to identify the shadow of the objects in the image. By the representation, the light and shadow vanishing points present in the image is found out without analysing the image. The discovered light and shadow vanishing points are used in the matching/analysis for exposing the manipulation. The second contribution in this paper is image segmentation analysis. The segmentation techniques like improved morphological image analysis is utilized for decomposing the shadow and non-shadow region from the image more precisely. The shadow point from the shadow region is compared with the shadow point of the geometrical technique using distance as the measure based on which the image originality is validated. In the view point of the shadow based forgery detection, the utmost intend is to discover the shadow region from the image for the analysis. The input image ‗I‘ subjected for forgery detection contains the shadow and non-shadow region. The combined action of image analysis techniques separates the shadow region from the image. However, additional concepts concerned with shadow vanishing point which is optimal in an image are required for finding the inconsistency in shadows present in image. The main challenge in shadow based detection technique is decomposition of image into shadow and shadow free image. Many image analysis techniques are available for separating the shadow and non-shadow region. The block diagram of the proposed geometric technique and collective segmentation analysis based shadow forgery detection is depicted in figure 1. Primarily, the shadow vanishing point and light vanishing point present in the image is discovered by making use of the proposed geometrical representation technique. Subsequently, the segmentation analysis is performed over the subjected image. The segmentation is performed in sequence for separating the shadow region from ————————————————
N.R.Gladiss Merlin is currently working as an Associate Professor/ CSE,
Jeppiaar Institute of Technology, Chennai. India, E-mail:
Dr.B.Santhosh Kumar is currently working as a Sr. Assistant
Professor/CSE, GMR Institute of Tehnology, Rajam, Andhra Pradesh,
India, E—mail: [email protected]
Dr.R.Cristin is currently working as an Assistant Professor/CSE, GMR
Institute of Tehnology, Rajam, Andhra Pradesh, India, E—mail: [email protected]
Dr.R. Arun Sekar is currently working as a Assistant Professor/ECE,
the image. At first, morphological image analysis is performed which separates the structural information of the image which enhances the shadow region separation and super pixel segmentation is performed over the image. The collective segmentation provides shadow region. From the shadow region, the shadow and light vanishing point is extracted. Afterwards, the shadow and light vanishing point discovered by the geometrical technique and the point resultant from the segmentation analysis is compared using a distance measure. The deviation in the distance measure signifies the inconsistency in the shadow of the image which judges the image as the tampered.
Figure.1 Proposed Geometrical Technique and Collective segmentation analysis based Shadow forgery detection
The shadow of the image exploited using a geometrical representation with relationship of light source to the object. The shadow present in the image has some vanishing point. By discovering the vanishing point, the inconsistency can be analysed. The shadow vanishing point is not similar to the standard construction vanishing point. The vanishing point present in the image shadow is of two types; light vanishing point and shadow vanishing point. The steps involved in geometrical representation for the identification of the shadow vanishing point is given as follows; In order to create a believable shadow, object in the image scene content must be placed transparently because the back corners of the object is needed to make the shadow disappear behind the object. After object placement, the light source about the object is requisite. The light source must be placed aptly because improper positioning of light source distorts the shadow. The light source resembles the light vanishing point and the shadow vanishing point lies in the vertical intersection point of the light vanishing point to the surface where the shadow is originated. The extreme edges of the shadow are marked by sending the shadow convergence line through the bottom corner of the object up until they intersect with the light lines. Figure 2 represents the geometrical representation technique for identifying the shadow and vanishing point. In figure 2, red dots epitomize the extreme edge of the shadow.
Figure.2 Geometric representation of Light Vanishing Point and Shadow vanishing Point
The image place is initially converted from 3D to 2D for the VP identification. Let us consider the camera capturing image from xyz with focal length f is converted to the image coordinate x y and the image plane is represented as in the equation (3.1).
Where, x and X are the vectors with three elements and it is given by,
T
TZ
,
Y
,
X
X
and
,
x
x,
y,
f
The parallel line light and shadow meets at the same vanishing point and it is represented in three dimensions as in equation (3.2).
A
D
3
.
2
X
Where, D is direction expressed using crammers rule in terms of X, Y, and Z. In order to convert the three dimensional to two dimensional, Homogeneous projection matrix is considered Trigs, B[7]. For the homogeneous projection matrix 3X4, the value of projection matrix is represented by the following equation (3.3).
|
0
3
.
3
0
1
0
0
0
0
1
0
0
0
0
1
I
Z
Y
X
x
x
x
3 2 1
The above homogeneous image coordinates aptly
represents
Z
X
x
f
. Perspective linear map projection isperformed over the homogenous points. The vanishing point is homogenously expressed as in equation (3.4).
1 0
3.41 0
1
D A D A x x x 3 2 1
For an image with infinitive intersection point, the vanishing point with direction D is expressed as in the following expression (3.5).
3.5 0 1 0 1 z y x D D D D v4.
COLLECTIVE
SEGMENTATION
ANALYSIS
In this section, the detailed description about the collective segmentation analysis introduced for the shadow based forgery detection is presented.
i) Morphological Image Analysis
Morphological image analysis operation is performed centred on the sets of pixels Areif H, M. Hahn[8]. In the binary morphology analysis, for the segmentation of the image a membership function with an indifferent pixel value corresponding to grey level, colour etc. are utilized. The significant advantage of the morphological image analysis is that it efficiently extracts the structural information of the image. Geometrical transformation and measurements are the two basic steps involved in the morphological image analysis. The morphological transformation includes dilation, erosion, opening, and closing. In binary dilation, the pixel sets are combined using the vector sum of elements. The dilation transformation operation is defined as in the following equation (3.6).
z
E
|
z
x
b
for
x
X
;
x
X
3
.
6
X
nb
Erosion transformation operation is the complementary dilation operation i.e. two pixels sets are combined based on the vector differences. The erosion transformation operation is defined by the equation (3.7).
z
E
n|
z
b
X
for
b
;
X
E
n,
and
B
E
n
3
.
7
B
X
B
The iterative dilation and erosion transformation eliminates the structuring elements less than the threshold preserving the global geometric structure of the image features. The opening transformation operation is performed based on the dilating results and it is defined by the equation (3.8).
X
B
B
3
.
8
B
X
The opening operations smooth the contours of the image with assistance of cutting and suppression. Closing transformation operation is complementary operation of opening and it is defined by the equation (3.9).
X
B
B
3
.
9
B
X
ii) Thresholding segmentation
Thresholding segmentation is adopted in the proposed detection strategy to handle the grey scale image containing image composite. Here, an antistrophic diffusion model Radhakrishna Achanta et al [9] is accepted as the thresholding model. The basic concept for the segmentation is based on the squared error measure. The image which is subjected to
segmentation is approximated within a region
R
i based on itsmean value
i and the segmentation is performed by mergingthe region with same mean value. The error measure between the segmentation and the original image is expressed as in the following equation (3.10).
i
E
iE
3
.
10
where the error measure value
E
iis given by the equation (3.11).
1
2
3
.
11
i
R i
i
E
The merging of the two regions will increase the total error. Let
i
R
andR
jbe the two regions which are merged based on themean value, and then the new region is expressed as in the equation (3.12).
3
.
12
j i ij
R
R
R
The region merging alters the mean value of the individual
region as
u
ij. The non-negative change in the error measure in the merged region is defined by the equation (3.13).
3
.
13
j i ij
ij
E
E
E
E
Where, the error measure value
E
ijin appropriate region isgiven by the equation (3.14).
1
2
3
.
14
ji
R ij ji
E
This error measure based region merging concepts has been utilized in the proposed method for developing a computational method to segment the brightness, colour and texture of the images. The experimentation of the proposed concept based thresholding segmentation obtained promising results. In Ng T.T et al.[12], Salem Saleh Al-amril et al[11], the thresholding segmentation is performed based on the similarity between the pixels and is not centred on the minimization criterion function. Based on which a fuzzy set based framework is developed to obtain the mathematical model of similarity based segmentation concepts. The proposed minimized criterion function based approaches and existing similarity based approach are comparatively analysed and the proposed approaches resulted in improved segmentation results even for the multimodal histograms. The superior performance is because of the following reasons, The local minima trap is avoided in the existing approaches by neglecting the global minimum detection Chen .T, et al[13]. Such attempt doesn‘t corresponds the absolute minimum of the histogram in segmentation which fails to properly segment the background and foreground scene content of the image. The proposed thresholding segmentation approaches is not limited to restrictions of number of images. The signal to noise ration used herein is defined as in the equation (3.15).
, ,
3.15, log
10
1 1 1 1
2
r c r c
N r
N
c n
N r
N c
c r I c r I
c r I SNR
Where,
I
r
,
c
represents the intensity of the (r,c)thpixel ofreference image and
I
n
r
,
c
represents the intensity ofthe image and
N
crepresents the number of the columns ofthe image.
iii) Super pixel segmentation
Super pixel segmentation of image is performed by combining the pixels sets with different distance into a single measure RadhakrishnaAchanta et al[9]. The normalization of the color proximity and spatial proximity is obligatory with respect to their maximum distance within a cluster. The distance measure of colour proximity is represented by the equation (3.16).
j i 2 j i
2 j ii
2
3
.
16
c
l
l
a
a
b
b
d
Where, dc is the distance measure of color proximity, Ii, Ij are the Intensity of the pixel and ai, aj, bi , bj are the parameters.
The distance measure of the spatial proximity is represented by the equation (3.17).
j i
2 j i
2
3
.
17
s
x
x
y
y
d
Where,
d
sis the distance measure of the spatial proximity xi, xj, yi , yj are the pixel location on the image.The combined single measure distance measure is expressed as in the equation (3.18).
3.18
2 2
'
s s c
c
N d N
d D
Where, dc is the distance measure of color proximity, Ds is the distance measure of spatial proximity, Nc is the maximal color distance and Ns is the maximal spatial distance.
The maximal spatial distance Ns is equal to the corresponding sample interval S i.e. given by the equation (3.19).
(
3
.
19
)
K
N
S
N
s
The color similarity distance is not optimal as the cluster distance varies significantly from cluster to cluster and image to image. So the maximal colour distance is equated to m. The modified distance measure is expressed as in the equation (3.20).
3.20
2 2
'
S d m d
D c s
The colour distance element m in the distance measure permits to weight the relative importance between colour similarity and spatial similarity. The lager m value resembles the better spatial proximity and the resultant super pixels are compact inside the imagery. The smaller m value resembles the better colour similarity, and the resultant super pixels are compact alongside the boundaries with the limitation in regular shape and size.
The variance is normally used to find how each pixel varies from the neighbouring pixel (or centre pixel) and is used in classify into different regions. The variance of the given image is,
(3.21)
where n is the sample size and x-bar is the sample mean
5.
R
ESULTS ANDD
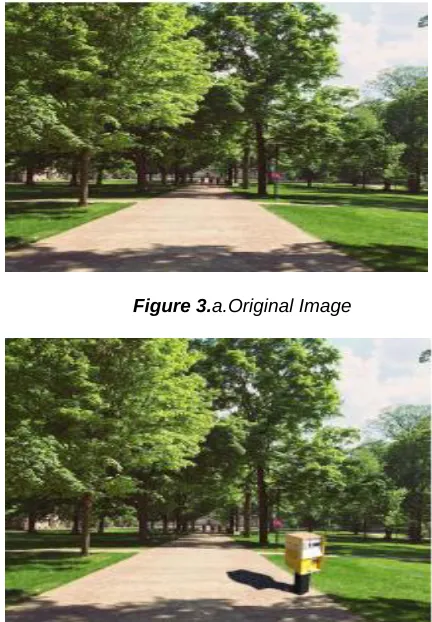
ISCUSSIONIn this section, the manipulation matching analysis is presented. From the segmented image containing separate shadow and non-shadow region, the distance points are selected from the shadow region. The distance between the two points say D1 and D2 are calculated using equation (3.20). Similarly, the distance between the light and shadow vanishing points identified by the geometrical representation technique is calculated. The deviation in the distance measure implies the inconsistency in shadow. The inconsistency in shadow judges the image as the tampered image. Thereby, based on the distance measure, the originality of the image is validated.
Figure 3.a.Original Image
Figure 3.b. Doctored Image
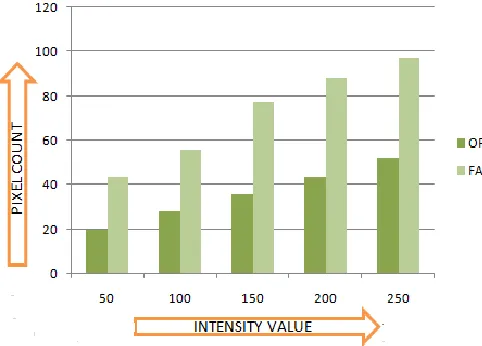
collected from the internet. The collected images are manually modified with fake shadow using the adobe Photoshop for testing the detection capability of the proposed method. The test image with 256*256 resolutions JPEG image considered for analysing the detection capability of the proposed shadow based forgery detection using geometrical representation technique and collective segmentation technique is represented in figure 5.1. Figure 5.1(a) signifies the original image with the shadow and figure 5.1b signifies the doctored image is manually placed in the original image by one yellow object. Totally 120 forgery images are used for the validation purpose.. The chart for the image is plotted between the number of pixels and pixel count. The chart for the image is plotted between the intensity value and pixel count. The analysis is performed over authentic, compressed, and reconstructed input and fake images respectively. The curve obtained for the authentic input and fake image by the proposed method is given in figure 5.2. When analysing the figure the maximal pixel count value attained is found within 50 which resembles the originality of the image. On the contrary, when analysing the maximal pixel count value attained is found exceeding 60 which resembles the fact that the image is tampered.
Figure.4 authentic and fake input image
7. CONCLUSION
This paper discusses a new image manipulation exposing scheme based on the shadow inconsistency using the geometrical representation technique and collective segmentation analysis. The geometrical technique is used to identify the shadow points from the image. The collective segmentation analysis is done utilizing Morphological analysis, Thresholding segmentation and Super pixel segmentation. Collective image segmentation analysis is performed to decompose the shadow region from the image. The authenticity is performed by comparing the geometrically computed light and shadow vanishing point with the point of the segmented region utilizing the distance measure. The experimentation of proposed detection scheme is done over manually altered diverse images. The performance of the proposed detection scheme is validated in terms of the pixel count and intensity value over existing methods. The experimentation ensued with promising results for the exposure of image manipulation with shadow consistency.
REFERENCES
[1] Griffin, M. "The great war photographs: Constructing myths of history and photojournalism", Picturing the past: Media, history, and photography, pp. 122-157, 1999.
[2] Liu, Q., Cao, X., Deng, C. and Guo,X. ―Identifying image composites through shadow matte consistency,‖ IEEE Transactions on Information Forensics and Security, vol. 6, no. 3, pp. 1111–1122, 2011.
[3] Ke., Yongzhen., Fan Qin., Weidong Min. and Guiling Zhang. "Exposing Image Forgery by Detecting Consistency of Shadow.", The Scientific World Journal, pp. 1-9, 2014.
[4] Bin Yang., Xingming Sun., Xianyi Chen., Jianjun Zhang. and Xu Li. "Exposing Photographic Splicing by Detecting the Inconsistencies in Shadows", Computer Journal, Vol. 58, no. 4, pp. 588-600, 2015.
[5] Kee, E., O'Brien, J.F. and Farid, H. "Exposing photo manipulation with inconsistent shadows", ACM Transactions on Graphics (ToG), vol. 32, no. 3, p.28, 2013.
[6] Cao., XiaoChun., HanDong Zhao., Chuan Wang. and Wei Zhang. "Image composite authentication using a single shadow observation.", Science China Information Sciences, vol. 58, no. 9, pp. 1-13, 2015.
[7] Triggs, B. "Matching constraints and the joint image", In Proceedings of IEEE Fifth International Conference on Computer Vision, pp. 338-343, 1995.
[8] Areif, H. and Hahn, M. ―A morphological reconstruction algorithm for separating off-ter rain points from terrain points in laser scanning data‖, In proceedings of International Archives of Photogrammetry, Remote Sensing and Spatial Information Sciences, pp.120-125, 2005.
[9] Radhakrishna Achanta., Appu Shaji. and Kevin Smith. ‖ SLIC Superpixels Compared To State-Of-The- Art Superpixel Methods‖, Journal Of Latex Class Files, vol. 6, no. 1, pp. 1-8, 2011.
[10]T.Daniya, S.Vigneshwari ―A Review on Machine Learning Techniques for Rice Plant Disease Detectionin Agricultural Research‖, international Journal of Advanced Science andTechnology Vol. 28, No. 13,2019.
[11]Salem Saleh Al-amri1., N.V. Kalyankar2, and Khamitkar S.D. ―Image Segmentation by Using Thershod Techniques‖, Journal of computing, vol. 2, no. 5, 2010
[12]Ng, H. P., S. H. Ong., K. W. C. Foong, P. S. Goh, and W.L. Nowinski. "Medical image segmentation using k-means clustering and improved watershed algorithm."In 2006 IEEE Southwest Symposium on Image Analysis and Interpretation, pp. 61-65.IEEE, 2006.