1 Title
Validity of Three-Dimensional Tortuous Pore Structure and Fouling of Hemoconcentration
Capillary Membrane Using the Tortuous Pore Diffusion Model and Scanning Probe
Microscopy
Makoto Fukuda1, Hiroki Yoshimoto1, Hitoshi Saomoto2, and Kiyotaka Sakai3
1 Department of Biomedical Engineering, Kindai University, 930 Nishimitani, Kinokawa-city, Wakayama, 649-6493 Japan
Phone: +81-736-77-0345(ext.4308) Fax: +81-736-77-4754
[email protected] Makoto Fukuda1, PhD, Professor (Associate)
[email protected] Hiroki Yoshimoto1
2Industrial Technology Center of Wakayama Prefecture, 60 Ogura, Wakayama-city, Wakayama, 649-6261 Japan
3Professor Emeritus of Chemical Engineering, Waseda University, 3-4-1 Okubo, Shinjuku-ku, Tokyo, 169-8555 Japan
Original paper
Corresponding author: [email protected] (Makoto Fukuda)
●Abstract: 248 words ●Figures: 5
●Tables: 3 ●References: 33 Abstract
Hemoconcentration membranes used in cardiopulmonary bypass require a pore structure design with high pure water permeability, and which does not allow protein adsorption and useful protein loss. However, studies on hemoconcentration membranes have not been conducted yet. The purpose of this study was to analyze three-dimensional pore structures and protein fouling before and after blood contact with capillary membranes using the tortuous pore diffusion model and a
2
scanning probe microscope system. We examined two commercially available capillary membranes of similar polymer composition that are successfully used in hemoconcentration clinically. Assuming the conditions of actual use in cardiopulmonary bypass, we perfused these membranes with bovine blood. Pure water permeability before and after bovine blood perfusion was measured using the dead-end filtration. The scanning probe microscopy system was used for analysis. High-resolution three-dimensional pore structures on the inner surface of the membranes were observed before blood contact. On the other hand, pore structures after blood contact could not be observed due to protein fouling. The pore diameters calculated by the tortuous pore diffusion model and scanning probe microscopy were mostly similar and could be validated reciprocally. Achievable pure water permeabilities showed no difference despite protein fouling, leading to low values of albumin SC. This is due to the mechanism that protein fouling occurs on the membrane surface, while there is little internal pore blocking. Therefore, controlling the fouling is essential for membranes in medical use. These characteristics of the hemoconcentration membranes examined in this study are suitable for clinical use.
Keywords: tortuous pore diffusion model (TPD model); scanning probe microscopy (SPM); capillary; hollow fiber membrane; three-dimensional tortuous pore
1. Introduction
Hemoconcentration membranes used in extracorporeal circulatory surgeries require a membrane pore structure design with a high pure water permeability, which does not allow useful proteins such as albumin to leak out [1-2]. However, studies on hemoconcentration membranes have not been conducted yet, and therefore, we were interested in pore structures before and after blood contact due to protein fouling [3].
3
significant in terms of its contribution to engineering and blood purification [7]. The development of the medical device industry and membrane science is a two-way process.
Fig. 1 Schematic diagram of a three-dimensional laminated structure model. [4]
As an example, for lithium-ion secondary batteries, Yoshino (Akira Yoshino, 2019 Nobel laureate in chemistry, honorary fellow at Japanese chemical producer Asahi Kasei, the basic foundation of the lithium-ion battery was established.) et al. are studying the relation between the 3D pore structures of flat sheet membranes (separator) and lithium-ion migration [9-10].
Observation and analysis methods of the pore structures of membranes can be broadly divided into indirect methods such as evapoporometry, nanoperm porometry, and nitrogen adsorption and direct methods such as scanning electron microscopy (SEM), field emission SEM (FESEM), environmental SEM (ESEM), transmission EM (TEM), and atomic force microscopy (AFM).
4
SEM and FESEM require a third material coating on the sample surface. Since ESEM uses a gas ionization detector, surface coating is not required. Although ESEM has been applied to pore size distribution measurement of ultrafiltration membranes, the resolution must be further increased [11-12]. In contrast, AFM allows direct observation with very high resolution and without any special sample preparation [11-12, 15, 17]. However, only a very small area of less than 1 µm2 can be observed; thus, a problem exists when applying this method to membranes (such as those made by the phase separation method) that do not have well-defined pores. Furthermore, these devices are not readily available or versatile for these direct observations [11-12].
Most medical membranes for various blood purifications are asymmetric membranes. Moreover, the properties of the innermost surface of inner lumen of the capillary membrane, in particular, have a notable effect on solute permeability and biocompatibility of the membrane, showing that the pore structure of the innermost surface of the membrane is closely related to solute permeability [13-16]. Therefore, when identifying a blood purification membrane for medical use, clarifying the innermost surface pore structure of the membrane is of significance. Thus, the direct methods such as using AFM are more suitable for observing most medical membranes compared to the indirect methods.
Hayama et al. attempted to successfully observe nano-order pore structures directly on hemodialysis membranes using AFM [17-19]. Hayama et al. were the first to clarify the AFM image of surface pores of a dialysis membrane, but it was insufficient to analyze 3D concave structures. Therefore, we focused on dynamic force microscopy (DFM), which is more apropriate for observing soft samples and samples with large irregularities compared to conventional AFM. We could successfully observe the 3D tortuous pore structures of hemoconcentration membranes and measure pore diameter and distribution [3, 20].
In this study, we analyze 3D pore structures and fouling of capillary hemoconcentration membranes using the TPD model and an SPM system (DFM). The targets are commercially available hemoconcentration membranes that are being produced successfully in the industry and used clinically. We discuss the validity of pore diameters calculated by the TPD model and SPM, and relations between changes of 3D pore structure and typical mass transfer properties due to protein fouling.
2. Materials and Methods
2.1 Hemoconcentration membrane (Hemoconcentrator)
5
successfully used clinically for hemoconcentration. The membranes, especially inner surfaces of the membranes are hydrophilized by blending poly(vinylpyrrolidone) (PVP), a hydrophilizing agent, to prevent surface fouling or pore blocking due to protein adsorption, and obtain
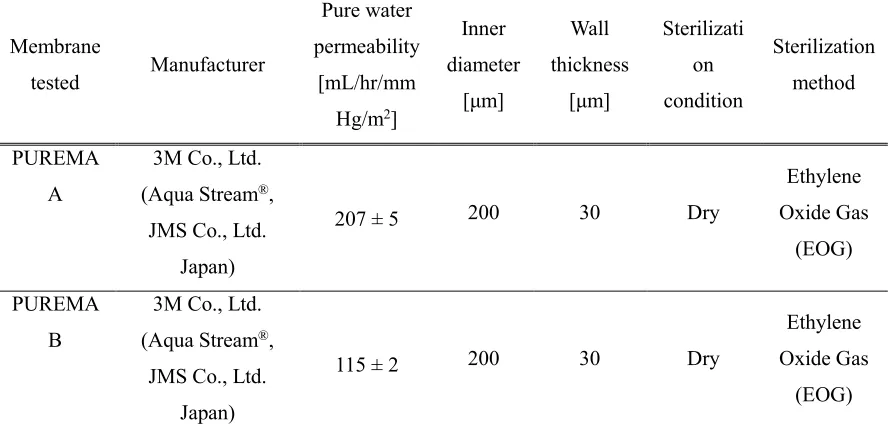
biocompatibility. Table 1 shows the specification of the hollow fiber hemoconcentrator membranes. The pure water permeabilities of these membranes were significantly different, and the membranes were expected to be different in pore structure. Here, isolated single fibers were investigated instead of those in their housing.
Table 1. Specification of hollow fiber hemoconcentrator membranes tested.
Membrane
tested Manufacturer
Pure water permeability
[mL/hr/mm Hg/m2]
Inner diameter [μm] Wall thickness [μm] Sterilizati on condition Sterilization method PUREMA A
3M Co., Ltd. (Aqua Stream®,
JMS Co., Ltd. Japan)
207 ± 5 200 30 Dry
Ethylene Oxide Gas
(EOG)
PUREMA B
3M Co., Ltd. (Aqua Stream®,
JMS Co., Ltd. Japan)
115 ± 2 200 30 Dry
Ethylene Oxide Gas
(EOG)
1) Membrane materials; Polyethersulfone, hydrophilized by blending poly(vinylpyrrolidone) (PVP), Glycerol free
2) Membrane area of hemoconcentrator:1.1m2
2.2 Bovine blood perfusion experiment
We examined the hemoconcentration membranes PUREMA® A and B (3M Co. Ltd., hemoconcentrator Aquastream® JMS Co., Ltd.). Assuming the conditions of actual use in extracorporeal circulation and diluted human blood property [2], bovine blood (Hct=23%, Hb=7.5 g/dL, 37 °C) was perfused in hemoconcentrator devices (membrane area:1.1m2) for 10 minutes under 2 conditions (n=10 each) (high load: flow rate of blood side QB of 500 mL/min, filtration
6 were treated using a paired t-test (p < 0.05).
After bovine blood perfusion, 2% glutaraldehyde aqueous solution using sterile RO water was perfused (200 mL/min, 5 minutes) into the module and drained, subsequently allowed to stand for approximately 60 minutes for protein immobilization to take place, and then used to observe the pore structure. It must be considered that 2% glutaraldehyde aqueous solution were applied for both, protein fixation and immobilization on the membrane inner surface. Glutaraldehyde has an effect on protein immobilization an effect on protein adsorption to a membrane, and these are necessary to be separated and discussed. Sterile RO water was used for their rinsing process because bacterial contamination might impact results either.
2.3 Observation of three-dimensional tortuous pore using an SPM system [3, 20]
The method reported in our previous study [3, 20] was employed to observe the inner surface of hollow fiber membranes. Before bovine blood contact, the hemoconcentrators were washed by feeding sterile RO water at 200 mL/min for 30 min. Hollow fiber membranes were extracted from the hemoconcentrators. One fiber was cut into a length of 1 mm and approximately about 1/16th in the longitudinal direction using a razor. The samples for the purpose of observing the inner surface were cut such that their cylindrical shape was maintained and not strained during observation. However, this sample preparation is very difficult, and sample preparation yield and observation yield are still low. This creation of this observation sample is also a key point in this study. After that, three-dimensional tortuous pores were observed on the surface of inner lumen of the capillary membranes.
3. Results
3.1 Observation of three-dimensional tortuous pores of inner lumen surface of the capillary
membranes.
8
Fig. 2. SPM images of the surface of inner lumen of the capillary membranes of PUREMA A (wet), (a) before blood contact, (b-d) after blood contact, (b, c) low load in blood contact, (d) high load in blood contact, respectively. (1) 2,000 nm × 2,000 nm; (2) 500 nm × 500 nm; and (3) 200 nm × 200 nm. The image of (3) shows magnified images of the pores enclosed by the blue square in (2), and the image of (2) shows magnified images of the pores enclosed by the blue square in (1).
(a1): Clear 3D pore structures and fiber structures made of polymer were observed before blood contact.
(b1, c1, d1): The pores seemed to be covered by protein adsorption layer, protein adsorption layer in (d1) appeared to be thicker than those of (b1, c1)
9
Fig. 3. SPM images of the surface of inner lumen of the capillary membranes of PUREMA B (wet), (a) before blood contact, (b-d) after blood contact, (b) low load in blood contact, (c) high load in blood contact, respectively. (1) 2,000 nm × 2,000 nm; (2) 500 nm × 500 nm; and (3) 200 nm × 200 nm. The image of (3) shows magnified images of the pores enclosed by the blue square in (2), and the image of (2) shows magnified images of the pores enclosed by the blue square in (1).
10
On the other hand, about the ultrafiltration membrane with low Lp, many pores were not covered by protein adsorption layer (Fig.3(b, c)). The protein adsorption layer of the high and low loads of the ultrafiltration membrane with low Lp did not seem to differ in morphology (Fig.3(b) vs. (c)). Furthermore, the protein adsorption layer of the ultrafiltration membrane with low Lp appeared to be thinner than that of the ultrafiltration membrane with high Lp (Fig.2(b, c, d) vs. Fig.3(b, c)). Under the same conditions of transmembrane pressure and flow rate of blood side, the load on the ultrafiltration membrane with low Lp was larger than that of on ultrafiltration membrane with high Lp. So it has been assumed that the thickness of the protein adsorption layer of the ultrafiltration membrane with low Lp was thicker. In order to accurately the thickness of the protein adsorption layer, it is necessary to perform a cross sectional analysis in detail.
11
3.2 Determination of three-dimensional tortuous pore diameter and distribution using a line
analysis
12
Fig. 4. Distribution of the pore diameter before blood contact determined through SPM: (a) PUREMA A (wet) and (b) PUREMA B (wet). (1) Long axis, (2) Short axis, (3) pore area.
13
pore and area distributions were also shown to appear large and wide (the pore and area distributions were sharp). When two membranes were compared, we found that the pore structures were different. The polyethersulfone membranes are manufactured to suit each individual use and are superior in terms of membrane productivity and versatility.
In order to evaluate the pore structures in detail, the present analysis using this software requires high number of samples, which means more accurate pore size distribution can be obtained. Therefore, measurement accuracy must be improved by increasing the number of data.
4. Discussion
4.1 Change in pore structure and mass transfer property due to protein fouling
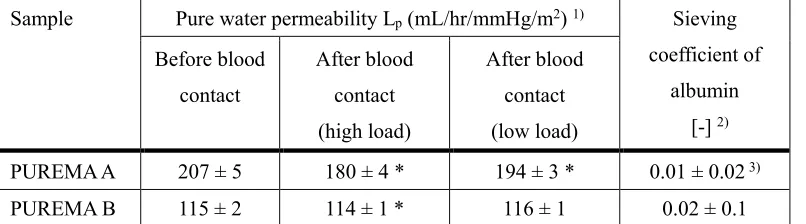
Table 2 shows the measured values of the pure water permeability before and after blood contact and the sieving coefficient (SC) of albumin. As shown in Section 3.1, most surface pores of the inner lumen of the capillary membranes (PUREMA A) after blood contact were covered with the protein adsorption layer. There were highly novel differences in tortuous pore morphologies between unfouled and fouled surfaces of inner lumen of the capillary membranes. However, Table 2 shows that the value of the pure water permeability after blood contact was slightly lower compared to the value before blood contact. Especially for the ultrafiltration membrane with low Lp, the pure water permeability of low load after blood contact even slightly increased, but there was no significant difference. This was because that the protein adsorption layer of the high and low loads of the ultrafiltration membrane with low Lp did not seem to differ in morphology (Fig.3(b) vs. (c)).
Table 2 Changes in pure water permeability before and after blood contact, sieving coefficient. Sample Pure water permeability Lp (mL/hr/mmHg/m2) 1) Sieving
coefficient of albumin
[-] 2) Before blood
contact
After blood contact (high load)
After blood contact (low load)
PUREMA A 207 ± 5 180 ± 4 * 194 ± 3 * 0.01 ± 0.02 3)
PUREMA B 115 ± 2 114 ± 1 * 116 ± 1 0.02 ± 0.1
1) n = 10, pure water permeability Lp, Japan Society for Artificial Organs “Dialyzer Performance Evaluation Criteria” II. UFR measurement method, C method (STOP method, dead-end filtration)
*) Paired t-test (p < 0.05, PUREMA-A before blood contact versus after blood contact (high, low)) Paired t-test (p < 0.05, PUREMA-B before blood contact versus after blood contact (high))
14 (2):
The sieving coefficient (SC) was measured using the method reported in our previous study [3].1 h after starting the irrigation, the blood side inlet concentration, outlet concentration, and filtrate side concentration of the solute were measured.
(3): cited from [3]
Thus, in the hemoconcentration membrane fouling process in this experiment, slight changes in the pore structure of the thick part of the membrane were noted, despite the protein adsorption layer on the fouling pore inlets (surface fouling, external). There was little internal pore blocking (pore blocking, internal) (Fig.5). In particular, the phenomena of the ultrafiltration membrane with low Lp are interesting. The difference of pure water permeabilities was relatively low compared to the difference in images for protein fouling on the pore inlets. One possible explanation for this is that the protein fouling occurs on the membrane surface, on the other hand, there is little internal pore blocking. The internal pore surface sites are much larger than the external surface sites where protein adsorption occurs (Fig.5). Achievable pure water permeabilities showed no difference despite protein fouling in the pores, leading to low values of albumin SC. These mass transfer properties of the hemoconcentration membrane (high pure water permeability and low albumin SC) are suitable for clinical use. However, public criteria and measurement method have not been established for the pure water permeability and albumin SC of hemoconcentration membranes.
15
Fig. 5. Schematic diagram of the surface of inner lumen of the capillary membrane fouling and pore blocking (concept).
4.2 Tortuous pore diffusion model (TPD model)
16
the equations of the relation between the pore radius and membrane permeability [31-32]. Klein has also contributed to the research achievements in this field with prominent researchers such as Liao and Hardy (2005 [33]).
Sakai et al. proposed the tortuous pore diffusion model by introducing tortuosity (τ) into the Verniory’s pore model [5-6]. The length (L= τΔx) through which the solute and water actually permeate is larger than the membrane thickness Δx, and an equivalent pore radius could be calculated from Eq. (7). The concept that lengths of tritium-labeled water [3]HHO diffusion and hydraulic permeation through tortuous capillary pores are the same improved the quality of the model. Sakai et al. provided the following correlation equation for estimating solute permeability [5-6]:
x
A
S
q
f
D
P
K D O
m (4)In addition,
is represented asK A
H
(5)
Eq. (7) is obtained by rearranging of Eq. (6).
x H r L P 2 2 P
8 (6)
P 2 P 8 L H x
r (7)
where DO is the diffusion coefficient of the solute in water, f(q) is the friction coefficient of the of the pore walls and water with the solute in diffusion, SD is the steric hindrance factor at the pore inlet in
diffusion, AK is the surface porosity of the water content,
is the tortuosity,
x is the membranethickness, H is the water content, LP is the pure water permeability, rP is the pore radius,
is theviscosity of pure water. The viscosity of pure water is 0.695cP. The tortuosity of the membrane used was assumed to be 1.6 empirically [17]. Many of the membranes used for hemoconcentrator are asymmetric membranes, strictly speaking the tortuous pore diffusion model can’t be applied to asymmetric membranes having a skin layer or another similar region that contributes largely to separation.
4.3 Comparison of pore diameters measured by thetortuous pore diffusion model (TPD model)
and SPM
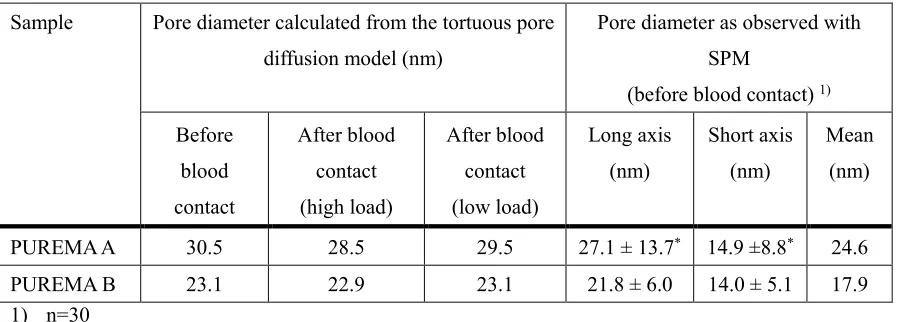
Table 3 shows the values for pore diameter before and after blood contact that were calculated based on the TPD model and the pore diameter before blood contact that was measured using SPM.
17
structure of the thick part of the membrane of the black box after blood contact could be estimated using the TPD model. Thus, the TPD model is significant because the pore structure of the membrane is associated with solute permeability and can be inferred quantitatively.
Table 3 Changes in the pore diameter before and after blood contact of the hemoconcentration membrane.
Sample Pore diameter calculated from the tortuous pore diffusion model (nm)
Pore diameter as observed with SPM
(before blood contact) 1)
Before blood contact After blood contact (high load) After blood contact (low load) Long axis (nm) Short axis (nm) Mean (nm)
PUREMA A 30.5 28.5 29.5 27.1 ± 13.7* 14.9 ±8.8* 24.6
PUREMA B 23.1 22.9 23.1 21.8 ± 6.0 14.0 ± 5.1 17.9
1) n=30
*) Paired t-test (p < 0.05, PUREMA A versus PUREMA B)
The water content of the ultrafiltration membrane with high Lp and with low Lp was 79 ± 14 v/v% and 77 ± 18 v/v%, respectively (n = 10) [17-19]. The standard deviation was high (large variation) and no significant differences were found. A pending issue is the difficulty in accurately measuring the water content of hydrophobic membranes. We used these values, and the resulting pore diameters calculated through Eq. (7) (where the TPD model values were 30.5 and 23.1 nm, respectively), under an assumed tortuosity of 1.6 [17].
The average pore diameters based on SPM were smaller than those determined with the tortuous pore diffusion model. The two polyethersulfone membranes described here were both asymmetrical and showed structures in which the pore diameter (structure) was minimum in the innermost surface facing the blood adsorption layer and outside surface [14]. By contrast, in the TPD model, the membrane structure is treated as homogenous [5-6], the pore shape is considered a perfect circle, and a pore diameter is considered consistent. Therefore, the pore diameter calculated using the TPD model reflecting the micropore structure for the overall membrane thickness using the actually measured pure water permeability is thought to be slightly larger than the surface pore diameters of inner lumen of the capillary membranes measured using SPM.
5. Conclusions
18
capillary membranes for hemoconcentration before blood contact. In addition, we observed, for the first time, that the protein adsorption layer covered the innermost surface pores after blood contact. The pore diameters of the thick part of the membrane that were calculated using the TPD model and those of the surface of inner lumen of the capillary membranes observed by SPM were mostly the same and could be validated reciprocally. Achievable pure water permeabilities showed no difference despite protein fouling on the pores, relatively constant filtration rates make these capillary membranes suitable for clinical use.
Conflict of interest
The authors have no conflicts of interest to declare.
References
1. Takeuchi M, Morita K, Iwasaki T, et al. Significance of Early Extubation after Pediatric Cardiac Surgery. Pediatric Cardiology and Cardiac Surgery 2001; 17:405–9.
2. Lee EH, Chin JH, Choi IC, Hwang BY, Choo SJ, Song JG, Kim TY, Choi IC. Postoperative hypoalbuminemia is associated with outcome in patients undergoing off-pump coronary artery bypass graft surgery. J Cardiothoracic and Vascular Anesthesia 2011; 25(3): 462–8.
https: //doi.org/10.1053/j.jvca.2010.09.008
3. Fukuda M, Saomoto H, Tomohiro Mori, Hiroki Yoshimoto, Rei Kusumi, Sakai K. Impact of three-dimensional tortuous pore structure on polyethersulfone membrane morphology and mass transfer properties from a manufacturing perspective. J Artif Organs Published online: 05 November 2019
https://doi.org/10.1007/s10047-019-01144-0
4. Hiyoshi T. Is there a limit to the spinning processes of dialysis membranes? (in Japanese). Jin to Touseki 96 (suppl 40). 1996; 26–30.
5. Sakai K, Takesawa S, Mimura R, Ohashi H. Determination of pore radius of hollow fiber dialysis membranes using tritium-labeled water. J Chem Eng Jpn 1988; 21: 207–10.
https: //doi.org/10.1252/jcej.21.207.
6. Sakai K. Determination of pore size and pore size distribution: 2. Dialysis membranes. J Membr Sci 1994; 96: 91–130.
https: //doi.org/10.1016/0376-7388(94)00127-8.
19
8. Fournier RL. Chapter 6 Mass Transfer in Heterogeneous Materials, in: Fournier RL. (Ed.), Basic Transport Phenomena in Biomedical Engineering 4th Edition. CRC Press, Boca Raton, 2017, pp. 289–347.
9. Yoshino A, Otsuka K, Nakajima T, Koyama A, Nakajyo S. Development of Lithium Ion Battery and Recent Technology Trends (in Japanese). The Chemical Society of Japan 2000; 8:523–34. 10. Yoshino A., 3-D Imaging of separator pore structure and Li+ diffusion behavior, International
Battery Relation Meeting 2013, Mar., 11th, 2013, Barcelona, Spain
11. Krantz William B, Greenberg R Alan, Kujundzic Elmira, Yeo Adrian, Hosseini S Seyed, Evapoporometry. A novel technique for determing the pore-sixe distribution of membranes, J Membr Sci 2013; 438: 153–66.
https: //doi.org/10.1016/j.msec.2013.03.045
12. Akhondi E, Wicaksana F, Krantz WB, Fane AG, Evapoporometry determination of pore-sixe distribution and pore fouling of hollow fiber membranes. J Membr Sci 2014; 470: 334–45. https: //doi.org/10.1016/j.msec.2014.07.042
13.Matsuda M, Sakai K. Solute Removal Efficiency and Biocompatibility of the High Performance Membrane-From Engineering Points of View. in: Saito A, Kawanishi H, Yamashita AC,
Mineshima M (Eds.). High-Performance Membrane Dialyzers. Contrib Nephrol, Karger, Basel, 2011; l73: pp11-22.
14. Fukuda M, Kokubo K, Sakai K, Onishi G, Takewaki K, Hiyoshi T. Anisotropic differences in solute transfer rate through asymmetric membranes for blood purification accompanied by filtration. Biochem Eng J 1998; 2(2) :127–36.
https: //doi.org/10.1016/S1369-703X(98)00024-2.
15. Barzinb J, Fenga C, Khulbea KC, Matsuura T, Madaenic SS, Mirzadeh H. Characterization of polyethersulfone hemodialysis membrane by ultrafiltration and atomic force microscopy. J Membr Sci 2004; 237: 77–85.
https: //doi.org/10.1016/j.memsci.2004.02.029
16. Kaleekkal NJ, Thanigaivelan A, Tarun M, Mohan D. A functional PES membrane for hemodialysis-preparation, characterization and biocompatibility. Chinese J Chem Eng 2015;23: 1236–44.
https: //doi.org/10.1016/j.cjche.2015.04.009
17. Hayama M, Kohori F, Sakai K. AFM observation of small surface pores of hollow fiber dialysis membrane using highly sharpened probe. J Membr Sci 2002; 197: 243–249.
20
18. Yamamoto K, Hayama M, Matsuda M, Yakushiji T, Fukuda M, Miyasaka T, Sakai K. Evaluation of asymmetrical structure dialysis membrane by tortuous capillary pore diffusion
model. J Membr Sci 2007; 287: 88–93. http: //doi: 10.1016/j.memsci.2006.10.018.
19. Yamazaki K, Matsuda M, Yamamoto K, Yakushiji T, Sakai K. Internal and surface structure characterization of cellulose triacetate hollow fiber dialysis membranes. J Membr Sci. 2011; 368: 34–40.
http: //doi: 10.1016/j.memsci.2010.11.008.
20. Fukuda M, Saomoto H, Shimizu T, Namekawa K, Sakai K. Observation and proposed measurements of three-dimensional tortuous capillary pores with depth for hollow fiber hemoconcentrator membrane using dynamic force microscopy. Adv Biomed Eng 2019; 8: 145– 52.
https://doi.org/10.14326/abe.8.145.
21. Kanamori T, Sakai K, Fukuda M. Structural analysis of hemodialysis membranes by evaluating distribution volume of water contained in the membranes. J. Colloid Interface Sci 1995; 171: 361–5.
https: //doi.org/10.1006/jcis.1995.1191.
22.Investigated by Japanese Industrial Standards Committee. JAPANESE INDUSTRIAL STANDARD, Haemodialysers, haemodiafilters, haemofilters and haemoconcentrators JIS T 3250: 2013 (JMED/JSA). Published by Japanese Standards Relation, TOKYO, 2013
23. Ji Haifeng, Xu Hao, Jin Lunqiang, et al. Surface engineering of low-fouling and
hemocompatible polyethersulfone membranes via in-situ ring-opening reaction. J Membr Sci. 2019; 581: 373–382.
http: //doi: 10.1016/j.memsci.2019.03.082.
24. Koga Y, Fujieda H, Meguro H et al. Biocompatibility of polysulfone hemodialysis membranes and Its mechanisms: Involvement of fibrinogen and Its integrin receptors in activation of platelets and neutrophils. Artif Organs 2018; 42 (9) 246–258.
https: //doi.org/10.1111/aor.13268
25. Hedayat A, Szpunar J, Kumar NAP Kiran, Peace R, Elmoselhi H, Shoker A. Morphological characterization of the Polyflux210H hemodialysis filter pores. International Journal of Nephrology 2012, Article ID 304135, 6 pages
https: //doi.org/10.1155/2012/304135
26. Iwata H. Advanced polymer materials One Point 3 Biomaterials (in Japanese). Kyoritsu Shuppan, 2005, pp.5–45.
21
28. Kedem O, Katchalsky A. Thermodynamic analysis of the permeability of biological membranes to non-electrolytes. Biochi Biophys Acta 1958; 27: 229–46.
29. Kedem O, Katchalsky A. A physical interpretation of the phenomenological coefficients of membrane permeability. J Gen Physiol 1961; 45: 143–79.
30. Verniory A, Du Bois R, Decoodt P, Gassee, JP, Lambert, PP. Measurement of the permeability of biological membranes. Application to the glomerular wall. The Journal of General Physiology. 1973; 62: 489–507.
31. Klein E, Holland F, Lebeouf A, et al. Transport and mechanical properties of hemodialysis hollow fibers. J Membr Sci 1976; 1: 371–96.
32. Klein E, Holland F, Eberle K. Comparison of experimental and calculated permeability and rejection coefficients for hemodialysis membranes. J Membr Sci 1979; 5: 173–88.
33. Liao Z, Klein E, Poh CK, et al. Measurement of hollow fiber membrane transport properties in hemodialyzers. J Membr Sci 2005; 256: 176–83.
Acknowledgment
The authors gratefully thank Naomi Backes Kamimura (Kindai University) for helpful suggestions during preparation of the manuscript.
Author contributions
Makoto Fukuda: concept, design of the experiment, performed the experiment, data analysis/interpretation, wrote the paper.
Hiroki Yoshimoto: design of the experiment, performed the experiment, data analysis/interpretation. Hitoshi Saomoto: design of the experiment, performed the experiment, data analysis/interpretation, wrote the paper.
Kiyotaka Sakai: concept, design of the experiment, data analysis/interpretation, wrote the paper.
Conflict of interest
The authors have no conflicts of interest to declare.
This research was presented at IFAO2019 / JSAO2019 (Osaka).
Abbreviations (List of nomenclature)
A surface area (m2) AK surface porosity (-) c concentration (mg/mL)
22
f(q) friction coefficient of the of the pore walls and water with the solute in diffusion (-) H water content (v/v%)
Lp pure water permeability (mL/m2h mmHg) QB flow rate of blood side (mL/min)
QF filtration flow rate (mL/min) rp pore radius (nm)
SC sieving coefficient (-)
SD steric hindrance factor at the pore inlet in diffusion (-) Δx membrane thickness (µm)
![Fig. 1 Schematic diagram of a three-dimensional laminated structure model. [4]](https://thumb-us.123doks.com/thumbv2/123dok_us/1021163.1602143/3.595.101.521.136.429/fig-schematic-diagram-dimensional-laminated-structure-model.webp)