foraging human teams
Andrew J. King
1, Julia P. Myatt
2, Ines Fürtbauer
1, Nathan Oesch
3, Robin I. M. Dunbar
3,
Seirian Sumner
4, James R. Usherwood
5, Stephen Hailes
6& M. Rowan Brown
7Social density processes impact the activity and order of collective behaviours in a variety of biological
systems. Much effort has been devoted to understanding how density of people affects collective human motion in the context of pedestrian flows. However, there is a distinct lack of empirical data investigating the effects of social density on human behaviour in cooperative contexts. Here, we
examine the functioning and performance of human teams in a central-place foraging arena using high-resolution GPS data. We show that team functioning (level of coordination) is greatest at intermediate social densities, but contrary to our expectations, increased coordination at intermediate densities did not translate into improved collective foraging performance, and foraging accuracy was equivalent
across our density treatments. We suggest that this is likely a consequence of foragers relying upon
visual channels (local information) to achieve coordination but relying upon auditory channels (global
information) to maximise foraging returns. These findings provide new insights for the development of more sophisticated models of human collective behaviour that consider different networks for
communication (e.g. visual and vocal) that have the potential to operate simultaneously in cooperative contexts.
Models of collective animal behaviour in which every agent updates its trajectory based on the trajectories of its neighbours find that with an increasing density of agents, the system (i.e. the swarm, school, flock, or crowd) switches from a state of disordered movement to a state of coherent collective movement1,2. One of the best-known
and studied examples is pedestrian flow of human crowds. Models and empirical data3–5 show that at low densities,
pedestrians tend to move freely, and the behaviour of the crowd can be partially compared with the behaviour of gases. At intermediate densities, crowd motion becomes highly coordinated and ‘lanes’ of bidirectional flow develop spontaneously. At high densities, coordinated motion can break down and crowds typically show stop-and-go waves and crowd turbulence. Whilst much effort has been devoted to describing and predicting collective human motion in the context of pedestrian flows6, there is a distinct lack of empirical data investigating the effects of social
density on human behaviour in other relevant contexts7,8.
A fundamental human behaviour that is often dependent upon collective motion is foraging. In modern-day traditional societies, and in our evolutionary past, individuals have benefited from coordinating their movements and making collective decisions about how to obtain resources; searching for dispersed food sources in a patchy, uncertain environment, and then returning to a central location with this food resource9–11. Indeed, individual
search costs can be reduced, and group performance improved, if a number of foragers cooperate by coordinat-ing their behaviour and exchangcoordinat-ing information about encountered food items12–14. Despite the importance of
coordinated behaviour in a foraging context, we know very little about what factors predict the success or failure of such groups. Such knowledge may have important consequences for understanding the functioning of modern day teams and organisations15,16.
1Biosciences, College of Science, Swansea University, Singleton Park, Swansea, SA2 8PP, UK. 2Biosciences, University of Birmingham, Edgbaston, Birmingham, West Midlands, B15 2TT, UK. 3SENRG, Department of Experimental Psychology, South Parks Road, Oxford, OX1 3UD, UK. 4School of Biological Sciences, University of Bristol, Woodland Road, Bristol BS8 1UG, UK. 5Structure & Motion Laboratory, Royal Veterinary College, Hatfield, Hertfordshire, AL9 7TA, UK. 6Department of Computer Science, University College London, Gower Street, London WC1E 6BT, UK. 7College of Engineering, Swansea University, Bay Campus, Fabian Way, Swansea SA1 8EN. Correspondence and requests for materials should be addressed to A.J.K. (email: [email protected])
Given the importance of social density on the state and order of collective behaviours in a variety of non-human and human systems17–19, we test the hypothesis that social density processes similarly regulate the functioning and
performance of human teams in a cooperative foraging task20,21 (Fig. 1). In previous work, King et al.8 devised a
simple social foraging paradigm where people foraged in a patchy and uncertain environments. They showed that communication (and especially local communication via gesticulations) is a crucial aspect of the organisation of social coordination in small groups of people. Here, we used this setup to test a series of predictions with respect to both the functioning and performance of human teams at different social densities. If we assume random interac-tions among team members in a foraging arena of constant size, then the total number of interacinterac-tions among n team members would increase as n(n− 1). We use this simple paradigm to explore the functioning and performance of teams at low (N = 4), intermediate (N = 8, 12) and high (N = 24) social densities. By design, these group sizes are also similar to those preferred by (or which emerge in) modern societies and hunter-gatherer groups22–24. These
discrete (sub)grouping patterns are also thought to reflect hierarchical processing of social information in humans25,
and we therefore we assume our density treatments to represent ecologically relevant group sizes.
First, we explore team functioning. Often, in biological systems, coordination in the motion of individuals can have important fitness consequences, whereby more coordinated individuals can more effectively detect and respond to threats or potential resources16,26–29. Therefore we explore the coordination of foragers’ movements
during foraging as a measure of team ‘functioning’. We expected that at low forager density (N = 4) individuals would interact with one another at low rates owing to the potentially large inter-individual distances20, providing
little opportunity for information transfer via local communication21 and therefore show low coordination in their
movements. As forager densities increase (N = 8, 12) we expected this to afford higher rates of social interaction which would facilitate local information transfer and coordination among foragers30,31. At high forager densities
(N = 24), however, we expected coordination to break down as a consequence of congestion effects which may inhibit local information transfer32,33.
If the functioning of teams does change as a consequence of forager density, then we also expected that this would have consequences for team performance, and predicted intermediate densities to perform better for at least three interconnected reasons. First, the speed and accuracy of decision-making is predicted to be highest where there is opportunity for social information transfer34,35, and we expect local information transfer to be greater at
intermedi-ate densities (see above). Second, intermediintermedi-ate densities represent relatively larger teams that are predicted to outper-form smaller teams in terms of decision-making accuracy as a consequence of wisdom-of-crowd effects36,37 whereby
the aggregation of information across multiple individuals (pooling information) can result in decisions that are often better than the ones that could have been made by any single individual36,38. However, this information-pooling
benefit of larger groups is predicted to diminish as group size exceeds more than 20 individuals39.
Third, sports teams tend to be 12 ± 3 individuals because of assumed limits on individuals’ capacities to engage with each other (i.e., “sympathise”), and hence their ability to coordinate40. Thus, we expected that opportunity
for, and quality of, information-sharing to be maximised at intermediate densities.
Material and Methods
Subjects.
Visitors to the Royal Veterinary College Open Day on 7th May 2011 were invited to take part in ourexperiments. 144 English speakers (111 females, 33 males) aged 16–54 signed up prior to data collection, and were randomly assigned to mixed-sex team sizes of N = 4, 8, 12 and 24, since group sex ratios were not found to significantly alter foraging performance in small teams undertaking the same experiment8. Teams of 4, 8, 12, and
24 took part in the foraging task simultaneously at three different time slots throughout the day.
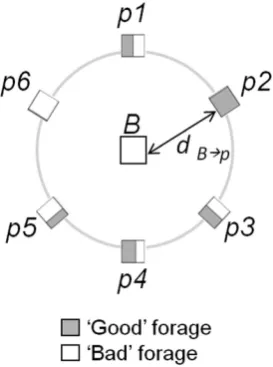
Figure 1. Foraging arena. The arena consisted of a circle (diameter 10 m) with a home base (B) at the centre and six foraging patches (squares p1, ..., p6) at the edge, arranged every π/3 radians. The distance between B and any patch (dB→p) and between neighbouring patches (e.g. dp1→ p2) was 5 m. The shaded portions of the foraging
their group performed. All experiments described here were approved by the Royal Veterinary College ethics committee, and performed in accordance with The British Psychological Society guidelines and regulations for conducting research with human participants.
Data collection.
Participants wore baseball caps carrying data loggers that comprised a microcontroller and a rechargeable 2,200 mAh lithium polymer battery which powered a GPS antennae and module that recorded single frequency L1 raw range data (uBlox LEA-4T GPS module). All data were collected at 1 Hz and stored on a micro-SD card. The same data-logger design with similar sampling regimes is described in Haddadi et al.41 andKing et al.27. All GPS devices were time synchronised to UTS, providing the position vector,
( ) = ( ) + ( ) + ( ) ,t x t y t z t
pi i j k for each individual (i), for the duration (T) of the experiment T = {0, τ , 2τ , …,
600τ }, τ = 1 second. These GPS data were used to explore the functioning and performance of teams as described below.
Social density.
Inter-individual forager distances were calculated across all dyads, for every second (τ ) so that we could explore the variability in inter-individual distances (the range) and the most frequent distance between participants, dijMo (Equation 1) as:∑
=− = , ≠( ( ) − ( )) ≠ ∀ ( )
N t t i j j m
d 1 p p
1 [ ] 1
Mo ij
i j i N
i j
1
Team functioning.
To examine functioning, we use the degree of coordination within teams, calculated as the velocity cross-correlation42,43C, between individuals i and j in time (Equation 2):τ
= 〈 ( ) ⋅ ( + )〉 ≠ ( )
Cij vi t vj t i j 2
Velocity cross-correlation is typically used to identify leader-follower dynamics within groups42. Here, we calculate
the mean velocity cross-correlation across all dyads Cij( )τ for τ between − 7 and + 7 seconds. We chose this time
period since foragers took a mean ± S.D. 7 ± 0.4 seconds to move between any foraging patch and the home base, and thus provides a coarse measure of how correlated the motion of the whole team was over a time period that is equivalent to one inward or outward movement. High mean values of Cij( )τ are thus indicative of coordinated
motion between foraging patches and the home base (i.e. groups with dyads that typically are travelling with similar acceleration and direction), whilst low mean values of Cij( )τ would suggest individuals move independently and do not tend to follow one another’s movements.
Performance of teams.
We calculated the distance travelled by an individual,dTi over the course of theexperiment (Equation 3) as:
∑
τ= ∆ ( )
( ) τ
= −
m
d p [ ]
3
Ti t T
i 0
2
where ∆ ( ) = ( + ) − ( )pi τ pi t τ pi t. We also calculated the time (s) that each person took to move to and from B,
at the centre, and one of the six foraging patches p1, …, p6 at the edge of the foraging arena. These measures gave us a measure of how quickly foragers were able to move towards and away from the available foraging patches.
fixed effect, and group identity (a-l) as a random effect (thus controlling for the non-independence of foragers movements in the same group). We compared means for: (i) the total number of forage items collected by teams of different size, (ii) the accuracy of foraging collected (good forage/total forage), and (iii) values of Cij( )τ using a
one-way Analysis of Variance (ANOVA) and Tukey’s range test for post-hoc analysis in SPSS45 (each dependent
variable was normally distributed as indicated by Shapiro-Wilk tests).
Results
Social density.
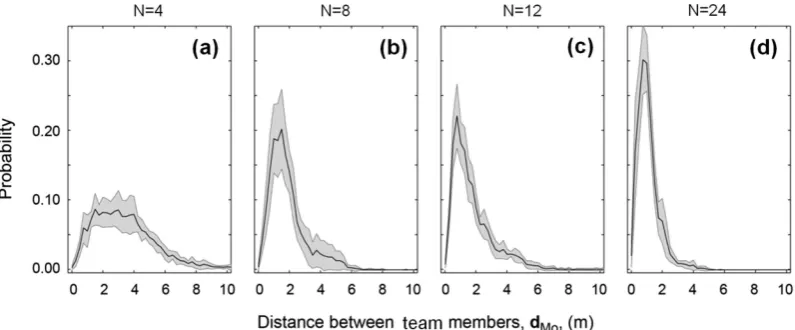
At low density (N = 4) inter-individual forager distances were highly variable, with indi-viduals typically observed at distances between 1.5 and 4 m (Fig. 2a). At high density (N = 24), inter-individual distances were more consistent, and tended to be just 0.95 m (Fig. 2b). Intermediate densities (N = 8 and N = 12), in contrast, showed the most frequent inter-individual distances at 1.65 m and 1.75 m respectively (Fig. 2c,d).Functioning.
Coordination, measured as mean values of Cij( )τ (Fig. 3a,b), differed according to densitytreatment (ANOVA: df563, F = 35.98, P< 0.001), and post-hoc tests indicated that teams at intermediate forager
densities (N = 8, N = 12) showed higher levels of coordination than teams at low (n = 4) or high (n = 24) densi-ties over the course of the experiments (Fig. 3c). Variation and maximum values of Cij( )τ are also instructive; N = 8 and N = 12 showed largest variation (Fig. 3c) and maximum cross-correlations were observed for τ
between − 1 and + 1, while teams of N = 4 and N = 24 showed less variation (Fig. 3c) and low cross-correlations for τ between − 1 and + 1. This suggests that individuals in teams of N = 8 and N = 12 were more likely to respond to each other’s movements, and did so especially quickly.
Performance.
Since inter-individual distances in N = 24 teams tended to be just 0.95 m, individuals experi-enced congestion effects that resulted in slower foraging trips; the time taken to move from the home base to an outer foraging patch and back was significantly slower in N = 24 teams compared to teams at other densities (N = 24 vs 12: LMM, Effect = − 2.51, SE = 0.72, t = − 3.50, P= 0.009; N = 24 vs 8: LMM, Effect − 2.67, SE 0.73, t = − 3.67, P= 0.006; N = 24 vs 4: LMM, Effect = − 2.61, SE = 0.79, t = − 3.31, P= 0.007). Teams of N = 4, 8, and 12 were not statistically different from each other in the time they took to move between patches and the home base (Fig. 4a). Distance travelled by teams was comparable across density treatments (N = 24 vs 12: LMM, Effect = − 0.65, SE = 0.37, t = − 1.78, P= 0.078; N = 24 vs 8: LMM, Effect 0.35, SE 0.40, t = 0.88, P= 0.383; N = 24 vs 4: LMM, Effect = − 0.30, SE = 0.57, t = − 0.54, P= 0.592). This suggests that N = 24 teams did not alter their movement paths between patches but did walk more slowly, resulting in the total amount of forage collected by individuals in N = 24 teams being significantly less than teams of other sizes (Fig. 4b; ANOVA, df83, F = 6.18,P= 0.018; Tukey’s tests: N = 24 vs. 4, P= 0.026; N = 24 vs. 8, P= 0.038; N = 24 vs. 12, P= 0.035). However, despite increased coordination at intermediate densities, and reduced total forage collected at the largest density treatment, team foraging accuracy was equivalent across our density treatments (ANOVA: df83, F = 0.82,
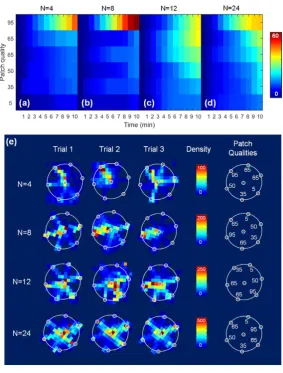
P= 0.517; Fig. 4c), and all teams converged on the best foraging patches half-way through the experiment (Fig. 5a–d), with N = 12 and N = 24 teams distributing their foraging effort across the best (95%) and next best (65%) quality patches (Fig. 5c,d).
Discussion
Our investigation into the functioning and performance of human teams in a central-place foraging arena, using high-resolution GPS data, has shown that team functioning (level of coordination in motion) is maximised at intermediate social densities, as predicted. Classic field experiments have shown that people tend to respond to the gaze direction of others, with the strength of response increasing with the number of other people already gazing46
In our experiments, foragers in intermediate density teams tended to be 1.65–1.75 m from one another, whilst foragers in low or high social density teams (N = 4, 24) were generally more than 3 m or less than 1 m from each other, respectively. These differences in inter-individual distances could have therefore been constraining visual channels (local information) at low densities (N = 4) and inhibiting it at high densities (N = 24), and this may offer an explanation for the differences in coordination we observed across our density treatments.
Coordinated patterns of behaviour in many group-living animals afford fast and accurate collective decisions where all (or the majority of) individuals adopt the same choice48,49, with coordination in mobile animal groups
(of both predators and prey) having important fitness consequences26,27,50. Here though, coordinated motion when
moving around the foraging arena had little consequence for the performance of teams since all teams showed similar levels of accuracy in foraging (Fig. 4c). In fact, it appears that being coordinated in motion when moving around the arena did not reflect either foraging accuracy (Fig. 4c) or the way in which teams used patches (Fig. 5a), with teams of N = 12, N = 24 tending to distribute their foraging efforts across the best (95%) and next best (65%) patches and N = 4 and N = 8 teams concentrating on the single best patch. Thus, whilst teams showed differing levels of coordination in motion, they all coordinated their decisions to relevant food patches. We believe that this may occur as a result of foragers’ ability to exchange information about the best foraging patches independent of their visual interaction ranges (i.e., via verbal communication). Indeed, earlier experiments by King et al.8 using
the same set-up with smaller groups (N = 2–5) found that conversation was constant throughout experiments, suggesting verbal communication may allow information exchange across many members in a short time frame. These results therefore highlight the importance of considering not only different networks for communication (e.g. visual and vocal), but also different metrics to describe “coordination” of foragers in future works.
Although foraging performance was not statistically different across our different social densities, our data suggest that foraging in larger teams may enable foragers to reduce variance in the proportion of good forage collected51. This can occur if the rates at which individuals choose to forage from the best food patch increases with
teams of N = 4 (blue), N = 8 (red), N = 12 (green) and N = 24 (purple) for τ between − 7 and + 7 seconds. Cij( )τ
is maximised between − 1 and + 1 seconds for N = 8 and N = 12 (upper part of whisker), whilst Cij( )τ is low for N = 4 and N = 24 for this period.
Figure 4. Foraging effort and performance. (a) Box and whisker plot illustrating range (whiskers), inter-quartile range (box), and median (line) time taken for individuals in teams of N = 4, 8, 12, and 24 to complete a foraging trip between the home base and a foraging patch. (b) Mean number of items of forage collected per individual as a function of team size. (c) Mean foraging accuracy at the end of experiments (total proportion of good forage collected) for teams of 4, 8 12 and 24 individuals (grey circles, this experiment). Data also shown for teams of 2–5 individuals (open circles) for 20 teams taken from King et al.8 collected using the same foraging
the number of other individuals choosing the patch46; this would result in a corresponding decrease in variance in
patch choices51. Therefore, the higher social density treatments could be experiencing a group-size related benefit
whereby their precision of foraging is improved. However, increased replicates of our experiments at larger group sizes would be required to test this hypothesis in a meaningful way.
In addition to quantifying different networks for communication and associated metrics to describe collective dynamics in future works (see above), another important direction for future work is to examine the relationship between functioning and performance of teams in repeated games, rather than the one-shot games studied here. The dynamics of coordination and cooperation can operate differently in repeated games52,53, and thus the functioning
and/or performance of teams may not hold true across repeated interactions38. Similarly, we do not yet know how
individual forager decisions are integrated and scale to the team performance; there are numerous mechanisms by which individual choices could lead to the team reaching consensus on the best foraging patches48. Exploring
the variety of different possible decision mechanisms will be important to understanding the mismatch between coordination and performance we observe here. Such insight will be key because it will pin-down the extent to which experiments like these help us understand the constraints on coordination/cooperation in human groups in other ecologically relevant tasks, for example, resource or predator defence54–56. As such, we anticipate that our
findings will inform the development of more sophisticated models of human collective behaviour that consider different communication networks that may operate simultaneously in cooperative contexts.
In summary, our experimental approach has produced quantitative and qualitative insights about how social density affects human behaviour in a cooperative context. We have used high resolution GPS tracking and
Figure 5. Forager decisions and accuracy. (a–d) show heat maps indicating the mean cumulative foraging visits by individuals to patches of different quality (y-axis) as a function of time with 1-minute bins (x-axis) in teams of N = 4, 8, 12 and 24 respectively. The colour bar represents the number of visits per individual forager, with warmer colours representing more visits. (e) The first three columns show the foraging arenas (large white circles) and foraging patches (small white circles at the arena edge) for three replicates at different social densities (rows). Each foraging arena has been divided into 1 m2 elements and the colour of each element is
National Academy of Sciences of the United States of America108, 6884–6888, doi: 10.1073/pnas.1016507108 (2011).
6. Helbing, D., Buzna, L., Johansson, A. & Werner, T. Self-organized pedestrian crowd dynamics: Experiments, simulations, and design solutions. Transportation Science39, 1–24, doi: 10.1287/trsc.1040.0108 (2005).
7. King, A. J., Johnson, D. D. P. & Van Vugt, M. The origins and evolution of leadership. Current Biology19, R911–R916, doi: 10.1016/j. cub.2009.07.027 (2009).
8. King, A. J. et al. Performance of human groups in social foraging: the role of communication in consensus decision making. Biology Letters7, 237–240, doi: 10.1098/rsbl.2010.0808 (2011).
9. Hawkes, K., O’Connell, J. F. & Jones, N. G. B. Hunting and nuclear families - Some lessons from the Hadza about men’s work. Current Anthropology42, 681–709, doi: 10.1086/322559 (2001).
10. Kaplan, H. S., Hooper, P. L. & Gurven, M. The evolutionary and ecological roots of human social organization. Philosophical Transactions of the Royal Society B-Biological Sciences364, 3289–3299, doi: 10.1098/rstb.2009.0115 (2009).
11. Marlowe, F. W. Hunter-gatherers and human evolution. Evolutionary Anthropology14, 54–67, doi: 10.1002/evan.20046 (2005). 12. Galef, B. G. & Giraldeau, L. A. Social influences on foraging in vertebrates: causal mechanisms and adaptive functions. Animal
Behaviour61, 3–15, doi: 10.1006/anbe.2000.1557 (2001).
13. Laland, K. N. Social learning strategies. Learning & Behavior32, 4–14 (2004).
14. Valone, T. J. From eavesdropping on performance to copying the behavior of others: a review of public information use. Behavioral Ecology and Sociobiology62, 1–14, doi: 10.1007/s00265-007-0439-6 (2007).
15. Sumner, S. & King, A. J. Actions speak louder than words in socially foraging human groups. Communicative and Integrative Biology
4, 755–777 (2011).
16. Dyer, J. R. G., Johansson, A., Helbing, D., Couzin, I. D. & Krause, J. Leadership, consensus decision making and collective behaviour in humans. Philosophical Transactions of the Royal Society B-Biological Sciences364, 781–789, doi: 10.1098/rstb.2008.0233 (2009). 17. Buhl, J. et al. From disorder to order in marching locusts. Science312, 1402–1406, doi: 10.1126/science.1125142 (2006). 18. Gueron, S., Levin, S. A. & Rubenstein, D. I. The dynamics of herds: From individuals to aggregations. Journal of Theoretical Biology
182, 85–98, doi: 10.1006/jtbi.1996.0144 (1996).
19. Szabo, B. et al. Phase transition in the collective migration of tissue cells: Experiment and model. Physical Review E74, doi: 06190810.1103/PhysRevE.74.061908 (2006).
20. Freeberg, T. M., Dunbar, R. I. M. & Ord, T. J. Social complexity as a proximate and ultimate factor in communicative complexity Introduction. Philosophical Transactions of the Royal Society B-Biological Sciences367, 1785–1801, doi: 10.1098/rstb.2011.0213 (2012). 21. Freeberg, T. M., Ord, T. J. & Dunbar, R. I. M. The social network and communicative complexity: preface to theme issue Preface.
Philosophical Transactions of the Royal Society B-Biological Sciences367, 1782–1784, doi: 10.1098/rstb.2011.0294 (2012). 22. Dunbar, R. I. M. The social brain: Mind, language, and society in evolutionary perspective. Annual Review of Anthropology32,
163–181, doi: 10.1146/annurev.anthro.32.061002.093158 (2003).
23. Dunbar, R. I. M. Cognitive constraints on the structure and dynamics of social networks. Group Dynamics-Theory Research and Practice12, 7–16, doi: 10.1037/1089-2699.12.1.7 (2008).
24. Fuchs, B., Sornette, D. & Thurner, S. Fractal multi-level organisation of human groups in a virtual world. Scientific Reports4, doi: 652610.1038/srep06526 (2014).
25. Zhou, W. X., Sornette, D., Hill, R. A. & Dunbar, R. I. M. Discrete hierarchical organization of social group sizes. Proceedings of the Royal Society B-Biological Sciences272, 439–444, doi: 10.1098/rspb.2004.2970 (2005).
26. Ioannou, C. C., Guttal, V. & Couzin, I. D. Predatory Fish Select for coordinated collective motion in virtual prey. Science337,
1212–1215, doi: 10.1126/science.1218919 (2012).
27. King, A. J. et al. Selfish-herd behaviour of sheep under threat. Current Biology22, R561–R562 (2012).
28. King, A. J. Follow me! I’m a leader if you do; I’m a failed initiator if you don’t? Behavioural Processes84, 671–674, doi: 10.1016/j. beproc.2010.03.006 (2010).
29. King, A. J., Sueur, C., Huchard, E. & Cowlishaw, G. A rule-of-thumb based on social affiliation explains collective movements in desert baboons. Animal Behaviour82, 1337–1345, doi: 10.1016/j.anbehav.2011.09.017 (2011).
30. Cao, T. T. High social density increases foraging and scouting rates and induces polydomy in Temnothorax ants. Behavioral Ecology and Sociobiology67, 1799–1807, doi: 10.1007/s00265-013-1587-5 (2013).
31. Pacala, S. W., Gordon, D. M. & Godfray, H. C. J. Effects of social group size on information transfer and task allocation. Evoutionary Ecology. 10, 127–165, doi: 10.1007/bf01241782 (1996).
32. Cao, T. T. & Dornhaus, A. Ants under crowded conditions consume more energy. Biology Letters4, 613–615, doi: 10.1098/ rsbl.2008.0381 (2008).
33. Hoogendoorn, S. P. & Daamen, W. Pedestrian behavior at bottlenecks. Transportation Science39, 147–159, doi: 10.1287/trsc.1040.0102 (2005).
34. Ward, A. J. W., Sumpter, D. J. T., Couzin, L. D., Hart, P. J. B. & Krause, J. Quorum decision-making facilitates information transfer in fish shoals. Proceedings of the National Academy of Sciences of the United States of America105, 6948–6953, doi: 10.1073/ pnas.0710344105 (2008).
35. Conradt, L. & Roper, T. J. Consensus decision making in animals. Trends in Ecology & Evolution20, 449–456 (2005).
36. Krause, J., Ruxton, G. D. & Krause, S. Swarm intelligence in animals and humans. Trends in Ecology & Evolution25, 28–34, doi: 10.1016/j.tree.2009.06.016 (2010).
37. Couzin, I. D. Collective cognition in animal groups. Trends in Cognitive Sciences13, 36–43, doi: 10.1016/j.tics.2008.10.002 (2009). 38. Katsikopoulos, K. V. & King, A. J. Swarm intelligence in animal groups: when can a collective out-perform an expert? Plos One5,
39. King, A. J. & Cowlishaw, G. When to use social information: the advantage of large group size in individual decision making. Biology Letters3, 137–139, doi: 10.1098/rsbl.2007.0017 (2007).
40. Buys, C. J. & Larson, K. L. Human sympathy groups. Psychology Reports45, 547–553 (1979).
41. Haddadi, H. et al. Determining association networks in social animals: choosing spatial-temporal criteria and sampling rates.
Behavioral Ecology and Sociobiology65, 1659–1668, doi: 10.1007/s00265-011-1193-3 (2011).
42. Nagy, M., Akos, Z., Biro, D. & Vicsek, T. Hierarchical group dynamics in pigeon flocks. Nature464, 890–U899, doi: 10.1038/ nature08891 (2010).
43. Nagy, M. et al. Context-dependent hierarchies in pigeons. Proceedings of the National Academy of Sciences of the United States of America110, 13049–13054, doi: 10.1073/pnas.1305552110 (2013).
44. R Core Team (2013). R: A language and environment for statistical computing. R Foundation for Statistical Computing, Vienna, Austria. URL http://www.R-project.org/.
45. SPSS Inc. (2008). SPSS Statistics for Windows, Version 17.0., Chicago, IL, USA URL: http://www-01.ibm.com/software/analytics/ spss.
46. Milgram, S., Bickman. L. & L, B. Note on the drawing power of crowds of different size. Journal of Personality and Social Psychology
13, 79–82 (1969).
47. Gallup, A. C. et al. Visual attention and the acquisition of information in human crowds. Proceedings of the National Academy of Sciences of the United States of America109, 7245–7250, doi: 10.1073/pnas.1116141109 (2012).
48. Conradt, L. & List, C. Group decisions in humans and animals: a survey. Philosophical Transactions of the Royal Society B-Biological Sciences364, 719–742, doi: 10.1098/rstb.2008.0276 (2009).
49. Couzin, I. D. & Krause, J. In Advances in the Study of Behavior, Vol 32 Advances in the Study of Behavior (eds P. J. B. Slater, J. S. Rosenblatt, C. T. Snowdon, & T. J. Roper) 1–75 (2003).
50. Handegard, N. O. et al. The dynamics of coordinated group hunting and collective information transfer among schooling prey. Current Biology22, 1213–1217, doi: 10.1016/j.cub.2012.04.050 (2012).
51. Krebs, J. R. Social-learning and significance of mixed-species flocks of chickadees (parus spp). Canadian Journal of Zoology-Revue Canadienne De Zoologie51, 1275–1288, doi: 10.1139/z73-181 (1973).
52. Binmore, K. G. & Samuelson, L. Evolutionary stability in repeated games played by finite automata. Journal of Economic Theory57,
278–305, doi: 10.1016/0022-0531(92)90037-i (1992).
53. Fudenberg, D. & Maskin, E. Evolution and cooperation in noisy repeated games. American Economic Review80, 274–279 (1990). 54. Willems, E. P., Hellriegel, B. & van Schaik, C. P. The collective action problem in primate territory economics. Proceedings of the Royal
Society B-Biological Sciences280, doi: 2013008110.1098/rspb.2013.0081 (2013).
55. Axelrod, R. & Hamilton, W. D. The evolution of cooperation. Science211, 1390–1396, doi: 10.1126/science.7466396 (1981). 56. Granovetter, M. Threshold models of collective behavior. American Journal of Sociology83, 1420–1443, doi: 10.1086/226707 (1978).
Acknowledgements
Thanks to Alan Wilson and Jennifer Morton for lending the Royal Veterinary College designed data-loggers used in this experiment, John Lowe and Christopher Hobson for providing logistical support, and to Sam Hailes, Lawrence Cheng, Sandra Starke, Ida Bacon, Penelope Hudson, and Zoe Self for help conducting experiments. This work was supported by an RVC ‘Pubic Engagement Grant’ and NERC Fellowship (NE/H016600/3) awarded to AJK. JPM was supported by an EPSRC grant (EP/H013016/1). IF was supported by a DFG Fellowship (FU-985/1-1). ON and RD are supported by an ERC Advanced Researcher grant to RD. MRB was supported by an EPSRC grant (EP\M00061\1).
Author Contributions
A.J.K., S.S., N.O. and R.I.M.D. designed the experiment, A.J.K., J.P.M., S.H. and J.R.U. performed the experiments and collected the data, J.R.U. and S.H. processed data, and A.J.K., I.F. and M.R.B. performed the analyses. A.J.K. and I.F. wrote the first draft of the manuscript, and all authors contributed substantially to revisions.
Additional Information
Competing financial interests: The authors declare no competing financial interests.
How to cite this article: King, A. J. et al. Social density processes regulate the functioning and performance of foraging human teams. Sci. Rep.5, 18260; doi: 10.1038/srep18260 (2015).