Nat. Hazards Earth Syst. Sci., 12, 639–649, 2012 www.nat-hazards-earth-syst-sci.net/12/639/2012/ doi:10.5194/nhess-12-639-2012
© Author(s) 2012. CC Attribution 3.0 License.
Natural Hazards
and Earth
System Sciences
Cloud-to-ground lightning in Portugal: patterns and
dynamical forcing
J. A. Santos1, M. A. Reis1, J. Sousa2, S. M. Leite1, S. Correia3, M. Janeira2, and M. Fragoso3
1Centre for the Research and Technology of Agro-Environmental and Biological Sciences, University of Tr´as-os-Montes e Alto Douro, Vila Real, Portugal
2Instituto de Meteorologia, 1749 Lisboa, Portugal
3Centre for Geographical Studies, Institute of Geography and Spatial Planning, University of Lisbon, Lisboa, Portugal
Correspondence to: J. A. Santos ([email protected])
Received: 6 January 2012 – Revised: 8 February 2012 – Accepted: 12 February 2012 – Published: 16 March 2012
Abstract. An analysis of the cloud-to-ground discharges
(CGD) over Portugal is carried out using data collected by a network of sensors maintained by the Portuguese Meteoro-logical Institute for 2003–2009 (7 yr). Only cloud-to-ground flashes are considered and negative polarity CGD are largely dominant. The total number of discharges reveals a consid-erable interannual variability and a large irregularity in their distribution throughout the year. However, it is shown that a large number of discharges occur in the May–September period (71 %), with a bimodal distribution that peaks in May and September, with most of the lightning activity recorded in the afternoon (from 16:00 to 18:00 UTC). In spring and au-tumn the lightning activity tends to be scattered throughout the country, whereas in summer it tends to be more concen-trated over northeastern Portugal. Winter generally presents low lightning activity. Furthermore, two significant cou-plings between the monthly number of days with discharges and the large-scale atmospheric circulation are isolated: a regional forcing, predominantly in summer, and a remote forcing. In fact, the identification of daily lightning regimes revealed three important atmospheric conditions for trigger-ing lightntrigger-ing activity: regional cut-off lows, cold troughs induced by remote low pressure systems and summertime regional low pressures at low-tropospheric levels combined with a mid-tropospheric cold trough.
1 Introduction
The scientific research on cloud-to-ground (hereafter, CG) lightning activity in the Iberian Peninsula started in the late 1990s, shortly after the installation, in Spain, of a light-ning detection network (from now on indicated as LDN) by the Agencia Estatal de Meteorolog´ıa (AEMET, Spain). The
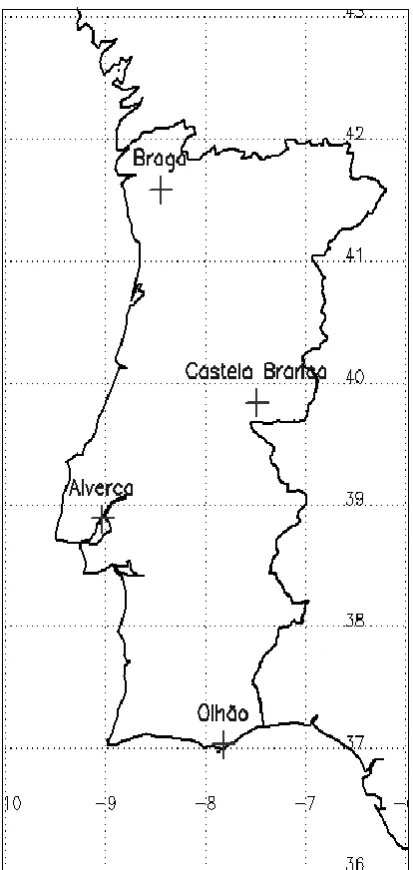
LDN provides an accurate lightning location by employing multiple sensors of their characteristic electric and magnetic fields (e.g. Rakov and Uman, 2003; Poelman, 2010). These sensors are of the same type as those used in other networks, like in the United States LDN (Orville, 1999; Cummins et al., 1998). A similar technology (model IMPACT-141-ESP) has also been used on the installation of the Portuguese LDN, which took place in June 2002 (Carvalho et al., 2003; Ramos et al., 2007) and integrates four sensors (Fig. 1).
Details about the network installation were briefly de-scribed by Ramos et al. (2007) and Rodrigues et al. (2008), showing that the choice of equipment and site location was designed in order to complement the Spanish LDN. This ap-proach thus provides a shared lightning observational sys-tem for the two owner institutions (Instituto de Meteorologia, Portugal, and AEMET, Spain), with obvious advantages on the lightning detection efficiency and location accuracy over both countries.
After a few years of CG lightning observations in Spain, the first studies dealing with the analysis of the main spatial patterns and temporal rhythms of the phenomenon emerged, attempting a preliminary climatological character-ization. Using five years of CG lightning data (1992–1996), Areitio et al. (2001) performed a study on this subject for the Spanish Basque Country. Rivas-Soriano et al. (2001a) anal-ysed these general features over the three-year period 1992– 1994 for the whole continental territory of Spain, a study that would be later retaken and extended by Rivas-Soriano et al. (2005), developing a ten-year climatological synthesis. These authors showed that the spatial distribution of the an-nual average of CG flash densities in Iberia (estimated over 0.2◦ latitude × 0.2◦ longitude grid cells) reveals maxima amounts highly correlated with orography. Still in the pre-vious study, the CG flash frequency and its associated spatial
640 J. A. Santos et al.: Cloud-to-ground lightning in Portugal
LIGHTNING IN PORTUGAL: PATTERNS AND FORCING
29
645
Figure 1. Map showing the geographical location of the electrical discharges sensors in
646
Portugal.
647
648
Fig. 1. Map showing the geographical location of the electrical
dis-charges sensors in Portugal.
distribution also showed a strong interannual variability. The intra-annual variation, diurnal cycle, polarity, multiplicity and peak current of the CG lightning activity were also dis-cussed in detail.
Beyond these climatological studies, with emphasis on the descriptive characterization of spatial and temporal patterns of CG lightning activity in Iberia using the Spanish LDN, several investigations have been produced focusing on other related topics, such as the study of the synoptic atmospheric forcings on thunderstorm activity (e.g. Lericos et al., 2002; Huyn et al., 2009). A classification of circulation weather types associated with daily counts of CG lightning events in the Iberian Peninsula (1992–1994) was performed by Tomas
et al. (2004), by using an automated version of the Lamb weather types adapted for this region (Trigo and DaCamara, 2000; Paredes et al., 2006). Rivas-Soriano et al. (2004) and De Pablo and Rivas-Soriano (2007) investigated the relation-ship between the North Atlantic Oscillation (NAO) and both convective precipitation and CG lightning in Iberia during winter months. Their findings revealed that lower (nega-tive) values of the NAO index favour relatively strong light-ning activity, particularly over Western Iberia. The relation-ship between lightning activity and convective precipitation is another relevant issue that has been explored over the last years (e.g. Petersen and Rutledge, 1998; Lang and Rutledge, 2002). Rivas-Soriano et al. (2001b), Rivas-Soriano and De Pablo (2003) and Pineda et al. (2007) have also addressed this subject for the warm season in Iberia.
Several studies have been performed to analyse the influ-ence of ground characteristics in lightning induction or en-hancement, by investigating bivariate or multivariate rela-tionships. The surface features analysed include air surface temperatures (e.g. Pinto and Pinto, 2008), sea surface tem-peratures (e.g. Altaratz et al., 2003; Tinmaker et al., 2010), elevation parameters (e.g. Dissing and Verbyla, 2003), lake-effects (e.g. Steiger et al., 2009), land use (e.g. Rozoff et al., 2003), type of vegetation (e.g. Carleton et al., 2008), fire scars (Kilinc and Beringer, 2007), among others. Rivas-Soriano et al. (2001c) studied the dependence of lightning in Castilla-Le´on (Spain) on geo-orographical factors by using multiple linear regressions.
However, the lighting analysis using the Portuguese LDN is still relatively incipient and few published materials have been produced so far. A seven-year study (2003–2009) on CG lightning activity over the Portuguese mainland (i.e., ex-cluding the Azores and Madeira archipelagos) was carried out by Ramos et al. (2011). This study focusses on spatial and temporal variability of CG lightning and its association with general circulation weather types (not specifically re-lated to lightning activity). In line with the previous study, the aim of the present work is not only to analyse the tem-poral and spatial variability of cloud-to-ground discharges (herein CGD), using advanced and complementary statistical methods, but also to isolate the dynamical atmospheric forc-ing on CGD and the underlyforc-ing lightnforc-ing regimes, specifi-cally linked to lightning activity in Portugal. As such, the temporal distributions (at hourly, monthly, seasonal and an-nual scales) and the spatial patterns of CGD (regarding lat-itude, orography and continentality), as well as their con-nections to general circulation patterns, are analysed in the present study.
Section 2 presents a description of the datasets and methodological approaches; Sect. 3 analyses the tempo-ral and spatial variability of CGD in Portugal and the corresponding large-scale forcing, including the lightning regimes; lastly, in Sect. 4, a summary of the main results and their discussion are presented.
J. A. Santos et al.: Cloud-to-ground lightning in Portugal 641
2 Data and methods
For the analysis of the lightning activity in Portugal, CGD data collected by the Portuguese LDN in 2003–2009 (7 yr) are used. The LDN comprises four IMPACT 141T-ESP de-tectors over Portugal (Braga, Castelo Branco, Alverca and Olh˜ao; Fig. 1). As already mentioned, during the selected time period (2003–2009) data from five sensors near the Portuguese border were also provided by the Spanish Na-tional Meteorology Institute (AEMET) and assimilated in the dataset. The LDN employs three methods for lightning loca-tion: time-of-arrival, magnetic direction finding and a com-bination of the two. Moreover, the LDN provides current peak measurements, number of return strokes and a differen-tiation between cloud-to-ground and intracloud discharges. This study focusses mainly on the cloud-to-ground (CG) discharges occurring over continental Portugal and all dis-charges with intensities below 1 kA are disregarded.
The original dataset was then gridded onto a regular 0.1◦ latitude× 0.1◦ longitude grid (spatial resolution of nearly 10 km), covering only the Portuguese territory (target area). The gridded CGD density (in flashes.km-2) is a derived vari-able that was computed using the corresponding grid box area. The monthly number of CGD days corresponds to the total number of days per month with at least one flash recorded within the target area. All the analyses presented herein are based on this gridded CGD dataset, using only grid cells covering the Portuguese mainland.
In order to relate the CGD occurrences with the large-scale atmospheric flow, several atmospheric fields were selected: geopotential height at 1000 and 500 hPa, air temperature at 500 hPa, and 10 m horizontal wind components (zonal and meridional). These gridded data are available over a 1.25◦ latitude×1.25◦longitude grid and were extracted from the Japanese reanalysis dataset, produced by the Japan Meteoro-logical Agency (JMA) – Central Research Institute of Elec-tric Power Industry (CRIEPI). A detailed description of this dataset can be found in Onogi et al. (2007). The best 4-layer lifted index was provided by the University Corporation for Atmospheric Research (UCAR), and is available at a spatial resolution of 1◦latitude×1◦longitude.
Two multivariate statistical methodologies were applied in the present study: canonical correlation analysis (CCA), coupled with a principal component analysis (PCA), and K-means clustering (KMEANS). These approaches have been widely applied in atmospheric research and are described in detail in many scholar books (e.g., Wilks 2006), thus not be-ing explained here.
The PCA is applied to the monthly number of CGD days in order to filter out the variability of this field for the CCA, following the approach proposed by Barnett and Preisendor-fer (1987). All months are jointly analysed because their seasonal split would lead to only 21-months sample sizes (in-stead of the 84-months in the current analysis), which is man-ifestly insufficient for ensuring the statistical significance of
the resulting modes. The PCA was applied to the covariance matrix of the raw data and the resulting empirical orthogo-nal functions/patterns (EOF) are of unit variance and will not be rotated. The CCA was applied to isolate the main modes of coupled variability between the large-scale atmospheric circulation (assessed by the monthly mean 1000 hPa geopo-tential height) and the monthly number of CGD days. Ac-cordingly, the leading three (six) principal components of the monthly mean 1000 hPa geopotential height (monthly num-ber of CGD days) were retained for CCA, representing 83 % (71 %) of the total temporal variance. Not surprisingly, the number of components to retain in the CGD field is superior to the geopotential field, which is a reflection of the stronger spatial and temporal variability in the former field.
The KMEANS was applied so as to identify the relevant CGD (lightning) regimes in Portugal on a daily basis. This methodology was applied to the raw daily 1000 hPa geopo-tential heights within the geographical sector (25◦–65◦N; 30◦W–10◦E), but only for days with at least 25 discharges (median of the non-zero daily discharges) over the target area. Therefore, these regimes are specifically developed for days with a reasonably high lightning activity in Portugal. A higher threshold (e.g. 75th percentile) would lead to an ex-cessively small number of days for clustering, while a lower threshold (e.g. 25th percentile) would include days with low (and perhaps local) lightning activity that may not be clearly coupled to large-scale atmospheric features. Days are keyed to a given cluster (regime) according to the corresponding Euclidean distance.
Based on the mean temporal distribution of the CGD in Portugal, clustering was undertaken for two periods sepa-rately: wintertime (October–April) and summertime (May– September). Again no seasonal corrections or transforma-tions were applied to the data; most of the seasonality is im-plicitly accounted for when considering the wintertime and summertime periods. The choice of the number of clus-ters was carried out taking into account the feasibility of the associated mean synoptic patters, rather than considering a “blind” pure statistical measure. In fact, it was found that only for a wintertime period the clustering is effective in dis-tinguishing two different dynamical atmospheric conditions; other solutions led to physically meaningless classifications into clusters that do not feature clearly independent dynami-cal structures.
3 Results
3.1 Temporal variability
The CGD totals recorded over Portugal present a yearly av-erage number of approximately 26×103occurrences. They also depict a large interannual variability in 2003–2009 (Fig. 2). For instance, the total number of CGD in 2005 was only about 16×103, while in 2007 it was roughly 46×103,
642 LIGHTNING IN PORTUGAL: PATTERNS AND FORCING J. A. Santos et al.: Cloud-to-ground lightning in Portugal
30 649
Figure 2. Inter-annual variability of the AEDCGD recorded over Portugal in the time
650
period from 2003 to 2009.
651 652
Fig. 2. Interannual variability of the CGD recorded over Portugal
in the time period from 2003 to 2009.
i.e., three times the former value. Furthermore, there is also a strong intraseasonal variability (Fig. 2), though winter by far presents the lowest numbers: 4 % of all CGD occur in winter (DJF), 30 % in spring (MAM), 30 % in summer (JJA) and 36 % in autumn (SON).
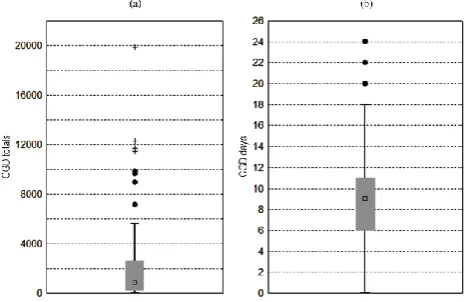
The strong irregularity is also highlighted by the monthly CGD totals in 2003–2009 (84 months). They show a large inter-monthly variability (Fig. 3a), with an absolute maxi-mum of 19 840 discharges, absolute minimaxi-mum of 0 (3 months without occurrences), first (third) quartile of 232 (2637) dis-charges and a median of 833 disdis-charges. The non-outlier maximum is of 5619 discharges. It should be stressed that the outliers in the box-plot are not erroneous values (they were effectively observed), but they are rather extreme occur-rences in months with strong electrical activity over large ar-eas of the country. As an illustration, the absolute maximum (19 840 CGD) occurred in September of 2007, mainly dur-ing a 13-day length episode (9–21 September), with a peak at the 10th of September (4952 CGD), and covering most of the Portuguese mainland, particularly its southern half. This ex-ceptional situation was associated with a cut-off low pressure system centered just westwards of Portugal (500 hPa geopo-tential height; not shown).
A large inter-monthly variability is also shown by the monthly number of CGD days during the same period (Fig. 3b). The total number of CGD days recorded in Portu-gal for 2003–2009 is 753. An absolute maximum of 24 days (April 2007, with a peak of 2632 discharges on 11 April) and an absolute minimum of 0 (January 2004, 2005 and July 2007) are depicted. Also shown are the first (third) quartile of 6 (11) days and median of 9 days. The non-outlier maximum is of 18 days. Despite the positive skewness still existing in this variable (Fig. 3b), it is noticeably lower than in the CGD totals (Fig. 3a). In fact, the upper limit of 31 days in the monthly number of CGD days underlies the lower skewness of its empirical distribution.
The occurrences of CGD over Portugal also reveal marked seasonal and daily cycles (Fig. 4). The CGD totals have peak
LIGHTNING IN PORTUGAL: PATTERNS AND FORCING
31 653
Figure 3. Box-plots of the distributions of (a) monthly AEDCGD totals; (b) monthly
654
number of AEDCGD days in 2003-2009 over Portugal. Box lower (upper) limits
655
correspond to the 25th (75th) percentile and lower (upper) whisker limits correspond to 656
the non-outlier minima (maxima). Medians are indicated by □. Outliers (extremes) are
657
values above the upper box limits of at least 1.5 (3.0) x IQR (interquartile range or box
658
height) and are indicated by • (+).
659
Fig. 3. Box-plots of the distributions of (a) monthly CGD totals; (b)
monthly number of CGD days in 2003–2009 over Portugal. Box lower (upper) limits correspond to the 25th (75th) percentile and lower (upper) whisker limits correspond to the non-outlier minima (maxima). Medians are indicated by squares. Outliers (extremes) are values above the upper box limits of at least 1.5 (3.0)×IQR (interquartile range or box height) and are indicated by circles (+).
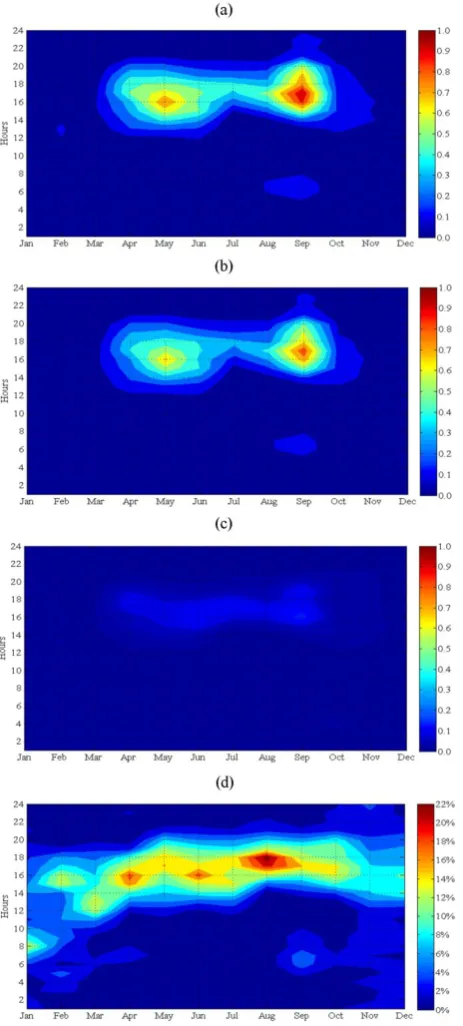
occurrences in May and September (bimodal distribution) and very low occurrences in the period November–March (Fig. 4a). The daily cycle reveals a clear prevalence for the occurrence of CGD in the afternoon, particularly in the pe-riod from 16:00 to 18:00 UTC, with the exception of winter, when no clear preference is identified. Although the abso-lute maximum occurs in September, it is significantly influ-enced by the extreme electrical activity recorded in Septem-ber of 2007 (previously referred event). In fact, excluding this episode, a maximum remains in September, but with much lower relative amplitude (not shown). Hence, due to the relatively short period of available data (7 yr), it cannot be concluded, at this stage, that autumn activity is stronger than spring activity. However, on the whole, it can be stated that late spring and early autumn tend to be the most favourable periods for electrical activity in Portugal.
The negative-polarity CGD largely dominates over the positive-polarity CGD (Fig. 4b, c). Both the seasonal and daily cycles are quite similar to those already described in the CGD totals (Fig. 4a). The hourly relative contributions to the total CGD in each month highlight the previous re-sults (Fig. 4d), by showing maximum contributions in the period from 14:00 to 20:00 UTC. The maxima also tend to follow the thermal daily cycle, with summer maxima occur-ring at late afternoon and winter maxima at midday or early afternoon. In December, interestingly, the maximum occurs at 08:00 UTC, which suggests that mechanisms other than thermally-induced processes may trigger the electrical activ-ity, such as frontal activity originating in the North Atlantic and enhanced by orographic effects.
With respect to the multiplicity of the electrical dis-charges (Fig. 5), it can be concluded that 66 % of them are
J. A. Santos et al.: Cloud-to-ground lightning in PortugalLIGHTNING IN PORTUGAL: PATTERNS AND FORCING 643
32 660
Figure 4. Month-hour distribution diagrams of the (a) normalized (unit maximum) total
661
AEDCGD; (b) normalized negative AEDCGD; (c) normalized positive AEDCGD; (d)
662
hourly relative contribution to total AEDCGD in each month (in percent) recorded over
663
Portugal in 2003-2009.
664
Fig. 4. Month-hour distribution diagrams of the (a) normalized
(unit maximum) total CGD; (b) normalized negative CGD; (c) nor-malized positive CGD; (d) hourly relative contribution to total CGD in each month (in percent) recorded over Portugal in 2003–2009.
single-stroke discharges (unit multiplicity). Further, most of the remaining discharges have multiplicity varying from 2 to 5 strokes (31 %) and only a tiny fraction (3 %) have multi-plicity greater than 5. As expected, negative CGD are
dom-LIGHTNING IN PORTUGAL: PATTERNS AND FORCING
33 665
Figure 5. Distribution (in percent) of the multiplicity (M) of AEDCGD recorded over
666
Portugal in 2003-2009.
667 668
Fig. 5. Distribution (in percent) of the multiplicity (M) of CGD
recorded over Portugal in 2003–2009.
LIGHTNING IN PORTUGAL: PATTERNS AND FORCING
34
669
Figure 6. Distribution of the number of AEDCGD days as a function of the areal
670
extension (%) of CGD detection over total area of occurrence over Portugal in 2003-671
2009 (1% of total area corresponds to approximately 28 grid cells). 672
673
Fig. 6. Distribution of the number of CGD days as a function of the
areal extension (%) of CGD detection over Portugal in 2003–2009 (1 % of total area corresponds to approximately 28 grid cells).
inant over positive CGD in all classes of multiplicity, being 50 % versus 16 %, respectively, for unit multiplicity. These percentages fall for 29 % versus 2 %, respectively, for multi-plicity between 1 and 5 (1<M≤5).
3.2 Spatial variability
Regarding the spatial extension of the CGD, results show that 289 out of 753 days with at least one CGD (38 %) oc-cur over less than 0.25 % of the total target area (Portuguese mainland), which corresponds to at most 7 grid boxes; 59 % occur over less than 1 % of the total target area, which cor-responds to approximately 28 grid boxes (Fig. 6). Therefore, most of the CGD days present highly localized lightning ac-tivity, which is indeed a quite common characteristic of these events (e.g. Bentley and Stallins, 2005). Nevertheless, there is still a significant number of CGD days (41 %), covering more than 1 % of the target area (approximate aggregated area of a 50 km wide square box), which is a manifestation of larger-scale events, most of them also clearly related to anomalies in the large-scale atmospheric circulation, as will be shown below.
644 J. A. Santos et al.: Cloud-to-ground lightning in Portugal
Fig. 7. Map of the (a) mean; (b) kernel-smoothed (KS; 0.5◦latitude×0.5◦longitude) mean; (c) KS median of the CGD density; (d) KS percentile range (difference between the 90th and 10th percentiles) of the CGD density (number of discharges km−2yr−1)over Portugal in 2003–2009.
As the spatial patterns show high spatial irregularity, part of it likely related to the short time period of the available records (sample size of 7 yr); they are spatially filtered by a 0.5◦ latitude × 0.5◦ longitude kernel smoothing. In ef-fect, the non-smoothed mean pattern of the CGD density in 2003–2009 displays some relatively irrelevant irregularities that are smoothed out by the corresponding kernel-smoothed pattern (Fig. 7a, b). This pattern shows higher values over the inner (less maritime) parts of the country, giving evi-dence for important mesoscale convective mechanisms trig-gered by thermal and orographic conditions over land ar-eas (Fig. 7b). Annual mean flash density displays a max-imum of about 0.6 discharges.km−2yr−1. This is in clear agreement with the values over Portugal found by Rivas-Soriano et al. (2005), despite their use of a different dataset for a different time period, as previously mentioned. The median pattern clearly resembles the mean pattern (Fig. 7b, c), but with generally lower values, simply explained by the strong positive skewness in the temporal distribution of the CGD (cf. Fig. 3). The percentile range pattern (90th minus 10th percentile, Fig. 7d) also highlights the strong interan-nual variability (cf. Fig. 2), with higher values in the areas of higher occurrences.
The patterns of the CGD density, as well as of the CGD days, also present strong seasonality (Fig. 8). Winter shows quite low numbers in both CGD density and CGD days. These occurrences are mainly located along coastal areas, including the Tagus Estuary nearby, with almost no occur-rences or CGD days in northeastern Portugal (Fig. 8a). Dur-ing sprDur-ing there is a rather scattered pattern, with a maximum over southern Portugal and very low occurrences along the coastline (Fig. 8b). In summer, high occurrences are found over central and northern inner Portugal, with a clear
max-imum of CGD days over the northeasternmost part of the country (Fig. 8c). Lastly, in autumn, the occurrences of CGD are southerly shifted with respect to its summertime pattern, being essentially located over central and southern inner Por-tugal (Fig. 8d). This southern displacement suggests a migra-tion of the CGD-generating systems, accompanying the solar radiation seasonal cycle.
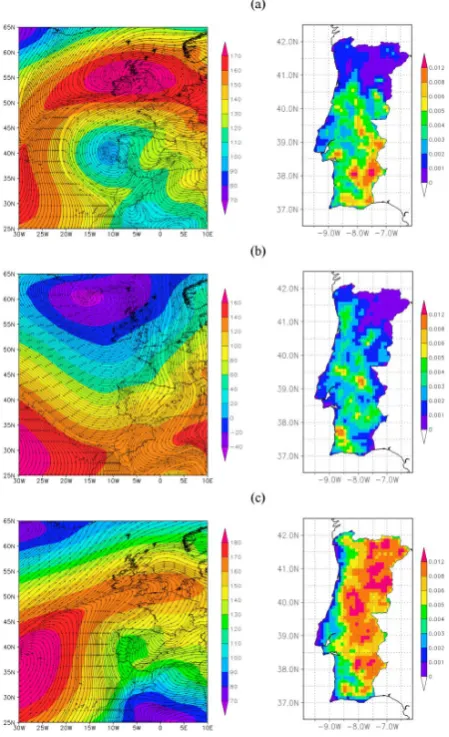
After a detailed analysis of the temporal and spatial vari-ability/distribution of the CGD occurrences in mainland Por-tugal, their likely connections to large-scale atmospheric fea-tures are now explored. As previously stated, the CCA was applied for this purpose and two statistically significant cou-pled modes are discussed here (Fig. 9). Their canonical cor-relations are of 0.50 and 0.27, respectively, and are statisti-cally significant according to the Bartlett-Lawley test.
The first coupled mode reveals an important connection between an inverted meridional pressure gradient (higher pressures at higher latitudes), with anomalously low pres-sure areas cantered over Iberia, and anomalously high CGD days over inland Portugal, particularly over its northeastern part (Fig. 9a). This mode mostly reflects summertime con-ditions, since the CGD pattern is quite similar to the corre-sponding summer pattern (Fig. 8c and right panel in Fig. 9a). This result is corroborated by the monthly mean amplitude of the respective canonical variable that peaks in summer (not shown). The second coupled mode suggests a clear relation-ship between low pressure systems northwestwards of Iberia and high CGD occurrences over northern Portugal and cen-tral coastal areas (Fig. 9b).
J. A. Santos et al.: Cloud-to-ground lightning in Portugal 645
LIGHTNING IN PORTUGAL: PATTERNS AND FORCING
36 680
Figure 8. Maps of the KS mean total
AEDCGD
density (
left panels
; number of
681discharges.km
-2.season
-1) and of the number of
AEDCGD
days recorded over Portugal
682(
right panels
) for (a) DJF; (b) MAM; (c) JJA and (d) SON in 2003-2009.
683684
Fig. 8. Maps of the KS mean total CGD density (left panels;
num-ber of discharges.km−2.season−1)and of the number of CGD days recorded over Portugal (right panels) for (a) DJF; (b) MAM; (c) JJA and (d) SON in 2003–2009.
LIGHTNING IN PORTUGAL: PATTERNS AND FORCING
37 685
Figure 9. Leading two coupled modes between the monthly mean JRA 1000 hPa
686
geopotential height (left panels; in gpm.SD-1) and the monthly totals of AEDCGD days
687
(right panels; in discharges.SD-1) over Portugal in 2003-2009. The canonical
688
correlations are of 0.50 and 0.27, respectively, both statistically significant according to
689
the Bartlett-Lawley test.
690
691
Fig. 9. Leading two coupled modes between the monthly mean
JRA 1000 hPa geopotential height (left panels; in gpm.SD−1)and the monthly totals of CGD days (right panels; in discharges.SD−1)
over Portugal in 2003–2009. The canonical correlations are of 0.50 and 0.27, respectively, both statistically significant according to the Bartlett-Lawley test.
3.3 Lightning regimes and their dynamical structures
Although the previous results give clues for important con-nections between CGD occurrences in Portugal and large-scale atmospheric flow, these relationships are further inves-tigated by the identification of CGD (lightning) regimes and by the analysis of their prevailing synoptic conditions. For the following analysis a new calendar of atmospheric electri-cal activity in Portugal was produced: only days with more than 25 discharges were selected (376 days out of 753 CGD days, about one half), which corresponds to the median of the discharges in all CGD days. This selection criterion al-lows retaining only the days with noteworthy lightning activ-ity. This subset of CGD days is called calendar CGD days (CCGD, henceforth).
After a careful analysis of both the dynamical feasibility of the synoptic patterns and of the respective sample sizes of each regime, three CGD regimes were eventually isolated: two for the period October–April (190 CCGD days) and one for May–September (186 CCGD days). These periods were selected taking into account the intra-annual variability of
646 LIGHTNING IN PORTUGAL: PATTERNS AND FORCING J. A. Santos et al.: Cloud-to-ground lightning in Portugal
38 692
Figure 10. Composite patterns of the three AEDCGD regimes over Portugal in
2003-693
2009: (a) WREG; (b) WREM; (c) SREG in the JRA 1000 hPa geopotential height and
694
streamlines of the JRA 10 m horizontal wind (left panels; shading in hPa) and in the KS
695
AEDCGD density (right panels; indischarges km-2.day-1).
696
Fig. 10. Composite patterns of the three CGD regimes over
Portu-gal in 2003–2009: (a) WREG; (b) WREM; (c) SREG in the JRA 1000 hPa geopotential height and streamlines of the JRA 10 m hori-zontal wind (left panels; shading in hPa) and in the KS CGD density (right panels; in discharges km−2.day−1).
the lightning activity in Portugal (seasonality), with two clear maxima in May and September (Fig. 4), defining respectively the onset and decay of summertime conditions. Hence, the period May–September encloses a typical summertime light-ning regime, whereas the period October–April contains two typical wintertime lightning regimes. In the May–September period there is a largely preponderant regime along with other residual regimes with untypical synoptic patterns, thus not justifying clustering. On the other hand, for the October– April period, the synoptic patterns for more than two regimes are not clearly differentiable from a dynamical viewpoint.
The composites in the 1000 hPa geopotential height for each CGD regime give hints at their dynamical character-istics (Fig. 10). As previously mentioned, for the period October–April (wintertime period) two CGD regimes were
LIGHTNING IN PORTUGAL: PATTERNS AND FORCING
39 697
Figure 11. As in Fig. 10, but now for the composites of the JRA 500 hPa air temperature
698
and geopotential field (left panels; shading in ºC and contours in gpm) and for the best
699
4-layer lifted index (right panels; in ºC).
700
Fig. 11. As in Fig. 10, but now for the composites of the JRA
500 hPa air temperature and geopotential field (left panels; shading in ◦C and contours in gpm) and for the best 4-layer lifted index (right panels; in◦C).
identified. The first CGD regime, with 115 days, shows a cut-off low pressure system westwards of Iberia, with strong southerly wind components over Portugal, and a high pres-sure system over the British Isles (left panel in Fig. 10a). This CGD regime is thus called winter regional regime (WREG). The associated composite of the CGD density shows that cut-off cyclones favor electrical activity over central and south-ern Portugal, while northsouth-ern Portugal generally experiences low lightning activity (right panel in Fig. 10a).
The second CGD regime, with 75 days, is associated with a trough extending from Iceland towards Portugal and with strong southwesterly wind components over Portugal (left panel in Fig. 10b). As this trough is linked to a low pres-sure system near Iceland (remote location to Portugal), it is called winter remote regime (WREM). The correspond-ing CGD density composite depicts a more scattered pattern than in the WREG, but again with very low occurrences over northeastern Portugal (right panel in Fig. 10b).
J. A. Santos et al.: Cloud-to-ground lightning in Portugal 647
In spite of the relatively large number of CGD occurrences within the summertime period (71 % of all CGD occur in May–September), only 186 days have more than 25 dis-charges over Portugal (about 50 % of the CCGD days). In fact, there is a considerable number of days with a small number of discharges. In addition, for the summertime pe-riod, it was not possible to clearly discriminate more than one CGD regime with noticeably different dynamical fea-tures/structures. Consequently, no classification scheme (or clustering) was actually applied to the May–September CGD days. The third CGD regime is thereby a typical summer-time regime, with 186 days, characterized by a low pressure system over Portugal and by a wide high pressure region, extending from the Azores anticyclone towards northern Eu-rope (left panel in Fig. 10c). Since this CGD regime is also characterized by a regional low pressure system, it is called summer regional regime (SREG). The associated CGD den-sity composite reveals widespread CGD occurrences over Portugal, particularly over the more inland and mountainous areas (right panel in Fig. 10c).
The dynamical characterization of the three aforemen-tioned regimes are now discussed in more detail by consid-ering the geopotential heights, temperatures and the best 4-layer lifted index (LI) at the 500 hPa isobaric level; the cor-responding composites are displayed in Fig. 11. The LI pat-terns mainly reflect large-scale conditions and do not take into consideration surface characteristics, such as topography and soils. Nonetheless, some surface parameters can have a preponderant role in determining the location, onset and de-velopment of thunderstorms and of CGD occurrences. This explains why the CGD occurrences do not precisely follow the LI pattern, also suggesting some surface modulation (cf. right panels in Figs. 10c and 11c). Additionally, it should be kept in mind that the LI composites are obtained by av-eraging many different daily fields, even though being keyed to the same regime, and their resulting patterns are then sub-stantially smoothed out and cannot be plotted and interpreted using the same scale as in an instantaneous synoptic chart.
For the WREG, the 500 hPa geopotential height field clearly presents the characteristic signature of a cut-off low system, with a cold-core equivalent barotropic structure (left panel in Fig. 11a). There is also evidence for a difluence of the prevailing westerly flow, with a clear separation be-tween the eddy-driven jet and the subtropical jet. The re-spective LI mean pattern reveals lower values (higher insta-bility) over southern Portugal, plainly justifying the higher CGD occurrences in this region during the WREG (cf. right panels in Fig. 10a and in Fig. 11a). The relatively high LI values over northeastern Portugal yield convective inhibition in the parcel vertical motions, explaining the very low CGD occurrences over this region.
During the WREM there is a clear mid-tropospheric baro-clinic trough (left panel in Fig. 11b) that is a signature of frontal systems, mostly cold fronts, which may lead to im-portant lightning activity over Portugal, predominantly in
southern Portugal and along the western coast (right panel in Fig. 10b). This geographical distribution is also corrobo-rated by the respective LI composite (right panel in Fig. 11b), with minimum values over southwestern Portugal.
In the SREG, the low pressure system over Iberia is an extension of the shallow (warm-core low) over northwestern Africa (left panel in Fig. 10c). In fact, this low-tropospheric inverted trough has often no signature at higher tropospheric levels, being commonly replaced by the North Atlantic anti-cyclonic ridge at 500 hPa (not shown). This is a typical sum-mer situation, often associated with low-tropospheric trans-ports of warm and relatively dry air masses coming from in-ner parts of the Iberian Peninsula and/or from North Africa towards Portugal. However, during the SREG, in particular, another feature plays a critical role on the development of un-stable conditions that may eventually generate thunderstorms and CGD occurrences: a mid-tropospheric cold trough over Portugal. This dynamical situation has potential to trigger deep convection and air parcel rising throughout the tropo-sphere, as is suggested by the corresponding mean LI pattern, with a clear minimum over southern inner Portugal (right panel in Fig. 11c). Moreover, low CGD occurrences along coastal regions are in clear agreement with their correspond-ingly high LI values.
4 Summary and discussion
A seven-year dataset of the CG lightning activity over the Portuguese mainland is analysed in the present study. On the whole, negative polarity is largely dominant over pos-itive polarity in the recorded CGD. The same result was achieved by Rivas-Soriano et al. (2005) for the Iberian Penin-sula, but using a different dataset mostly focused on Spain. Also single-stroke is largely dominant over multiple-stroke CGD for both negative and positive polarities. The same re-sults were also found by Areitio et al. (2001) for the Spanish Basque Country. In addition, strong temporal variability is detected in the CGD occurrences over Portugal, as well as over Spain (Rivas-Soriano et al., 2005). For instance, the to-tal CGD recorded in 2005 is nearly one third of 2007 and the coefficient of variation of the annual CGD totals is about 41 %. Furthermore, the monthly distribution of the CGD to-tals presents a very high positive skewness, i.e., there are few months with remarkably high occurrences, whilst most of them have relatively low occurrences.
Despite all the irregularities found in the CGD occur-rences, they are clearly more frequent in the period from May to September, particularly at the beginning and end of the summertime period; the winter CGD occurrences are relatively infrequent. The same results were achieved by Rivas-Soriano et al. (2001c, 2005) over Spain, Orville and Huffines (1999) over the United States, Orville et al. (2000) over Houston (Texas), Lericos et al. (2002) over the Florida Peninsula and Areitio et al. (2001) in the Spanish Basque
648 J. A. Santos et al.: Cloud-to-ground lightning in Portugal
Country. A very pronounced daily cycle is also detected, with an apparent preference for mid-afternoon lightning ac-tivity. The same result was achieved by Rivas-Soriano et al. (2002, 2005) in Spain, Pineda et al. (2007) for the northwestern Mediterranean region, Farias et al. (2009) for the metropolitan region of S˜ao Paulo (Brazil) and Hyun et al. (2009) for South Korea.
Results also highlight a strong spatial variability in the CGD occurrences. Although no classification of the light-ning events with respect to their spatial spreading is under-taken (e.g., local events vs. multi-local events), most of them (59 %) tend to occur over relatively small aggregated areas (less than 1 % of the target area, i.e., a box with limits not exceeding 0.5◦ latitude×0.5◦ longitude). In addition, the CGD occurrences show a clear preference for the inner parts of the country (more continental conditions), also suggesting an important surface modulation. The effect of orography is evident. Also Rivas-Soriano et al. (2005) showed that the spatial distribution of the annual average of CG flash den-sity in Spain reveals maxima amounts over the mountain-ous areas of northeastern Spain, like the Pyrenees and the Iberian System. Pineda et al. (2007) have similar results for the northwestern Mediterranean region. During summer the CGD occurrences are more clustered over northeastern Por-tugal, while in spring/autumn they are relatively widespread. In winter, lightning activity is generally weak (such as found for the Spanish Basque Country by Areitio et al., 2001) and is more likely over southern and western Portugal.
Two significant coupled modes between the large-scale at-mospheric flow (1000 hPa geopotential height) in the Euro-Atlantic sector and the monthly number of CGD days demonstrate the relevance of the large-scale atmospheric forcing on the CGD occurrences over Portugal. First, low pressure areas over Iberia and North Africa and high pressure systems over northern Europe are clearly favourable to CGD occurrences in Portugal, mostly over the more inland areas. Second, low pressure systems north-westwards of Portugal tend to favour CGD occurrences over northern and western Portugal. A more detailed analysis led to the definition of three CGD (lightning) regimes on a daily basis, concerning exclusively days with significant lightning activity (CCGD days). It reveals that the first coupling is a typical sum-mertime regime, while the second coupling can be split into two regimes, a regional cut-off low regime and a remote low pressure system regime, both being predominantly winter-time regimes. Ramos et al. (2011) identified clear linkages between the occurrence of several circulation weather types and lightning activity in Portugal. Although their weather types are general and do not specifically represent lightning regimes in Portugal, they also conclude that frontal systems, cut-off lows and summer thermal lows are the major driving mechanisms for lightning activity over Portugal. However, the CGD regimes presented here provide a more straight-forward analysis of the dynamical conditions directly related to lightning activity in Portugal, also allowing a clearer and
simpler description by using only three lightning regimes in-stead of ten classic large-scale weather types.
Acknowledgements. The present research was undertaken within
the project “Lightning activity in Portugal: variability patterns and socioeconomic impacts (RAIDEN)”, funded by Fundac¸˜ao para a Ciˆencia e Tecnologia (FCT), under the contract number PTDC/CTE-ATM/101931/2008. We acknowledge the Portuguese Instituto de Meteorologia (IM), for providing the atmospheric electrical discharges dataset under a protocol established within the framework of the RAIDEN project. We also acknowledge the Japan Meteorological Agency (JMA) – Central Research Institute of Electric Power Industry (CRIEPI), for supplying their reanalysis data, and the University Corporation for Atmospheric Research (UCAR), for providing their best 4-layer lifted index. We would like to thank the reviewers for their valuable comments and suggestions.
Edited by: C. Andrade
Reviewed by: F. de Pablo and another anonymous referee
References
Altaratz, O., Levin, Z., Yair, Y., and Ziv, B.: Lightning activity over land and sea on the Eastern Coast of the Mediterranean, Mon. Weather Rev., 131, 2060–2070, 2003.
Areitio, J., Ezcurra, A., and Herrero, I.: Cloud-to-ground lightning characteristics in the Spanish Basque Country area during the pe-riod 1992–1996, J. Atmos. Sol.-Terr. Phys., 63, 10, 1005–1015, 2001.
Barnett, T. P. and Preisendorfer, R. W.: Origins and levels of monthly and seasonal forecast skill for United States surface air temperatures determined by canonical correlation analysis, Mon. Weather Rev., 115, 1825–1850, 1987.
Bentley, M. L. and Stallins, J. A.: Climatology of cloud-to-ground lightning in Georgia, USA, 1992-2003, Int. J. Climatol., 25, 1979–1996, 2005.
Carleton, A. M., Arnold, D. L., Travis, D. J., Curran, S., and Ade-goke, J. O.: Synoptic circulation and land surface influences on convection in the Midwest U.S. “Corn Belt” during the summers of 1999 and 2000, Part I: Composite Synoptic Environments, J. Climate, 21, 14, 3389–3415, 2008.
Carvalho, R., Prior, V., and Deus, R.: Explorac¸˜ao experimental do sistema rede de detectores de trovoadas, 3◦Simp´osio de Mete-orologia e Geof´ısica da APMG, 4◦Encontro Luso-Espanhol de Meteorologia, Aveiro, Portugal, 10–13 February 2003, 36, 2003. Cummins, K. L., Murphy, M. F., Bardo, E. A., Hiscox, W. L., and Pyle, R. B.: A combined TOA/MDF technology upgrade of the U.S. National Lightning Detection Network, J. Geophys. Res., 103D, 9035–9044, 1998.
De Pablo, F. and Rivas-Soriano, L.: Relationship between cloud-to-ground lightning flashes over the IP and sea surface temperature, Q. J. Roy. Meteor. Soc., 128, 173–183, 2002.
De Pablo, F. and Rivas-Soriano, L.: Winter lightning and North Atlantic Oscillation, Mon. Weather Rev., 135, 2810–2815, 2007. Dissing, D. and Verbyla, D.: Spatial patterns of lightning strikes in the interior Alaska and their relation to elevation and vegetation, Can. J. For. Res., 33, 770–782, 2003.
J. A. Santos et al.: Cloud-to-ground lightning in Portugal 649
Farias, W. R., Pinto, O. J., and Pinto, I. R.: Anomalous lightning activity over the Metropolitan Region of S˜ao Paulo due to urban effects, Atmos. Res., 91, 485–490, 2009.
Hyun, Y. K., Kar, S. K., Ha, K. J., and Lee, J. H.: Diurnal and spatial variabilities of monsoonal CG lightning and precipitation and their association with the synoptic weather conditions over South Korea, Theor. Appl. Climatol., 102, 1–2, 43–60, 2009. Kilinc, M. and Beringer, J.: The spatial and temporal distribution
of lightning strikes and their relationship with vegetation type, elevation, and fire scars in the Northern Territory, J. Climate, 20, 1161–1173, 2007.
Lang, T. J. and Rutledge, S. A.: Relationships between convec-tive storm kinematics, precipitation, and lightning, Mon. Weather Rev., 130, 2492–2506, 2002.
Lericos, T. P., Fuelberg, H. E., Watson, A. I., and Holle, R. L.: Warm season lightning distributions over the Florida Peninsula as related to synoptic patterns, Weather Forecast., 17, 83–98, 2002.
Onogi, K., Tsutsui, J., Koide, H., Sakamoto, M., Kobayashi, S., Hatsushika, H., Matsumoto, T., Yamazaki, N., Kamahoki, H., Takahashi, K., Kadokura, S., Wada, K., Kato, K., Oyama, R., Ose, T., Mannoji, N., and Taira, R.: The JRA-25 reanalysis, J. Meteorol. Soc. Jpn., 85, 369–432, 2007.
Orville, R. E. and Huffines, G.: Lightning ground flash measure-ments over the contiguous United States, Mon. Weather Rev., 127, 2693–2703, 1999.
Orville, R. E., Huffines, G., Nielsen-Gammon, J., Zhang, R., Ely, Brandon., Steiger, S., Phillips, S., Allen, S., and Read, W.: En-hancement of cloud-to-ground lightning over Houston, Texas, Geophys. Res. Lett., 28, 2597–2600, 2000.
Paredes, D., Trigo, R. M., Garcia-Herrera, R., and Trigo, I.: Under-standing precipitation changes in Iberia in early spring: weather typing and storm-tracking approaches, J. Hydrometeorol., 7, 101–113, 2006.
Petersen, W. A. and Rutledge, S. A.: On the relationship between cloud-to-ground lightning and convective rainfall, J. Geophys. Res., 103, D12, 14025–14040, doi:10.1029/97JD02064, 1998. Pineda, N., Esteban, P., Trapero, L., Soler, X., and Beck, C.:
Cir-culation types related to lightning activity over Catalonia and the Principality of Andorra, Phys. Chem. Earth., 35, 469–476, 2010. Pineda, N., Rigo, T., Bech, J., and Soler, X.: Lightning and precipi-tation relationship in summer thunderstorms: Case studies in the North Western Mediterranean region, Atmos. Res., 85, 159–170, 2007.
Pinto, O. and Pinto, I. R.: On the sensitivity of cloud-to-ground lightning activity to surface air temperature changes at different timescales in S˜ao Paulo, Brazil, J. Geophys. Res., 113, D20123, doi:10.1029/2008JD009841, 2008.
Poelman, D. R.: On the science of lightning: a review. Publication scientifique et technique No 56, Royal Meteorological Institute of Belgium, 56 pp., 2010.
Rakov, V. A. and Uman, M. A.: Lightning, physics and effects, Cambridge University Press, 687 pp., 2003.
Ramos, A. M., Ramos, R., Sousa, P., Trigo, R. M., Janeira, M., and Prior, V.: Cloud to ground lightning activity over Portugal and its association with circulation weather types, Atmos. Res., 101, 1–2, 84–101, 2011.
Ramos, R., Prior, V., Correia, S., and Deus, R.: Portuguese lightning detection network (2003–2006), Second Interna-tional Symposium on Lightning Physics and Effects European COST Action P18, available at: http://www.costp18-lightning. org/Publications/symposium2007/5 8 Ramos.pdf last access 30 November 2011, 2007.
Rivas-Soriano, L. J., De Pablo, F., and Diez, E. G.: Meteorologi-cal and geo-orographiMeteorologi-cal relationships with lightning activity in Castilla-L´eon (Spain), Meteorol. Appl., 8, 169–175, 2001c. Rivas-Soriano, L. and De Pablo, F.: Analysis of the convective
pre-cipitation in the western Mediterranean Sea through the use of cloud-to-ground lightning, Atmos. Res., 66, 189–202, 2003. Rivas-Soriano, L. and De Pablo, F.: Effect of small urban areas in
central Spain on the enhancement of cloud-to-ground lightning activity, Atmos. Environ., 36, 2809–2816, 2002.
Rivas-Soriano, L., De Pablo, F., and Diez, E. G.: Cloud-to-ground lightning activity in the Iberian Peninsula: 1992–1994, J. Geo-phys. Res., 106, 11, 891–901, 2001a.
Rivas-Soriano, L., De Pablo, F., and Diez, E. G.: Relationship be-tween convective precipitation and cloud-to-ground flashes in the Iberian Peninsula, Mon. Weather Rev., 129, 2998–3003, 2001b. Rivas-Soriano, L., De Pablo, F., and Tom´as, C.: Impact of the North
Atlantic Oscillation on winter convection: convective precipita-tion and cloud-to-ground lightning, Int. J. Climatol., 24, 1241– 1247, 2004.
Rivas-Soriano, L., De Pablo, F., and Tom´as, C.: Ten-year study of cloud-to-ground lightning activity in the Iberian Peninsula, J. Atmos. Sol.-Terr. Phys., 67, 1632–1639, 2005.
Rodrigues, R., Mendes, V., Catal˜ao, J., Correia, S., Prior, V., and Aguado, M.: An investigation over the lightning location sys-tem in Portugal for wind turbine protection development, Power and Energy Power Society General Meeting-Conversion and De-livery of Electrical Energy in the 21st century, 2008 IEEE, 1–8, 20–24, 2008.
Rozoff, C. M., Cotton, W. R., and Adegoke, J. O.: Simulation of St. Louis, Missouri, land use impacts on thunderstorms, J. Appl. Meteor., 42, 716–738, 2003.
Steiger, S. M., Hamilton, J. K. R., and Orville, R. E.: Lake-effect thunderstorms in the Lower Great Lakes, J. Appl. Meteor. Cli-matol., 48, 889–902, 2009.
Tinmaker, M. I. R., Kaushar, A., and Beig, G.: Relationship be-tween lightning activity over peninsular India and sea surface temperature, J. Appl. Meteor. Climatol., 49, 828–835, 2010. Tom´as, C., De Pablo, F., and Rivas-Soriano, L.: Circulation weather
types and cloud-to-ground flash density over the Iberian Penin-sula, Int. J. Climatol., 24, 109-123, 2004.
Trigo, R. M. and DaCamara, C. C.: Circulation weather types and their influence on the precipitation regime in Portugal, Int. J. Cli-matol., 20, 1559–1581, 2000.
Wilks, D. S.: Statistical methods in the atmospheric sciences, Aca-demic Press, USA, 2006.