c
European Geosciences Union 2002
and Earth
System Sciences
A new method for avalanche hazard mapping using a combination
of statistical and deterministic models
M. Barbolini1and C. J. Keylock1
1Department of Hydraulic and Environmental Engineering, University of Pavia, Via Ferrata 1, I-27100 Pavia, Italy 2School of Geography,University of Leeds, Leeds, LS2 9JT, United Kingdom
Received: 20 September 2001 – Revised: 15 January 2002 – Accepted: 16 January 2002
Abstract. The purpose of the present paper is to pro-pose a new method for avalanche hazard mapping using a combination of statistical and deterministic modelling tools. The methodology is based on frequency-weighted impact pressure, and uses an avalanche dynamics model embedded within a statistical framework. The outlined procedure pro-vides a useful way for avalanche experts to produce haz-ard maps for the typical case of avalanche sites where his-torical records are either poorly documented or even com-pletely lacking, as well as to derive confidence limits on the proposed zoning. The methodology is implemented using avalanche information from Iceland and the Swiss mapping criteria, and applied to an Icelandic real world avalanche-mapping problem.
1 Introduction
The usual (and sometimes legally required) avalanche haz-ard mapping procedure for settlements in the mountainous regions of Europe is based upon the Swiss zoning scheme (Salm et al., 1990). Areas of land are allocated to zones with a different degree of danger (red, blue or yellow in de-scending order of hazard) based upon return period and im-pact pressure information. The most important boundary in this system is that between the red (high danger) and blue (moderate danger) zones, due to its implication in terms of land use restrictions (BFF/SLF, 1984). This boundary (in the following indicated asxR/B) is placed at the position where the expected avalanche return period (T) is 30 years, unless avalanches with return periods between 30 and 300 years ex-ert impact pressures (I) of greater than 30 kPa at this posi-tion. In this case, the boundary between the red and blue zones is moved downslope until the expected value ofI, for avalanches where 30≤T ≤300 years, is less than 30 kPa.
Correspondence to: M. Barbolini ([email protected])
In practice, this evaluation is usually performed by esti-mating the T = 30 and T = 300 year snow volume in the starting zone (from meteorological data analysis and release zone morphology), and then using this volume as input to an appropriately calibrated avalanche dynamics model to deter-mine the runout distancesx(T =30 years) andx(T =300 years) for these two events. Since the dynamics model gives
I as a function of position,x(T = 30 years) may be com-pared to x(I = 30 kPa) for theT = 300 years event, and whichever is further downslope locatesxR/B.
There are a number of uncertainties that are inherent in this type of analysis, but which are not explicitly incorporated into avalanche hazard maps:
– estimating the avalanche release volume for a given re-turn period is subject to error, particularly for sites with a short snowfall record;
– if historical avalanche runout information is sparse, as it usually is, model calibration will be problematic and embody error;
– the simulated runout distance could differ from the true value, even if the release volume estimate is exact, due to the inherent variability of the dynamics of otherwise similar avalanche events (a given volume of snow can give a range of expected runout distances depending on the properties of the released snow and the snow cover along the track; that is, for a given runout distance, there is a distribution of avalanche sizes).
This paper demonstrates how different modelling tech-niques can be properly combined to estimate the hazard lim-its for poorly documented avalanche paths, and how Monte-Carlo techniques can be used to evaluate the expected error in the estimation ofxR/B.
2 Method
em-240 M. Barbolini and C. J. Keylock: A new method for avalanche hazard mapping 0.01 0.1 1 10 100
0 0.1 0.2 0.3 0.4 0.5 0.6 0.7
Runout Ratio
Percentage of avalanches
fig1
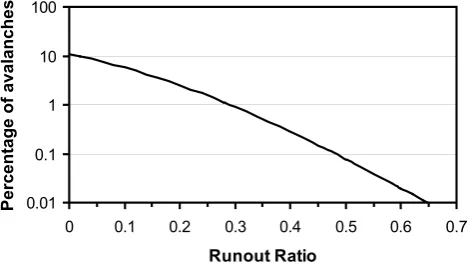
Fig. 1. Avalanches exceedanceP (expressed as a percentage) as a function of runout distance (in terms of the runout ratioRR), using the model of Keylock et al. (1999).
bedded within a statistical framework. A statistical model for avalanche runout distance (Keylock et al., 1999) is used to obtain avalanche encounter probability as a function of avalanche size and location along the path, as well as to ob-tain the frequency distribution of avalanche sizes. This model is based on data derived from a number of paths in a moun-tainous region (Iceland) and gives an “average probability versus runout distance” relation for that region. As such, it is best applied to paths with topographies similar to the major-ity in the original data set. A hydraulic-continuum avalanche dynamics model (Natale et al., 1994; Barbolini et al., 2000), using a classical two-parameter Voellmy-like resistance law (Bartelt et al., 1999) is tuned to the runout distances provided by the statistical model, and is used to derive impact pressure estimates. Impact pressure is calculated as the product of snow density and velocity squared, according to the proposal of Salm et al. (1990).
The curve of Fig. 1 gives the percentage of avalanche (P) reaching a given position along the path, expressed in terms of the runout ratio, RR (McClung and Lied, 1987). If F
indicates the average number of avalanches per year on the considered path, Eq. (1) relates the actual avalanche return periodsT and the probabilityP /100 of an avalanche attain-ing a given runout ratio. Figure 1 givesP as a function of
RR, which allows for the runout positionsx(T =30 years) andx(T =300 years) to be determined
F · P
100
= 1
T. (1)
Within the statistical model of Keylock et al. (1999), dif-ferent sized avalanches (according to the Canadian size clas-sification, McClung and Schaerer, 1993) can have the same stopping position, but a different probability of stopping at this position (Fig. 2). Therefore, for each avalanche size, the impact pressure atx(T =30 years) is calculated by simulat-ing the dynamics of the different sized avalanches stoppsimulat-ing at the locationx(T =300 years). If the impact pressure for the sizeiavalanche is larger than 30 kPa at thex(T = 30 years) location, the locationxi, where the impact pressure is equal to 30 kPa, is found (Fig. 3), and then the relative
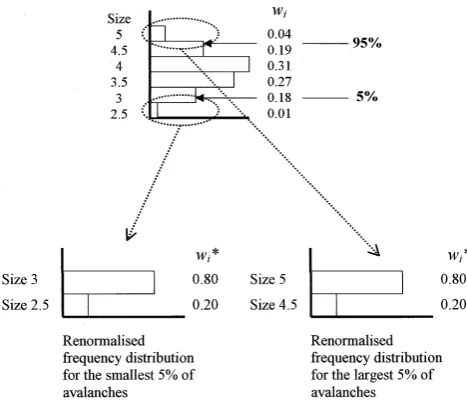
Fig. 2. The relative frequency (wi) of avalanches with different sizes stopping atx(T =300 years) for the S´udavik avalanche path (see Sect. 3); the estimated runout position for theT = 30 years avalanche is also indicated. The Canadian classification uses five sizes (1 to 5), although it is common for avalanche observers to use also half sizes; in this work we have followed this approach. In the figure, sizes 1, 1.5 and 2 are not included (i.e.w1=w1.5=w2= 0), because they do not reachx(T = 300 years), i.e. in the sense that for these sizes the probability of reaching the target location is below a threshold value (fixed at 0.005).
frequencies of each size (wi) are used as weights to give the frequency-weighted average position of the red/blue zone boundary,xR/B (in the following we will refer to this esti-mate as StepAof the procedure):
xR/B = P
wixi P
wi
. (2)
Given the distribution of avalanche sizes stopping at
x(T = 300 years) (Fig. 2), it is also possible to calcu-late the relative frequencies of the smallest and largest 5% of avalanches (Fig. 4), renormalise this, and use the renor-malised probabilities to estimate by Eq. (2) the locations
xR/B for the smallest and largest 5% of avalanches (given by xR/B(0.05) and xR/B(0.95), respectively). These latter values can be viewed as approximate 90% bounds on the frequency-weighted average location of the red/blue zone boundaryxR/B (StepB).
In addition, the uncertainty in the statistical model esti-mate ofx(T =30 years) andx(T =300 years) can be incor-porated by concentrating the statistical model error onto the estimate ofF. If we assume that the error onF conforms to a symmetric triangular distribution, by Eq. (1) and Fig. 1, the position ofx(T =30 years) andx(T = 300 years) can be given in terms of (skewed) triangular distributions (Fig. 5). If a value forx(T = 30 years) and x(T = 300 years) is randomly sampled from their respective distributions and the previously outlined steps are performed, a single estimate for
xR/B,xR/B(0.05), andxR/B(0.95) is obtained. If we perform the procedure several times by Monte Carlo simulation, it is possible to obtain confidence intervals on the estimate of
xR/B,xR/B(0.05) andxR/B(0.95)(StepC).
proba-Fig. 3. Impact pressure as a function of distance for different sized avalanches stopping atx(T = 300 years). The positionsxi show where the pressure for different sizes (i) reach 30 kPa. If an avalanche sizejdoes not reach 30 kPa byx(T =30 years) (in the figure, this is true for sizes 2.5 and 3), then in Eq. (2),xj is set to x(T =30 years).
bility distribution of avalanche sizes at each random estimate forx(T =300 years) (see Fig. 2), selecting one of these sizes at random according to this distribution, and calculating the respective position forxR/B (by comparingx(I = 30 kPa) for the selected size with the randomly estimated location of
x(T =30 years)). Again, if this is repeated many times, the properties of the PDF ofxR/B can be inferred(StepD).
3 Application to a study case
On 16 January 1995 an avalanche damaged or destroyed 22 houses from a total of seventy in the village of S´udavik in the northwest of Iceland, killing 14 people. The location of this village in Iceland can be seen in Fig. 1 of Keylock et al. (1999). This avalanche path is used in this paper to illustrate the proposed approach. The calibration procedure for the dy-namics model at this site, as well as the combined modelling procedure, is explained in more detail in Keylock and Bar-bolini (2001).
According to the statistical model, the most probable lo-cations forx(T = 30 years) and x(T = 300 years) upon this path are 1173 m and 1346 m, respectively, i.e. at eleva-tions above sea level of 12.5 m and 0.0 m, and runout ratios of 0.29 and 0.48. The major limitation of our approach for runout distance estimation is the value forF. Our best-guess value forF was 3.26 (approximately 3) avalanches per year based upon historical avalanche information for this path, with an estimated error of approximately 2 avalanches per year. Hence, the lower and upper limits for the triangular distributions for the error in the estimation ofF were given by the locationsx(T =10 years), andx(T =50 years) for
x(T = 30 years) andx(T = 100 years) and x(T = 500 years) forx(T = 300 years), see Fig. 5. These positions
Fig. 4. Derivation of the relative frequency distributions for the upper and lower 5% of avalanches stopping atx(T = 300 years), wi∗, from the complete relative frequency distribution,wi.
Fig. 5. Triangular distributions for the position ofx(T =30 years) andx(T =300 years) due to uncertainty inF. In this study, we as-sume that the value forFis sufficiently constrained so that the limits for these distributions lie betweenx(T =10 years) andx(T =50 years) in the former case, andx(T = 100 years) andx(T = 500 years) for the latter (see Sect. 3).
equated to values forF of 1.08 and 5.45 avalanches per year for the lower and upper limits, respectively.
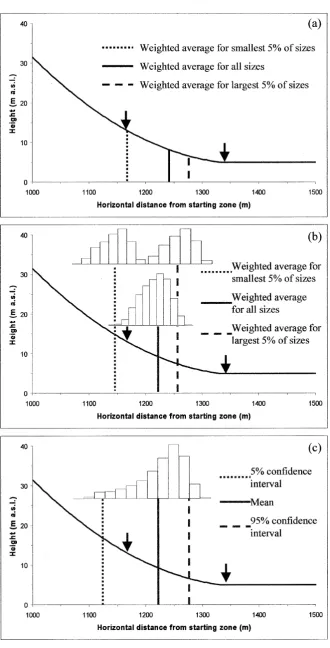
Figure 6 shows the results from our procedure calculated in three different ways. The profile shown is that used for the S´udavik path and three results are shown on each plot. Fig-ure 6a shows the values forxR/B,xR/B(0.05) andxR/B(0.95) using the best estimates forx(T =30 years) andx(T =300 years) given above (StepAandBof Sect. 2). Figure 6b intro-duces variability inx(T =30 years) andx(T =300 years) and permits confidence intervals to be placed on the estimates of these three positions (StepC of Sect. 2). Finally, Fig. 6c gives the full PDF forxR/B including the 5% and 95% con-fidence limits (StepDof Sect. 2).
242 M. Barbolini and C. J. Keylock: A new method for avalanche hazard mapping
M. Barbolini and C. J. Keylock: A new method for avalanche hazard mapping 243
100 1000 10000
1100 1150 1200 1250 1300
No. of simulations
M
ean
v
al
ue
(m
)
(a)100 1000 10000
20 30 40 50
No. of simulations
S
tan
dard
de
vi
at
io
n (m
)
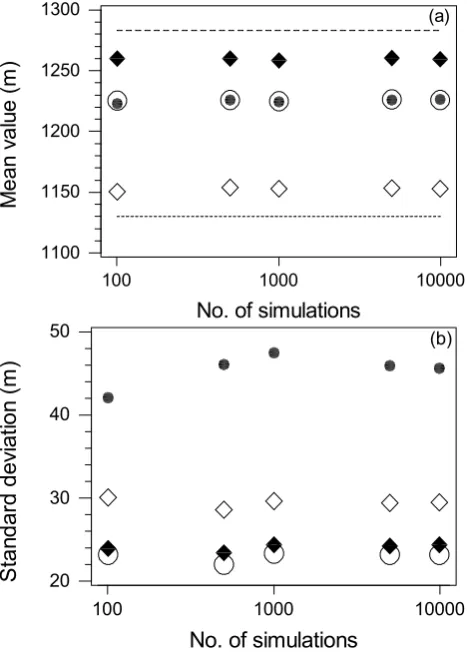
(b)Fig. 7. Convergence of the study results with the number of sim-ulations (on a logarithmic scale). The solid circles are for the full PDF (Fig. 6c), the open circles are the frequency-weighted aver-age results of Fig. 6b, while the solid and open diamonds are the frequency-weighted average values for the upper and lower 5% dis-tributions in Fig. 6b, respectively. The two lines on (a) indicate the position of the 90% confidence bands on the mean (dashed line: up-per bond; dotted line: lower bond), taken from Fig. 6c for 10 000 simulations.
of Monte Carlo simulation, it can be seen that the frequency-weighted average value ofxR/B (Fig. 6b) appears to be quite close to the actual mean for xR/B(0.95) (Fig. 6c). There was no significant difference at the 5% significance level be-tween the two mean values (assuming a Gaussian tion) or between the two median values (with no distribu-tion assumpdistribu-tion). Conversely, the 90% confidence interval forxR/B (Fig. 6c) is approximately 50 m wider than that ob-tained by considering the frequency-weighted average value forxR/B(0.05) andxR/B(0.95) given in Fig. 6b. This is due to the difference between these two approaches: in Fig. 6c the full distribution is sampled, while Fig. 6b shows the vari-ability in the weighted average values for the smallest and largest 5% of avalanches.
It is interesting to note that the value forxR/B (1243 m) obtained using the best estimate forx(T = 30 years) and
x(T =300 years) (Fig. 6a) appears to be quite close to the median of the PDF ofxR/B obtained by Monte Carlo
Sim-Table 1. Properties of the PDF ofxR/B given in Fig. 6c (PDF1) compared to a PDF where the estimates forx(T = 30 years) and x(T = 300 years) are believed to occur betweenx(T = 3 years) andx(T = 300 years), andx(T = 30 years) andx(T = 3000 years), respectively (PDF2)
PDF1 PDF2
Mean (m) 1226 1224 Median (m) 1237 1237 Standard deviation (m) 46 82 Skewness −0.92 −0.79 Kurtosis 0.28 0.64 5% confidence bound (m) 1130 1064 95% confidence bound (m) 1283 1334
ulation, given in Fig. 6c (1237 m). This suggests that the best-guess estimate provides a useful indicator of the central tendency forxR/B, even if the value forF is not well known. The lack of sensitivity of the median to the assumed distri-bution for F is shown in Table 1, where the properties of the PDF given in Fig. 6c are compared to a PDF where the estimates for x(T = 30 years) andx(T = 300 years) are believed to occur betweenx(T =3 years) andx(T = 300 years), andx(T = 30 years) and x(T=3000 years), respec-tively. Note that some of the statistical properties of the PDF ofxR/B listed in Table 1 (e.g. mean, median, standard devi-ation), as well as the value previously indicated for the best-guess estimate ofx(T = 30 years) andx(T = 300 years), are given to an accuracy (of the order of the meter) that is ac-tually unreasonable. This is done for the purposes of analysis only and does not imply that these variables can be calculated with such accuracy.
The precise results obtained using Monte-Carlo simulation can be dependent upon the number of simulations used. Fig-ure 7a shows that the mean values used in this study converge rapidly (byn≈1000), while the standard deviation (Fig. 7b) requires a longer simulation time (n ≈5000). In particular, this is true for the case illustrated in Fig. 6c, where three distribution functions are sampled from randomly (i.e. those used to locatex(T =30 years) andx(T =300 years), and to define the distribution of avalanche sizes at each random estimate forx(T = 300 years)), instead of two, as in the case of Fig. 6b (i.e. those used to locatex(T = 30 years) andx(T =300 years)).
4 Conclusions
244 M. Barbolini and C. J. Keylock: A new method for avalanche hazard mapping
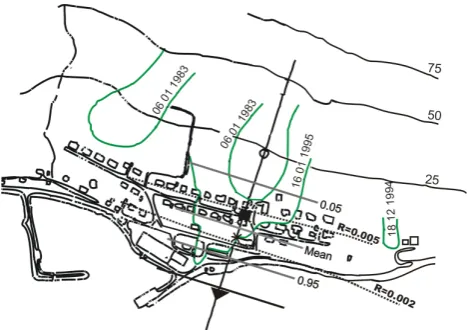
Fig. 8. A map of the S´udavik avalanche path showing the largest historical avalanches, the results of an alpha-beta model and of a risk analysis, and the positions forxR/Bobtained in this study from Fig. 6c. The three grey lines are described in the text. The asterisk indicates the location of the median ofxR/B. The black solid line is the best-guess estimate forx(T =300 years). The open circle is the predicted alpha point, and the solid square and solid triangle are alpha minus one standard deviation and alpha minus two standard deviations, respectively. The alpha-beta model simulations and the risk analysis were performed at the Icelandic Meteorological Office and are provided for comparative purposes.
marked with a black solid line and occurs at a similar posi-tion to theα−2 standard deviations. The three grey lines indicate xR/B(0.05), E(xR/B) and xR/B(0.95) and are la-belled ‘0.05’, ‘Mean’, and ‘0.95’, respectively. Our value for
E(xR/B)lies close toα−1 standard deviation and the 90% confidence bands seem to correspond to 1 standard deviation ofα. It would be interesting to determine if such relations are true in general, since this would open the possibility of a practical interpretation of the alpha-beta model results within the Swiss zoning scheme. However, the fact that the alpha-beta model seems to perform relatively poorly upon this path would suggest that this may not be the case.
The optimum location for the red/blue zone boundary should be conservatively located downslope ofE(xR/B), but within the 90% confidence intervals. Table 1 shows that the median is a robust estimator of central tendency and, due to the negatively skewed distribution that results when return periods are translated into runout distances, it will always lie betweenE(xR/B)andxR/B(0.95). Thus, for this path, a lo-cation 1237 m downslope is perhaps the optimum lolo-cation for the red/blue zone boundary from our analysis. This ap-pears to be close to the 2×10⁻³risk contour line shown in Fig. 8, which equates to a return period of about 150 years (J´onasson et al., 1999), a recurrence interval that is sensible for the location of the red/blue hazard zones boundary.
The results that we have presented are only from one avalanche path. In order to investigate the usefulness of the approach outlined in this paper, testing many more paths is required. However, it is to be expected that for paths where the avalanche runout is adequately described by the statistical
model and where the runout zone is of a smooth, continuous, approximately parabolic shape, the general conclusions from this study should hold true. Therefore, it should be possible to place confidence limits on the location forxR/B using our method. In the future, it may be possible to extend this ap-proach to two dimensions using a more sophisticated dynam-ics model and a more complex statistical approach (Keylock et al., 1999). However, as runout distance is more commonly known to have a higher accuracy than the width, uncertain-ties in the width data underlying the statistical model and the greater difficulty in validating the dynamics model might make this problematic at the present time.
Acknowledgements. This paper is a contribution to the EU research project CADZIE (Catastrophic Avalanches, Defence Structure and Zoning in Europe), founded by the European Union under the con-tract n. EVG1-CT-1999-0009. We are grateful to the Icelandic Me-teorological Office for their avalanche map of the S´udavik path and to M. M. Magn´usson of the IMO for his help with this research. C. Harbitz of the Norwegian Geotechnical Institute provided many helpful comments. M. Barbolini acknowledges the support of the University of Pavia to enable him to travel to England in order to complete this project.
References
Barbolini, M., Gruber, U., Keyloch, C., Naaim, M., and Savi, F.: Application and evaluation of statistical and hydraulic-continuum dense-snow avalanche models to five real European sites, Cold Regions Science and Technology, 31, 2, 133–149, 2000.
Bartelt, P., Salm, B., and Gruber, U.: Calculating dense-snow avalanche runout using a Voellmy-fluid model with ac-tive/passive longitudinal straining, J. of Glac., 45, 150, 242–254, 1999.
BFF/SLF, Richtlinien zur Ber¨ucksichtigung der Lawinengefahr bei raumwirksamen T¨atigkeiten, Bundesamt f¨ur Forstwesen and Ei-dgen. Institut f¨ur Schnee- und Lawinenforschung, EDMZ, CH-3000 Bern, 1984.
J´ohannesson, T.: Icelandic avalanche runout models compared with topographical models used in other countries. In Proceedings of the Anniversary Conference for the 25 Years of Snow Avalanche Research at NGI, Voss, Norway, 12–16 May 1998, NGI Publica-tions No. 203, 43–52, 1998.
J´onasson, K., Sigurdson, S., and Arnalds, P.: Estimation of avalanche risk, Rit Vedurstofu Islands, VI-R99001-UR01, Reyk-javik, 1999.
Keylock, C. J., McClung, D. M., and Magn´usson, M. M.: Avalanche risk mapping by simulation, J. of Glac., 45, 150, 303– 314, 1999.
Keylock, C. J. and Barbolini, M.: Snow avalanche impact pres-sure/vulnerability relations for use in risk assessment, Can. Geot. J., 38, 2, 227–238, 2001.
Lied, K. and Bakkehi, S.: Empirical calculation of snow-avalanche run-out distance based on topographic parameters, J. of Glac., 26, 94, 165–177, 1980.
McClung, D. M. and Schaerer, P. A.: The avalanche handbook, Seattle, WA, The Mountaineers, 1993.
Natale, L., Nettuno, L., and Savi, F.: Numerical simulation of dense snow avalanche: an hydraulic approach, In Hamza, M. H., ed. Proceedings of 24th International Conference on Modelling and Simulations, MS’94, 2–4 May, Pittsburgh, Pennsylvania,
Ana-heim, International Association of Science and Technology De-velopment (IASTED) ACTA PRESS, 233–236, 1994.