‘RELATIONSHIP OF EVA AND MVA WITH COST OF CAPITAL: A Case Study of Hindustan Unilever Limited’
Dr. N. P. Yadav, Associate Professor of Commerce Ahir (P.G.) College, Rewari
(Affiliated to M. D. University, Rohtak )
Dr. NARPALYADAVAssociate Professor of Commerce Ahir (P.G.) College, Rewari
Dr. J. S. YadavAssistant Professor of Commerce Govt. College, Bawal District – Rewari (Haryana)
(Affiliated to M. D. University, Rohtak )
ABSTRACT
The present study attempts to examine the relationship of EVA and MVA with Cost of Capital in Hindustan Unilever Limited. The study is based on secondary data from 2009-10 to 2015-16. The results reveal that the values of EVA and MVA are positive and declining trend in WACC during the period of the study. It means company has succeeded in creating more firm’s value and fulfill the goals of wealth maximization of the shareholders and minimize the cost of capital. The co-efficient of correlation values are .94, -.93 and -.27 between EVA and MVA, WACC and EVA, WACC and MVA respectively. The study proves that the cost of capital (WACC) has an effective influence on EVA and low on MVA. The findings of this paper may be useful to make an efficient financial strategy, assess firm’s value and to judge the financial performance of the company.
Keyword:- EVA, MVA, WACC and Shareholders Wealth Creation.
Introduction
The goal of financial management is to maximize the shareholder’s value. It can be achieved by the maximum utilization of capital employed in the business. The manager of the firm (as an internal user) and the investors and other parties (as an external user) are interested to use an appropriate performance measure. The performance measurement depends upon at least three things i.e. amount of capital invested, the return on the capital and cost of capital. Otherwise, it will not increase the shareholder’s wealth. The companies have adopted different modes of measurement of corporate financial performance such as return on equity, return on capital employed, earnings per share, dividend per share, operating profit margin, economic value added,market value added and shareholder value added, etc. Out of these, the familiar and most prominent methods adopted by the Indian companies are economic value added and market value added. The study is an attempt to examine the relationship of EVA and MVA with Cost of Capital in Hindustan Unilever Limited.
Terms Explained:
(i) Economic Value Added (EVA)
EVA =Net Operating Profit After Tax. (NOPAT)-Cost of Capital Employed (COCE) The purpose of EVA is to assess the performance of company and management. The positive EVA means the company is producing value from the funds invested in the business. The negative EVA indicates that company did not effectively utilize the shareholders’ funds. The zero EVA reflects that company is making enough to keep the lights on and meet its financial obligation, but it is not generating enough revenue to fund future growth. A low EVA shows that a company needs to re-evaluates its operating procedures and expenses or to find a more cost effective financing plan. A high EVA indicates that a company is generating healthy revenues or it has an efficient financing strategy. A company can improve its EVA on account of increase revenue or decrease capital costs.
(ii) Market Value Added (MVA)
Stewart coined the term the Market Value Added. Market value is defined as the difference between market value of invested capital and book value of invested capital of a company at a given period of time. Market value of invested capital refers to the market value of equity capital and debt capital, but the market value of debt is not easily available as debts are not generally traded. Thus, the definition of MVA can be stated as market capitalization less net worth. Market capitalization is the product of closing share price and number of outstanding shares. Net worth is the sum of equity capital, reserve and surplus less accumulated losses and miscellaneous expenditure.
MVA = Market Capitalization – Net Worth.
MVA is a cumulative measure of corporate performance. The shareholders want to see appreciation in stock price. MVA can improve if market capitalization increases for the same level of net worth or net worth of a company decreases. A positive MVA indicates that a company is building value for its shareholders and a negative MVA shows that a company is destroying shareholder’s value. MVA may not be a reliable indicator of measurement performance during strong bull market when stock price rise in general.
The concept of economic value added and market value added were developed in order to reflect corporate financial performance more accurately. It is adopted to evaluate financing strategy, effective management operational capabilities through NOPAT and corporate governance, etc. EVA drives the MVA. EVA is generally calculated on an annual basis, whereas MVA reflects performance over the company’s entire life. Continuous improvements in EVA year after year will lead to increase in MVA.
(iii) Cost of Capital or Weighted Average Cost of Capital (WACC)
The concept of Cost of Capital is lying at the heart of the body of financing theory. It represents a critical link between management’s financial decisions and value of the firm. It is the rate of return on the investment to be earned in order to satisfy the investors. The rate of return is used as a benchmark of capital expenditure decisions.
Objectives of the Study
1. To assess the Cost of Capital of various sources of funds. 2. To analysis the EVA and MVA.
3. To assess the relationship between EVA and MVA
4. To examine the relationship of EVA and MVA with Cost of Capital.
Scope of Study
The present study is restricted to Hindustan Unilever Limited. The study is an attempt to examine the relationship of EVA and MVA with cost of capital. The period of study is 7 year i.e. from 2009-10 to 2015-16.
Methodology
The secondary data has been used for the purpose of the study. The data has been taken from the published Annual Reports of the Hindustan Unilever Limited. The collected data has been analysed through the use of various accounting and statistical techniques such as ratio, percentage, mean (), co-efficient of variation (C.V.), index, trend values, correlation (r), co-co-efficient of determination (r2) and ‘t’ test .
Analysis and Results
The analyzed data has been presented in different tables hereunder to reflect upon the objectives identified.
1. Cost of Capital Analysis
In the present study the specific cost of each of the sources as well as weighted average cost of capital (WACC) has been calculated as under:
WACC=Proportion of Equity x Cost of Equity + Proportion of Debt x Cost of Debt. Cost of Equity (Ke) has been calculated with the help of Capital Asset Pricing Model. Ke=Rf+β (Rm-Rf)
Rf=Risk free rate of return.
β =Sensitivity of share price in relations to the market index. Rm=Market rate of return.
Cost of Debt (Kd) =Interest (1-tax rate)/Debt.
Table No.1
Analysis of Cost of Capital in Hindustan Unilever Limited Year Kd
(%post tax)
Trend Ke (%)
Trend WACC (%)
Trend
2009-10 3.95 3.88 12.51 11.92 12.12 11.70 2010-11 5.36 4.42 12.93 11.78 12.92 11.60 2011-12 6.20 4.96 10.10 11.64 10.10 11.50 2012-13 6.02 5.50 10.07 11.50 10.07 11.40 2013-14 6.36 6.04 11.62 11.36 11.62 11.30 2014-15 5.56 6.58 10.91 11.22 10.91 11.20 2015-16 5.43 7.12 11.99 11.08 11.99 11.10
5.55 11.45 11.39
C.V. .13 .09 .08
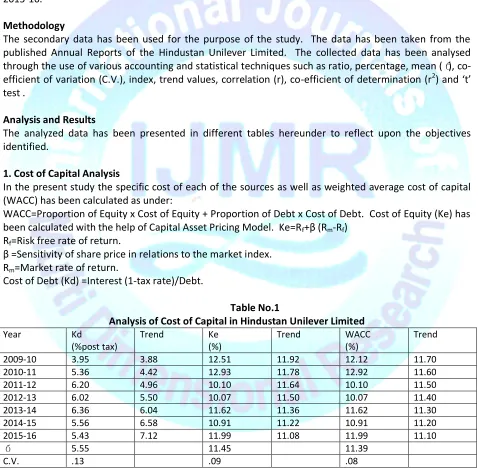
Table No.1 exhibits the cost of capital in Hindustan Unilever Limited. The mean value of cost of debt post tax recorded to be 5.6 with C.V. value .13. The trend values witnessed a increasing trend with annual growth rate .54 over the period of the study. The mean value of cost of equity observed to be 11.5 with C.V. value .09
The trend values showed a declining trend over the period of the study with annual growth rate .14. The mean value of weighted average cost of capital noticed to be 11.4 with C.V. value .08. The values witnessed a declining trend of .10 over the period of the study. It can be concluded that declining trend in weighted average cost of capital is certainly praise worthy situation; this trend should be maintained in coming years also.
2.(a) EVA Analysis
Table No.2
Analysis of EVA in Hindustan Unilever Limited
(Rs.incrores)
Year Net Operating Profit After Tax (NOPAT)
1
Cost of Capital Employed (COCE) II
EVA
III= (1-II)
Trend
2009-10 2108 317 1791 1678.2 2010-11 2153 403 1750 2012.6 2011-12 2600 350 2250 2347.0 2012-13 3331 405 2926 2681.4 2013-14 3579 432 3147 3015.8 2014-15 3854 474 3380 3350.2 2015-16 4074 552 3526 3684.6
Source: Compiled from Annual Reports of Hindustan Unilever Limited.
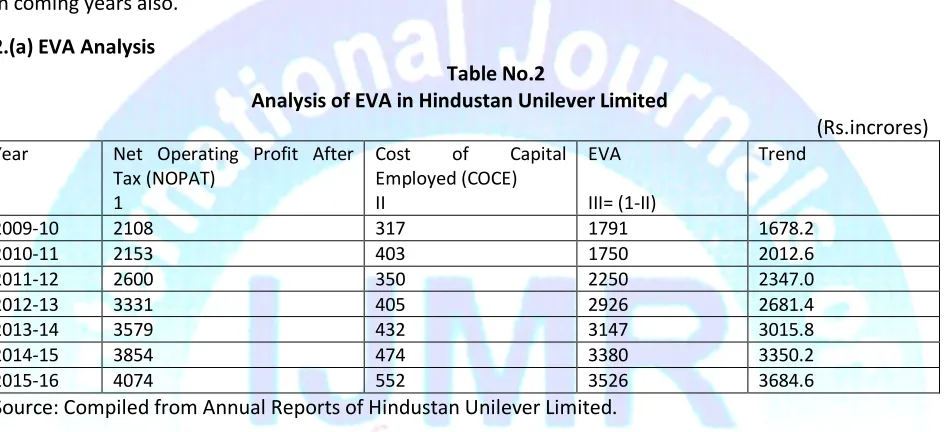
Table No.2 highlights that EVA values are ranging from 1750 crores to 3526 crores because of increasing of NOPAT and capital employed. All values of EVA are positive, which prove the efficient use of shareholders’ funds and firm has succeeded in creating more firm’s value. The trend values witnessed an increasing trend over the period of the study. It can be said that EVA focuses on optimum utilization of capital in the long term by changing the financing mix. It is good if the company can maintain this trend in future years also.
2(b) MVA Analysis
Table No.3
Analysis of MVA in Hindustan Unilever Limited
(Rs.incrores)
Year Market Capitalization 1
Net Worth II
MVA III =(1-II)
Trend
2009-10 52077 2584 49493 37648.8 2010-11 61459 2660 58799 62640.2 2011-12 88600 3513 85087 87631.6 2012-13 100793 2674 98119 112623.0 2013-14 130551 3277 127274 137614.4 2014-15 188849 3725 185124 162605.8 2015-16 188154 3687 184467 187597.2
Table No.3 depicts that the MVA values are ranging from 49493 crores to 184467 crores because of increasing of stock market price during the period of the study. The MVA values are positive, which indicates more investment values as compared to the capital contributed by the investors. The trend values witnessed an increasing trend over the period of the study. It can be inferred that the companyhas good governance and created wealth for its shareholders. MVA is good in market segment and attracting the investors to invest in the company.
3. Relationship Analysis of EVA and MVA
Table No.4
Analysis of Relationship between EVA and MVA in Hindustan Unilever Limited
(Rs.incrores)
Year EVA Index MVA Index
2009-10 1791 100.00 49493 100.00 2010-11 1750 97.71 58799 118.80 2011-12 2250 125.63 85087 171.91 2012-13 2926 163.37 98119 198.24 2013-14 3147 175.71 127274 257.16 2014-15 3380 188.72 185124 374.04 2015-16 3526 196.87 184467 372.71
2681.4 112623.3
C.V. .26 .46
r .94 ‘t’ value 6.02
Source: Compiled from Annual Reports of Hindustan Unilever Limited.
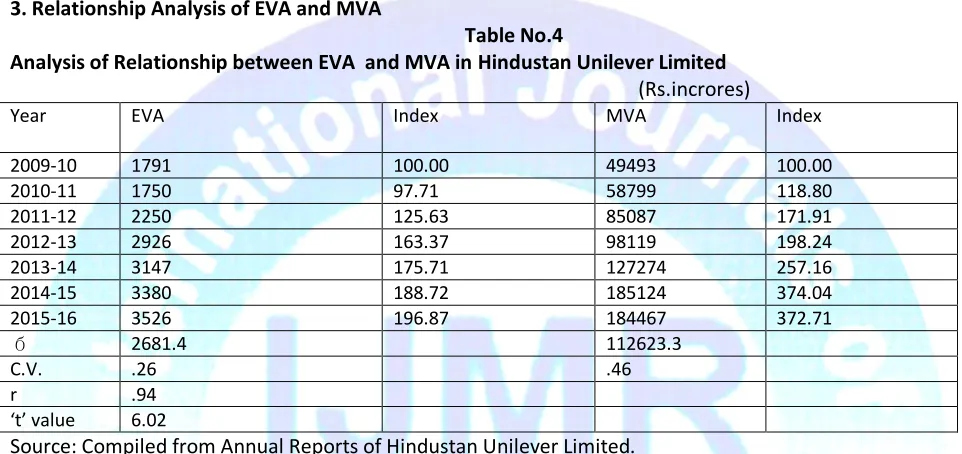
Table No.4 reveals that EVA has grown 1.97 times over the period of the study with C.V. value .26. This proves that considerable fluctuation in the growth of EVA. The rise in MVA is about 3.73 times with C.V. value .46. The C.V. value .46 proves much variation in the growth of MVA. The co-efficient of correlation between EVA and MVA (.94) shows that there is positive relationship between EVA and MVA. The‘t’ value 6.02 is statistically significant at 95 per cent level of confidence. It is inferred that both EVA and MVA are strongly associated with each other during the period of the study. It is certainly a positive signal reflecting on sound financial position.
4.(a) Relationship Analysis of EVA and MVA with Cost of Capital Table No.5
Relationship Analysis of EVA and MVA with Cost of Capital in Hindustan Unilever Limited. Year EVA
(Rs.incrores)
Trend MVA (Rs.incrores)
Trend WACC (%)
Trend
2009-10 1791 1678.2 49493 37648.8 12.12 11.70 2010-11 1750 2012.6 58799 62640.2 12.92 11.60 2011-12 2250 2347.0 85087 87631.6 10.10 11.50 2012-13 2926 2681.4 98119 112623.0 10.07 11.40 2013-14 3147 3015.8 127274 137614.4 11.62 11.30 2014-15 3380 3350.2 185124 162605.8 10.91 11.20 2015-16 3526 3684.6 184467 187597.2 11.99 11.10
2681.4 112623.3 11.39
C.V. .26 .46 .08
Table No.5 exhibits that the relationships of cost of capital (WACC) with EVA and MVA for the period of the study. The C.V. values of WACC, EVA and MVA are .08, .26 and .46 respectively. This proves that high variation in MVA and considerable fluctuation in EVA and WACC. The cost of capital (WACC) is negatively correlated (i.e. -.93) with EVA. The ‘t’ value 5.63 is significant at 95 per cent level of confidence. It proves that EVA increases with the decline in WACC.The cost of capital (WACC) is negatively correlated (ie.-.27) with MVA. The ‘t’ value .62 is statistically insignificant at 95 percent level of confidence. It means that MVA increases with the decline in WACC. Thus, cost of capital has an effective influence on EVA and low on MVA.
4.(b) Co-efficient of Determination Analysis
It gives the percentage variation in the dependent variable that is accounted by the independent variables.
Table No.6
Co-efficient of Determination in Hindustan Unilever Limited.
Independent Variable Dependent Variable r r2
X1 X2 .93 .86
X1 X3 .27 .07
X1 =Cost of Capital (WACC)
X2 =EVA
X3 =MVA
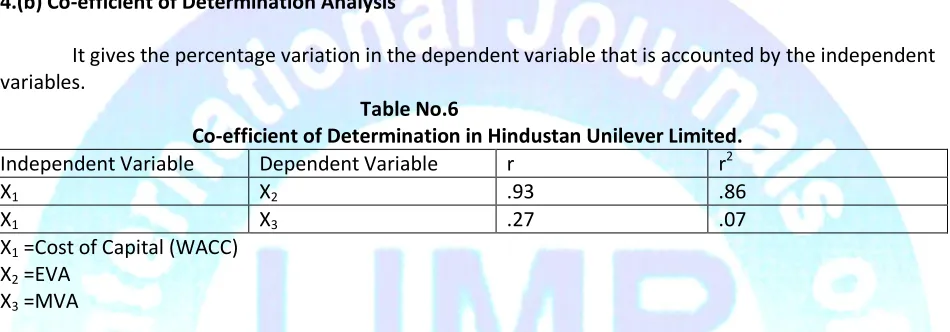
Table No.6 portrays that the co-efficient of determination in two groups of variables in Hindustan Unilever Limited. In the first group (X2) EVA as dependent variable and cost of capital (X1) as
independent variable, it is found that the value of co-efficient of determination is .86 which proves that .86 percent variation in EVA is due to change in cost of capital and 14 percent due to other factors. In the second group considering (X3) MVA as dependent variable and cost of capital (X1) as independent
variable, it is ascertained that 7 percent variation in MVA is caused by variation in cost of capital and 93 percent due to other factors. It can be inferred that cost of capital will helpful to attract the attention of investors to invest in the company and to increase the EVA and MVA.
Conclusion:
References
1. Arthur J, Keonnetal, Basic Financial Management: Prentice Hall of India, Private Limited, New Delhi, 3rd ed., 1986, P.426.
2. John F., Childs, Long Term Financing (Englewood Cliffs), N.J, Prentice Hall Inc., 1976, P. 315. 3. Lawrence J.Gitman and Vincient. A Mercurio, cost of capital techniques used by Major US firms:
Survey and Analysis of Fortune’s 1000, Financial Management, Vol.II, No.4 (Winter 1982), P.21. 4. Sakthivel N, Arjunan C. “Value Creation in Indian Paper Industry.” The Indian Journal of Finance
2009; 3 (12), P.46-54.
5. SenguptaSuchismita, Dutta Avijan, “Economic Value Added: a Yardstick for performance Measurement.” The Indian Journal of Finance 2011; 5(7), P.18-23.
6. SinghK.P and GargM.C, “Economic Value added (EVA) in Indian Corporates,” Deep & Deep Publication Pvt. Ltd., New Delhi, 2004.