www.nat-hazards-earth-syst-sci.net/13/2465/2013/ doi:10.5194/nhess-13-2465-2013
© Author(s) 2013. CC Attribution 3.0 License.
Natural Hazards
and Earth System
Sciences
Simulation systems for tsunami wave propagation forecasting within
the French tsunami warning center
A. Gailler, H. Hébert, A. Loevenbruck, and B. Hernandez
CEA, DAM, DIF, 91297 Arpajon, France
Correspondence to: A. Gailler ([email protected])
Received: 28 November 2012 – Published in Nat. Hazards Earth Syst. Sci. Discuss.: – Revised: 17 May 2013 – Accepted: 23 May 2013 – Published: 9 October 2013
Abstract. A model-based tsunami prediction system has
been developed as part of the French Tsunami Warning Cen-ter (operational since 1 July 2012). It involves a precomputed unit source functions database (i.e., a number of tsunami model runs that are calculated ahead of time and stored). For the Mediterranean basin, the faults of the unit functions are placed adjacent to each other, following the discretization of the main seismogenic faults. An automated composite sce-narios calculation tool is implemented to allow the simula-tion of any tsunami propagasimula-tion scenario (i.e., of any seismic moment). Uncertainty on the magnitude of the detected event and inaccuracy of the epicenter location are taken into ac-count in the composite scenarios calculation. Together with this forecasting system, another operational tool based on real time computing is implemented as part of the French Tsunami Warning Center. This second tsunami simulation tool takes advantage of multiprocessor approaches and more realistic seismological parameters, once the focal mechanism is established. Three examples of historical earthquakes are presented, providing warning refinement compared to the rough tsunami risk map given by the model-based decision matrix.
1 Introduction
Improvements in the availability of sea-level observations and advances in numerical modeling techniques are increas-ing the potential for tsunami warnincreas-ings to be based on nu-merical model forecasts. Nunu-merical tsunami propagation and inundation models are well developed, but they present a challenge to run in real time, partly due to computational
limitations and also a lack of detailed knowledge on the earthquake rupture parameters.
Within the framework of the French Tsunami Warning Center (FTWC) that has been operational since 1 July 2012, these numerical methods are adapted to contribute to future operational tools to quickly provide, in particular, a map with uncertainties showing zones in the main axis of energy at the Mediterranean and NE Atlantic scales (i.e., deep ocean). For this purpose, a strategy based on a precomputed tsunami unit source functions database is developed, as source pa-rameters available a short time after an earthquake occurs are preliminary and may be somewhat inaccurate. Exist-ing numerical models are good enough to provide a useful guidance for warning structures to be quickly disseminated. When an event occurs, an appropriate variety of offshore tsunami propagation composite scenarios may be recalled by combining precomputed propagation solutions (single- or multisources) through an automatic interface (the precom-puted propagation solutions being stored as a database of unit source functions). This approach is intended to provide quick estimates of tsunami offshore propagation, and help hazard assessment and evacuation decision-making.
Fig. 1. Historical tsunamigenic seismicity in western Mediterranean and northeast Atlantic.
of the physics of tsunami generation and propagation in the ocean (because amplitudes are very small compared to the wavelength). But a database of precomputed results cannot contain all possible tsunami events because of too much variability in the mechanism of tsunamigenic earthquakes. In principle, an infinite number of tsunami propagation sce-narios can be constructed by linear combinations of a finite number of precomputed “basis” scenarios. Such a conserva-tive approach is chosen, selecting the scenario – or interpola-tion between several scenarios – with the higher impact. The whole notion of a precomputed forecasting database also re-quires a historical earthquake and tsunami database, as well as an up-to-date seismotectonic database that includes faults geometry and a zonation based on seismotectonic synthesis of source zones and tsunamigenic faults.
2 Tsunami hazard in the western Mediterranean and
northeast Atlantic basins
The Azores-Gibraltar fracture zone (NE Atlantic basin) is the source of the largest earthquakes and tsunamis in west-ern Europe, such as the 1969 earthquake on the Horseshoe Abyssal Plain (Mw=7.8) (Fukao, 1973) and the 1 Novem-ber 1755 Lisbon earthquake (estimatedMw=8.5) (Martins and Mendes Victor, 1990) (Fig. 1). Focal mechanisms of large earthquakes in this region show the transition from an extensional regime (strike-slip and normal dip-slip motion) near to the Azores to a compressional regime (strike-slip and inverse dip-slip motion) in the east of the Atlantic Ocean
(Gulf of Cádiz) (Zitellini et al., 2009; Stich et al., 2006). Seis-mic activity and moment tensor solutions of earthquakes in-dicate that present-day interplate collisional coupling in the area is most pronounced in western Iberia and the offshore Atlantic, marked by a NW to N-directed maximum horizon-tal stress (De Vicente et al., 2008). This is also reflected by the occurrence of historical and instrumental earthquakes, in particular by the recent earthquakes that occurred in 1980 (Mw=6.8), 1997 (Mw=6.2), 1998 (Mw=6.2) and 2007 (Mw=6.3, Mw=6.1) in the Azores Islands and in 1969 (Mw=7.8) and 2007 (Mw=6.1) off the coast of southwest-ern Portugal (Bezzeghoud et al., 1998). The 1755 Lisbon earthquake was probably one of the most catastrophic events to have affected Europe. The earthquake destroyed Lisbon (seismic intensity of X–XI on the Mercalli scale) and was accompanied by an ocean-wide tsunami that struck up to the British Islands and the Lesser Antilles (e.g., Roger et al., 2010). This tsunami was locally large and destructive, es-pecially in the Gulf of Cadiz and along the North Atlantic coasts, resulting in 60 000 casualties in Portugal alone (Bap-tista et al., 1998).
Fig. 2. Simplified fault base used to create segments of 25 km length representing the top edge of each 25×20 km unit source function stored in the precomputed database (detailed view on the Boumerdès area): (black) thrust faults; (grey) normal faults; (red) strike-slip faults.
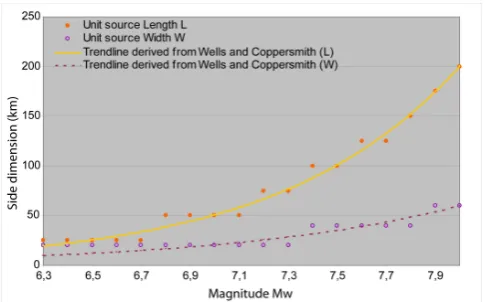
Fig. 3. Comparison of the unit source length and width involved
for a given magnitude as a function of the trendlines derived from Wells and Coppersmith, 1994 (i.e., Eqs. 1 and 2).
In 1887, a strong earthquake in the Genoa Gulf, off Im-peria (Italy) (magnitude 6.2 to 6.5), triggered an important tsunami that caused several floodings along the French Riv-iera, from Antibes to Menton (Scotti et al., 2004; Eva and Ra-binovitch, 1997). In Italy, the 1908 earthquake and tsunami in the Messina Straits caused more than 60 000 casualties and in present-day offers a historical reference for south-ern Italy (e.g., Tinti et al., 1999). The North Algerian seis-mically active margin hosts several possibilities of strong submarine earthquakes able to produce important tsunamis in the western Mediterranean Sea (Kherroubi et al., 2009), and the key recent event that recalled earthquake-induced tsunami awareness in the area occurred in May 2003, af-ter the Boumerdès-Zemmouri earthquake (magnitude 6.9) in Algeria, which caused great damage and about 2000 casual-ties in the epicentral region (Ayadi et al., 2003; Bounif et al., 2004).
Fig. 4. Detailed view on the 2003 Boumerdès earthquake and precomputed unit source functions available in the area: (yellow star) epicenter
of the event; (yellow circle) inaccuracy search radius.
was however shallow and dip enough to produce a signifi-cant sea bottom deformation, which in turn triggered tsunami waves (Meghraoui et al., 2004). In Algeria, the tsunami ob-servations were very limited, either because steep subma-rine slopes do not favor amplification, or because the coastal areas were simultaneously uplifted due the coseismic de-formation (Yelles et al., 2004; Delouis et al., 2004), thus preventing any inundation. But 30 min after the earthquake, the Balearic Islands were hit by significant tsunami waves that caused important damage in several harbors, mostly to small pleasure crafts tied in various harbors in Majorca and Menorca (Hébert and Alasset, 2003). Limited inundations of piers or restaurant terraces were very locally observed, for instance along the southeastern coastline of Majorca. Other quantitative observations were available through three good quality tide gauge records in Palma (Majorca), Sant Antoni and Menorca (Ibiza), which exhibited amplitudes from 0.5 (Palma) to 1.5 m (Sant Antoni) (Alasset et al., 2006). Else-where in the western Mediterranean, the amplitudes did not exceed 10 to 60 cm, but significant eddies and sea with-drawals were reported in several small marinas in southern France (Sahal et al., 2009).
In the following, this Algerian event is chosen as a test case example to illustrate the composite scenarios calcula-tion strategy developed for the western Mediterranean basin within the framework of the FTWC.
3 Composite scenarios calculation strategy for the
western Mediterranean basin
The calculation strategy is based on three main points:
– The implementation of a precomputed unit source
functions database
– The unit sources aggregation method chosen to obtain
composite scenarios according to the magnitude of the detected earthquake
– The inclusion of uncertainties on the earthquake
pa-rameters
3.1 Precomputed unit source functions database
The precomputed unit source functions database is modeled following the western Mediterranean basin seismotectonic context. The latter being rather complex, especially along the north Algerian margin, the choice was made to draw a simplified fault system discretized into unit sources corre-sponding to the major structural trends of the area. The unit source database was constructed, thanks to a huge bibliog-raphy synthesis based on seismicity catalogs, focal mech-anisms, seismotectonic works (e.g., Pondrelli et al., 2004; Alvarez-Gomez et al., 2011), seismic reflection profiles (e.g., Deverchère et al., 2005), bathy/topo data, satellite imagery, etc., in order to propose an exhaustive geodynamic frame-work (extending beyond frame-works such as Lorito et al., 2008 or Sorensen et al., 2012). Fault traces on map (Fig. 2) thus rep-resent the top edge of the unit sources. The length (L) and width (W) of each unit source are set at 25 km and 20 km, respectively. Values ofLandW are defined from empirical relations linkingLandWto the magnitudeMw(Fig. 3).
The corresponding equations are derived from Wells and Coppersmith (1994), by fixing a length of 200 km for a mag-nitudeMwof 8.0:
Mw=4.135+1.679 log10(L) (1)
from Eqs. (1) and (2), as the combination of an adequate number of close unit source functions enables one to ob-tain, for each value of magnitude, rupture zone sizes com-patible with these relations (e.g., 2 close unit sources giving a 50×25 km rupture area size forMw=7.0, Fig. 3).
For each unit source, a propagation scenario (wave heights) is calculated on a 2 min bathymetry grid (i.e., deep ocean modeling only), using the following other rupture zone parameters:
– 1 m slip (unitary)
– rake regionalized based on the local seismotectonic
history (keeping the most conservative values). The azimuth is given by the trace of the fault on surface (i.e., top edge of rupture zone). The bathymetry grid (number of cells=1381×661) is taken from the General Bathymetric Chart of the Oceans (GEBCO).
The numerical method used to simulate tsunami propa-gation from each unit source first allows for the computa-tion of the initial seafloor perturbacomputa-tion responsible for the tsunami triggering. In this framework, it consists of the static elastic dislocation accounting for the coseismic deformation (Okada, 1985). Then the propagation in the deep ocean is solved through a finite difference scheme, taking into account the nonlinear terms of the depth-averaged hydrodynamical equations, hence under the nondispersive shallow water as-sumption (wave celerity c being simply given byc=
√
(gh)
where h is the water depth at each grid point) (see Hébert et al. (2009) for more details on the numerical method).
Each unit source function thus precomputed and stored in the database represents a tsunami generated by a fictitious event of magnitudeMw=6.76 (M0=1.75E+19 N m) with a rectangular rupture zone 25 by 20 km in size and 1 m in slip. From the northwest Algerian margin towards the Messina Straits (Sicily), 500 of such unit source functions compose the precomputed propagation solutions database.
3.2 Composite scenarios calculation
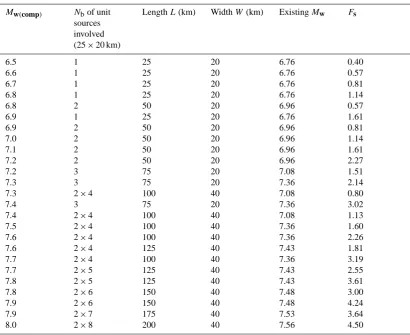
As evoked in the previous section, the number of unit source functions involved in a composite scenario calculation varies with the magnitude of the wanted solution (Fig. 3, Table 1). For example, for a given 7.2 magnitude event, up to 3 unit sources will be combined.
Each composite scenario thus corresponds to a linear com-bination of x close unit source functions (x=1 to 2×8), the resulting combined wave heights being multiplied by an appropriate scaling factor Fs. Fs is defined as a func-tion of the magnitude Mw, exploiting the linearity of the physics of tsunami generation and propagation in the ocean (e.g., Titov et al., 2005). Fs calculation strategy is in-spired from Greenslade et al. (2009) who provide an en-hanced tsunami forecasting database for the Joint Australian Tsunami Warning Center. Considering the expression of the
seismic momentM0as a function of earthquake rupture char-acteristics, i.e., M0= RWLu0 (with R shear modulus and
u0 slip of the rupture), any composite wave heights Hcomp from an event with seismic momentM0(comp)=FsM0can be generated with the same rupture length and width but with a modified slip u0(comp)=Fsu0. From the linearity of the physics of tsunami generation and propagation in the ocean, we can further assume that the wave heights from an event generated with a slip ofFsu0areFstimes the wave heights
Hof an event with identicalLandW, but a slip ofu0:
Hcomp=FsH. (3)
Then the appropriate value forFs is derived from the rela-tion between magnitudeMwand seismic momentM0[Mw= 2/3(log10M0−9.1)]:
Fs=103/2(Mw(comp)−Mw). (4) A summary of the scaling factors thus determined for our forecasting database is provided in Table 1 (calculation done withR=35E+9 N m−2). In each case, the new composite scenario is scaled from one or the combination of several unit source functions following the best fits between rupture di-mensions (LandW) and the estimated magnitudeMw(comp) (i.e., Eqs. 1 and 2). For example, in the case of the 2003 Boumerdès earthquake for which the magnitude was esti-mated atMw=6.9, the representative composite scenarios are obtained from either a single unit source function scaled by 1.61, or the linear combination of two close unit source functions multiplied by a factor of 0.81. In order to be as conservative as possible, the composite scenario calculations also take into account the inaccuracy of the epicenter loca-tion for the detected event (for instance, set at a 30 km search radius) and the uncertainty on the associated estimated mag-nitude. The latter is set at±0.2 but this value depends on the azimuthal coverage of the operational seismic network.
3.3 Final composite scenario construction: example
from theMw=6.9 2003 Boumerdès event
3.3.1 Inaccuracy of the epicenter location: composite
solutions available within a 30 km search radius
As the inaccuracy of the epicenter must be taken into account, the following methodology has been chosen:
1. the first stage consists of searching automatically all the precomputed unit sources localized within a circle whose center is the estimated epicenter of the detected event and whose radius is, in this case, set to 30 km (but configurable). Practically the distance between the epicenter and the middle of the top edge of each unit source is used.
Fig. 5. Composite scenarios calculation process using the test case of the 2003 Boumerdès earthquake (Mw=6.9, Algeria). (Smallest maps)
maximum wave heights stored as unit source functions (Mw=6.76) in the precomputed database and involved in this case; (medium maps)
Mw=6.9 derived composite scenarios solutions from a single unit source (red contour for strike-slip source and black contour for thrust
source) or the combination of the two (green contour for thrust source only); (large map, left) final composite solution forMw=6.9 from all
medium maps (including inaccuracy of the epicenter location).
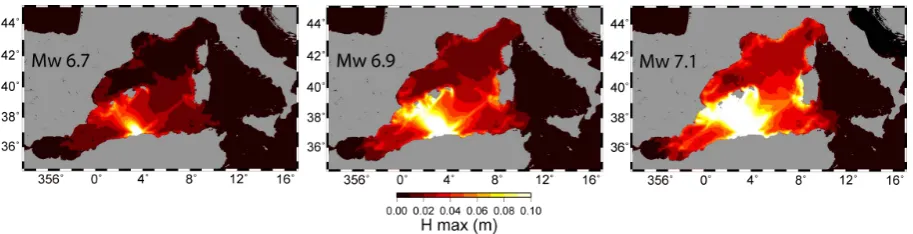
Fig. 6. Maximum wave heights obtained for the three final composite scenarios of the same event, taking into account the uncertainty on the
magnitude (±0.2) (after 3 h of real time propagation).
are within the 30 km search radius (i.e., unit source functions number 40, 41, 10, 33, 5, 206, 7 in Fig. 4). 2. Considering an estimated magnitude ofMw=6.9 for
this event, 12 different possible solutions are then available, following Table 1:
– 7 solutions using the 7 single unit source
func-tions (i.e., whose center is included in the search radius) withFs=1.61 (unit source number writ-ten above)
– 5 solutions using a linear combination of 2 close
unit sources withFs=0.81 (i.e., combination of
Fig. 7. Final representation produced by the forecasting system to be delivered to the authorities 8 h after the detection of a tsunamigenic
earthquake. (black circle) 400 km radius warning area around the epicenter defined by the decision matrix; (green zones) area not included in the western Mediterranean basin.
Fig. 8. Warning map resulting from the “on the fly” tsunami
model-ing, using the source parameters of Yelles et al. (2004). Color scale same as Fig. 7.
Note that if no unit source is found within a maximum search radius (i.e., no a priori seismotectonic information known in the considered area), the process is aborted and only the map derived from the decision matrix will be pro-duced.
3.3.2 Combination scheme of the maximum
wave heights
Figure 5 illustrates the automated calculation process devel-oped to obtain the final composite scenario from the pre-computed database, taking into account the inaccuracy of epicenter location (i.e., Boumerdès earthquake) for a given magnitude (i.e.,Mw=6.9). Maximum wave heights (Hmax) are represented after 3 h of propagation.
The automated calculation process can be divided in 3 steps:
1. Search of the unit source functions stored in the pre-computed database within a 30 km radius from the epi-center of the event. Smallest contoured maps in Fig. 5 represent theHmaxfor the 7 precomputed unit source functions answering this criteria and their 3 closest neighbors. Each of these propagation simulations cor-responding to a fictitious magnitude ofMw=6.76. 2. Composite solutions calculation as a function of the
Table 1. Scaling factors (Fs) required to produce a composite scenario of magnitudeMw(comp)from the existing 25×20 km2unit source
functions in the western Mediterranean basin.
Mw(comp) Nbof unit
sources involved
(25×20 km)
LengthL(km) WidthW(km) ExistingMw Fs
6.5 1 25 20 6.76 0.40
6.6 1 25 20 6.76 0.57
6.7 1 25 20 6.76 0.81
6.8 1 25 20 6.76 1.14
6.8 2 50 20 6.96 0.57
6.9 1 25 20 6.76 1.61
6.9 2 50 20 6.96 0.81
7.0 2 50 20 6.96 1.14
7.1 2 50 20 6.96 1.61
7.2 2 50 20 6.96 2.27
7.2 3 75 20 7.08 1.51
7.3 3 75 20 7.36 2.14
7.3 2×4 100 40 7.08 0.80
7.4 3 75 20 7.36 3.02
7.4 2×4 100 40 7.08 1.13
7.5 2×4 100 40 7.36 1.60
7.6 2×4 100 40 7.36 2.26
7.6 2×4 125 40 7.43 1.81
7.7 2×4 100 40 7.36 3.19
7.7 2×5 125 40 7.43 2.55
7.8 2×5 125 40 7.43 3.61
7.8 2×6 150 40 7.48 3.00
7.9 2×6 150 40 7.48 4.24
7.9 2×7 175 40 7.53 3.64
8.0 2×8 200 40 7.56 4.50
3. Final compositeHmaxcalculation (large map in Fig. 5, left side) as the maximum wave heights from the 12 solutions of step 2 at each grid node. This final composite scenario corresponds to the sameMw=6.9 event, including the inaccuracy of the epicenter loca-tion (being the most conservative).
3.4 Final composite solutions with uncertainty on
the magnitude
As the source parameters available a short time after an earth-quake occurs are preliminary and somewhat inaccurate, an uncertainty on the estimated magnitude of the detected event must be taken into account. Thus, the choice has been made to proceed, forMw−0.2 andMw+0.2, to the same calcula-tion process as the one depicted in Fig. 5 and Sect. 3.3.2. That means that, for the same event, 3 final composite scenarios are produced (respectively representative ofMw,Mw−0.2 andMw+0.2), each one including the inaccuracy of the epi-center location.
For the 2003 Boumerdès earthquake, this implies the ad-ditional calculation for magnitudesMw=6.7 and 7.1, with
corresponding combination and scaling parameters of Ta-ble 1 (Fig. 6).
The deep ocean maximum wave heights thus produced from the forecast system are then transposed into a nondi-mensional warning color code by a simple normalization of the 3Hmax provided by the corresponding final com-posite scenarios using a fixed factor (Fig. 6). They can be interpreted as the most likely scenario and its minimal and maximal bounds, and express the tsunami warning in deep ocean, being as conservative as possible in terms of source parameters. These non-dimensional representations are pro-duced within 5 min (once the first earthquake parameters are known), together with the map given by the decision matrix (with the same non-dimensional scale) (Fig. 7) and corre-spond to the final output of the system.
Fig. 9. Geographical location of tsunami sources and fault parameters regionalization compiled by the Joint Research Centre for Tsunami
Assessment Modeling System (Annunziato, 2007) in Portugal (L. Matias, personal communication, 2010). GC, GF and AZ represent Gulf of Cadiz, Gloria Fault and Azores zones, respectively. Each dot represents the center of a source location for which 5 earthquake magnitudes scenarios are stored in the precomputed database.
Table 2. Decision matrix for the western Mediterranean and NE Atlantic basins.
Mediterranenean Basin
Depth Location Mw Tsunami Potential Type of Bulletin Warning to specify
Local Regional Basin wide
<100 km Offshore orDc<=40 km 5.5 to 6.0 Weak potential of local Tsunami Information Advisory Information Information <100 km [Dc=distance to the coast] 6.0 to 6.5 Potential of destructive local tsunami Advisory Watch Advisory Information
<100 km Offshore orDc<=100 km 6.5 to 7.0 Potential of destructive regional Tsunami Watch Watch Watch Advisory <100 km Offshore orDc<=100 km >=7.0 Potential of destructive Tsunami in the whole basin Watch Watch Watch Watch >=100 km Offshore orDc<=100 km >=5.5 Nil Information Information Information Information Atlantic Basin
Depth Location Mw Tsunami Potential Type of Bulletin Warning to specify
Local Regional Basin wide
<100 km Offshore orDc<=40 km 5.5 to 6.5 Weak potential of local Tsunami Information Advisory Information Information <100 km [Dc=distance to the coast] 6.5 to 7.0 Potential of local Tsunami Information Advisory Information Information <100 km Offshore orDc<=100 km 7.0 to 7.5 Potential of destructive local tsunami Advisory Watch Advisory Information <100 km Offshore orDc<=100 km 7.5 to 7.9 Potential of destructive regional Tsunami Watch Watch Watch Advisory
Fig. 10. Location of the epicenter of the 1908 Messina earthquake
(green star), superimposed on the simplified fault base of 25 km length segments for the Sicily–Calabria region. Each blue segment (with a black dot in its middle) represents the top edge of each
25×20 km unit source function stored in the precomputed database.
the main axis of tsunami energy clearly highlights more fo-cused warning sectors.
In the case of the 2003 Boumerdès earthquake, the red zone of “tsunami watch” is defined by the decision matrix as a 400 km radius circle around the event epicenter. The most likely composite scenario shows a refinement of this red zone towards the Balearic coasts especially, and the western Sar-dinia coasts locally. Within the framework of the FTWC, the forecasting system will be triggered automatically as soon as a potential tsunamigenic event is detected.
3.5 Comparison with “on the fly” tsunami modeling
Together with the forecasting system, another operational tool based on real time computing is implemented as part of the French Tsunami Warning Center. This second tsunami simulation tool in deep ocean relies on the same numerical method, but takes advantage of multiprocessor approaches and more realistic seismological parameters, once the focal mechanism is established.
Both simulation systems thus provide wave heights infor-mation at the basin scale only (i.e., does not take into account the coastal response to tsunami arrival), which means evalu-ations against tide gage observevalu-ations are unsuitable. Evalu-ation of the forecasting system products and the real time
computing ones is done through an intercomparison between both.
In the following, calculations based on the real time com-puting are done using fault parameters derived from seismo-logical studies on the considered historical events.
The coseismic deformation of the 2003 Boumerdès earth-quake has been widely studied (e.g., Semmane et al., 2005; Meghraoui et al., 2004; Yelles et al., 2004), being among the largest events to occur in the western Mediterranean over the past 25 yr. For the comparison, we choose to use the source parameters proposed by Yelles et al. (2004), whose characteristics are a reverse rectangular fault plane of 32 km length by 14 km width. The azimuth, dip, rake and slip values are N60◦, 42◦S, 84◦and 1.8 m, respectively. The epicenter depth is set at 8.7 km (i.e., rupture does not reach the surface). Considering a shear modulus ofR=35E+9 N m−2, this source corresponds to an event of seismic moment M0= 2.82E+19 N.m (i.e.,Mw=6.9). The numerical modeling is then run on the same 2 min bathymetry grid as the one used in the forecasting system, and the resulting computed max-imum wave heights are transposed in the conventional non-dimensional warning scale depicted previously (Fig. 8).
The warning map obtained with this “on the fly” simula-tion is clearly consistent with the ones derived from the pre-computed database of unit source functions (Fig. 7). In terms of risk assessment, it takes place between the “minimal com-posite scenario” and the “most likely comcom-posite scenario”, but being closer to the latter. The same tsunami watch sectors (red zones) are highlighted, i.e., Balearic coasts and western Sardinia coasts locally. This evaluation shows that the fore-casting system provides coherent tsunami warning informa-tion.
4 Composite scenarios calculation strategy for the NE
Atlantic basin
The calculation strategy is based on the three main points as for the western Mediterranean basin (see Sect. 3), the ma-jor difference being the precomputed unit source function database construction.
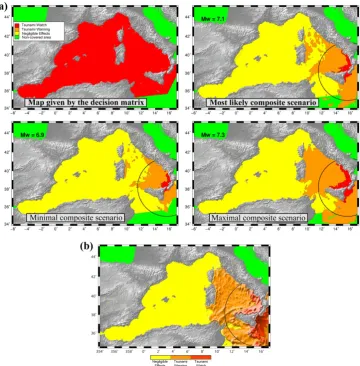
Fig. 11. (a) Result of the composite scenarios calculation process (i.e., model-based tsunami prediction system): final representation destined
for the French authorities using the test case of the 1908 Messina earthquake (Ms=7.1, Sicily). Black circle: 400 km radius area around
the epicenter (decision matrix parameter). (b) Warning map resulting from “on the fly” tsunami modeling (source parameters of Tinti et al., 1999)
precomputed unit tsunami scenarios stored for this area is shown in Fig. 9 (bottom).
Compared to the western Mediterranean database, which has 1 earthquake magnitude ofMw=6.76 at each source lo-cation (see Sect. 3, Fig. 2, Table 3), the NE Atlantic sce-nario database has 5 earthquake magnitudes of Mw=6.5, 7.0, 7.5, 8.0, and 8.5 at each source location (Table 3), all calculated over 12 h of real time propagation on a same 2 min bathymetry grid (number of cells=3181×4021) taken from the General Bathymetric Chart of the Oceans (GEBCO). The rupture area parameters (length, width, slip) are fixed for each magnitude and based on the parameters used by the TAT/JRC in Portugal, which were derived from em-pirical relationships and from historical seismicity. For the Atlantic unit sources database within the French tsunami warning center, the choice was made to favor an averaged seismogenic zone along the Azores-Gibraltar transform zone
that does not exceed 55 km width for a 8.5 magnitude (Ta-ble 3).
When an event occurs, the wanted solution is obtained by scaling the precomputed source scenario to the closest in magnitude. The maximum wave heights given by the pre-computed scenario involved are multiplied by a given scaling factor to produce the new arbitrary scenario (Table 4).
Fig. 12. (a) Location of the epicenter of the El Asnam earthquake of 10 October 1980 (red square), from Roger et al. (2011). (yellow squares)
tide gauges that recorded the tsunami; (red dots) local seismicity (USGS data, 1973 to present); (solid black curves) theoretical tsunami travel times for a source located offshore El Asnam area; (blue squares) 1954 Orleansville earthquake and 1928 and 1934 events. (b) Simplified fault base of 25 km length segments for the western Algerian margin, the Alboran Sea and the SE Spanish coasts. Each blue segment (with a
black dot in its middle) represents the top edge of each 25×20 km unit source function stored in the precomputed database.
Table 3. Source parameters of the scenarios stored in the pre-computed database. 1 (top) for the western Mediterranean basin: 1 earthquake
magnitude ofMw=6.76 at each source location (bottom) for the NE Atlantic basin: 5 earthquake magnitudes ofMw=6.5, 7.0, 7.5, 8.0,
and 8.5 at 4 each source location.
R=35E+09
L(km) W(km) surface km2) slip (m) Mo(N.m) Mw(calculated)
25 20 500 1 1.75E+19 6.76
R=45E+09
Mw(reference) L(km) W(km) surface (km2) slip (m) Mo(N.m) Mw(calculated)
6.5 20 10 200 0.8 7.20E+18 6.50
7 50 20 1000 1 4.50E+19 7.04
7.5 100 35 3500 1.4 2.21E+20 7.50
8 200 45 9000 3.5 1.42E+21 8.03
Fig. 13. (a) Warning map resulting from “on the fly” tsunami modeling using the source parameters of Roger et al. (2007) for the 1980
El Asnam earthquake (Mw=7.3, Algeria). (b) Result of the composite scenarios calculation process: final representation destined for the
French authorities using the test case of the 1980 El Asnam earthquake. Black circle: 400 km radius area around the epicenter (decision matrix parameter).
– for the inaccuracy of the epicenter, a search is
automat-ically conducted of all the precomputed unit sources localized within a circle whose center is the estimated epicenter of the detected event and whose radius is, in this case, set to 30 km (but configurable). Each of the precomputed scenarios responding to the criteria is scaled by the appropriate factor, and the final solu-tion corresponds to the maximum of all new arbitrary scenarios thus calculated.
– the uncertainty on the magnitude is considered through
the production of 3 final composite scenarios (respec-tively representative ofMw,Mw−0.2 andMw+0.2), each one including the inaccuracy on the epicenter lo-cation.
5 Results obtained for other historical
tsunamigenic events
5.1 Example of the 1908 Messina earthquake
(Ms=7.1, Sicily)
Fig. 14. Location of the 1969 Gorringe earthquake (blue star) superimposed on the simplified source location for the precomputed tsunami
scenarios along the Azores-Gibraltar transform zone, taken from the TAT/JRC source definition in this area (L. Matias, personal communi-cation, 2010)
were reported in many places, and the water waves entered 200 m inland locally (Platania, 1909).
The simplified fault network (25 km length segments) used to create the precomputed unit tsunami scenarios stored for this area is shown in Fig. 10 (derived from the seis-motectonic context of the area). Each unit source func-tions in the database corresponds to a tsunami propagation solution over 3 h of real time propagation triggered by a
Mo=1.75E+19 N m earthquake. The composite scenarios calculation tool is run with uncertainties of±0.2 on the mag-nitude of the event and a 30 km radius for uncertainties of the epicenter location. Following the adopted scaling strat-egy (Table 1), the calculation is done thusly:
– for magnitude 7.1 (most likely composite scenario)
with combinations of 2 unit source functions multi-plied byFs=1.61
– for magnitude 6.9 (minimal composite scenario) with
both 1 unit source function multiplied by Fs=1.81, and combinations of 2 unit source functions multiplied byFs=0.81
– for magnitude 7.3 (maximal composite scenario)
with both combinations of 3 unit source functions
multiplied by Fs=2.14, and combinations of 2×4 unit source functions multiplied byFs=0.80
The final mosaic representation is depicted in Fig. 11a. The different maps of the tsunami exposure obtained (Fig. 11a, top right and both bottom panels) bring about a refinement compared to the tsunami warning derived from the decision matrix (Fig. 11a, top left; Table 2).
Keeping in mind that even if the calculation process is chosen to be as conservative as possible, the simulation clearly illustrates that the tsunami risk is lowered compared to the information given by the decision matrix. The areas of tsunami watch are focused along the Sicilian and Calabrian coasts, and the tsunami advisory zones spread throughout the Tyrrhenian Sea up to the eastern coasts of Sardinia and Cor-sica.
The modeling resulting from the real time tsunami simula-tion tool, using Tinti et al. (1999) source parameters, is close to the maximal composite scenario obtained (Fig. 11b).
Fig. 15. (a) Result of the model-based tsunami prediction system: final representation destined for the French authorities using the test case
of the 1969 Gorringe earthquake (Mw=7.8, Atlantic). Black circle: 1000 km radius area around the epicenter (decision matrix parameter).
(b) Warning map resulting from “on the fly” tsunami modeling using the source parameters of Grandin et al. (2007).
5.2 Example of the 1980 El Asnam earthquake
(Ms=7.3, Algeria)
The El Asnam (Algeria) earthquake of 10 October 1980 with an estimated magnitude Ms=7.3 is one of the most de-structive earthquakes recorded in northern Africa and more largely in the western Mediterranean basin. Although lo-cated inland (Fig. 12a), it is known to have been followed by a small tsunami recorded on several tide gauges along the southeastern Spanish coast (Roger et al., 2011).
The simplified fault network (25 km length segments) used to create the precomputed unit tsunami scenarios stored for this area is shown in Fig. 12b (derived from the seis-motectonic context of the area). Each unit source func-tions in the database corresponds to a tsunami propagation solution over 3 h of real time propagation triggered by a
Mo=1.75E+19 N m earthquake. The composite scenarios calculation tool is run with uncertainties of±0.2 on the mag-nitude of the event and of 30 km radius for the epicenter lo-cation. Following the adopted scaling strategy (Table 1), the calculation is done thusly:
– for magnitude 7.3 (most likely composite scenario)
with both combinations of 3 unit source functions mul-tiplied byFs=2.14, and combinations of 2×4 unit source functions multiplied byFs=0.80
– for magnitude 7.1 (minimal composite scenario) with
combinations of 2 unit source functions multiplied by
Fs=1.61
– for magnitude 7.5 (maximal composite scenario) with
combinations of 2×4 unit source functions multiplied byFs=1.60
Table 4. Scaling factors (Fs) required to produce a new arbitrary
scenario of MagnitudeMw(comp) from the existingMw=6.5, 7.0,
7.5, 8.0 and 8.5 unit source functions in the NE Atlantic basin.
Mw(comp) Mw(comp) Fs
6.3 6.5 0.50
6.4 6.5 0.71
6.5 6.5 1.00
6.6 6.5 1.41
6.7 6.5 2.00
6.8 7 0.50
6.9 7 0.71
7 7 1.00
7.1 7 1.41
7.2 7 2.00
7.3 7.5 0.50
7.4 7.5 0.71
7.5 7.5 1.00
7.6 7.5 1.41
7.7 7.5 2.00
7.8 8 0.50
7.9 8 0.71
8 8 1.00
8.1 8 1.41
8.2 8 2.00
8.3 8.5 0.50
8.4 8.5 0.71
8.5 8.5 1.00
8.6 8.5 1.41
8.7 8.5 2.00
8.8 8.5 2.82
8.9 8.5 3.98
as conservative as possible, the simulation clearly illustrates that although an earthquake occurs about 50 km inland, the tsunami risk exists. The tsunami triggered by the 1980 El Asnam earthquake has in fact been observed in the Spanish ports located in the red area defined by our simulation: sea-level variations were recorded by the tide-gauges of Alicante, Cartagena, Almeria, Malaga and Algeciras. In Alicante, the inner breakwater mareogram showed the highest historical amplitude of oscillations (peak to trough) of 48 cm (Roger et al., 2011).
5.3 Example of the 1969 Gorringe earthquake
(Mw=7.8, Gorringe bank)
The Gorringe earthquake of 28 February 1969 (Mw∼7.8) was located to the southwest of Gorringe Bank beneath the Horseshoe Abyssal Plain. It occurred on a fault without pro-nounced preexisting topography, although the focal mecha-nism showed reverse displacement with a minor strike-slip component (N35W striking fault plane with dip angle of ∼52◦) (e.g., Grandin et al., 2007). Sea-level variations were recorded on several tide gage stations in Portugal (up to 1.14 m), Morocco and Spain.
The sources mesh used to create the precomputed unit tsunami scenarios stored for this area is shown in Fig. 14. The scenarios database has 5 earthquake magnitudes (Mw=6.5, 7.0, 7.5, 8.0, 8.5) at each source location, and corresponds to tsunami propagation solutions over 18 h of real time propa-gation. The composite scenarios calculation tool is run with uncertainties of±0.2 on the magnitude of the event and of 30 km radius for the epicenter location.
Following the adopted scaling strategy (Table 4), the cal-culation is done thusly:
– for magnitude 7.8 (most likely composite scenario)
with theMw=8.0 unit source function multiplied by
Fs=0.50
– for magnitude 7.6 (minimal composite scenario) with
theMw=7.5 unit source function multiplied byFs= 1.41
– for magnitude 8.0 (maximal composite scenario) with
theMw=8.0 unit source function multiplied byFs= 1.0
The final mosaic representation is depicted in Fig. 15a. The results obtained for the maps of the tsunami exposure (Fig. 15a, top right and both bottom panels) show that the watch area is globally much more stretched than the 1000 km area defined by the decision matrix (Fig. 15a, top left; Table 2).
The modeling resulting from the real time tsunami sim-ulation tool, using Grandin et al. (2007) source parameters, are consistent with the model-based tsunami prediction sys-tem products, close to the most likely composite scenario ob-tained (Fig. 15b).
6 Conclusions
Improvements in the availability of sea-level observations and advances in numerical modeling techniques are increas-ing the potential for tsunami warnincreas-ings to be based on numer-ical model forecasts. Numernumer-ical tsunami propagation and in-undation models are well developed, but they present a chal-lenge to run in real time, partly due to computational limi-tations and also due to a lack of detailed knowledge on the earthquake rupture parameters.
of any seismic moment). Uncertainty on the magnitude of the detected event and inaccuracy of the epicenter location are taken into account in the composite scenarios calcula-tion. For one tsunamigenic event, the tool produces 3 warn-ing maps (i.e., most likely, minimum and maximum scenar-ios) together with the rough decision matrix representation. A non-dimensional coded representation is chosen to show zones in the main axis of energy at the basin scale. This fore-cast system provides warning refinement compared to the rough tsunami risk map given by the decision matrix.
Together with this forecasting system, another opera-tional tool based on real time computing is implemented as part of the French Tsunami Warning Center. This sec-ond tsunami simulation tool takes advantage of multipro-cessor approaches and more realistic seismological param-eters, once the focal mechanism is established. Examples us-ing 3 historical tsunamigenic earthquakes illustrate the good correlation between the results obtained and the two tools.
Acknowledgements. We thank Alain Rabaute for his work on the seismotectonic synthesis of the western Mediterranean basin and Eric Thauvin for his help and support on GIS data and software.
Edited by: M. Gonzalez Rodríguez
Reviewed by: J. A. Alvarez and Í. Aniel-Quiroga Zorrilla
References
Alasset, P. J., Hébert, H., Calbini, V., Maouche, S., and Meghraoui, M.: The tsunami induced by the 2003 Zemmouri earthquake
(Mw=6.9, Algeria): modeling and results, G. J. Int., 166, 213–
226, 2006.
Álvarez Gómez, J. A., Aniel-Quiroga, íñigo, González, M., Olabar-rieta, M., and Carreño, E.: Scenarios for earthquake-generated tsunamis on a complex tectonic area of diffuse deformation and low velocity: The Alboran Sea, Western Mediterranean, Mar. Geol., 284, 55–73, 2011.
Amoruso, A., Crescentini, L., and Scarpa, R.: Source parameters of the 1908 Messina Straits, Italy, earthquake fron geodetic and seismic data, J. Geophys. Res., 107, doi:10.1029/2001JB000434, ESE 4-1–ESE 4-11, 2002.
Amoruso, A., Crescentini, L., Neri, G., Orecchio, B., and Scarpa, R.: Spatial relation between the 1908 Messina Straits earthquake slip and recent earthquake distribution, Geophys. Res. Lett., 33, L17309, doi:10.1029/2006GL027227, 2006.
Annunziato, A.: The Tsunami Assessment Modelling System by the Joint Research Centre, Sci. Tsunami Hazards, 26, 70 pp., 2007. Ayadi, A., Maouche, S., Harbi, A., Meghraoui, M., Beldjoudi, H.,
Oussadou, F., Mahsas, A., Benouar, D., Heddar, A., Rouchiche, Y., Kherroubi, A., Frogneux, M., Lammali, K., Benhamouda, F., Sebaï, A., Bourouis, S., Alasset, P. J., Aoudia, A., Cakir, Z., Mer-ahi, M., Nouar, O., Yelles, A., Bellik, A., Briole, P., Charade, O., Thouvenot, F., Semane, F., Ferkoul, A. Deramchi, A., and Haned, S. A.: Strong Algerian Earthquake Strikes Near Capital City The
Zemmouri earthquake of May 2003, which measuredMw=6.8,
is among the largest recorded seismic events in North Africa in
modern history, EOS, Trans. Am. geophys. Un., 84, 561–568, 2003.
Baptista, M. A., Miranda, P. M. A., Miranda, J. M., and Mendes Victor, L. : Constraints on the source of the 1755 Lisbon tsunami inferred from numerical modelling of historical data, J. Geody-nam., 25, 159–174, 1998.
Bezzeghoud, M., Borges, J. F., Caldeira, B., Buforn, E., and Udias, A.: Seismic activity in the Azores region in the context of the western part of the Eurasia-Nubia plate boundary, International seminar on seismic risk and rehabilitation of stone masonry housing, 15 pp., 1998.
Bounif, A., Dorbath, C., Ayadi, A., Meghraoui, M., Beldjoudi, H., Laouami, N., Frogneux, M., Slimani, A., Alasset, P. J., Khar-roubi, A., Ousadou, F., Chikh, M., Harbi, A., Larbes, S., and Maouche, S.: The 21 May 2003 Zemmouri (Algeria) earthquake Mw 6.8: relocation and aftershock sequence analysis, Geophys. Res. Lett., 31, L19606, 1–4, doi:10.1029/2004GL020586, 2004. Delouis, B., Vallée, M., Meghraoui, M., Calais, E., Maouche, S., Lammali, K., Mahsas, A., Briole, P., Benhamouda, F., and Yelles, K.: Slip distribution of the 2003 Boumerdes-Zemmouri earth-quake, Algeria, from teleseismic, GPS, and coastal uplift data, Geophys. Res. Lett., 31, L18607, doi:10.1029/2004GL020687, 2004.
Déverchère, J., Yelles, K., Domzig, A., Mercier de Lépinay, B., Bouillin, J.-P., Gaullier, V., Bracène, R., Calais, E., Savoye, B., Kherroubi, A., Le Roy, P., Pauc, H., and Dan, G.: Active thrust faulting offshore Boumerdes, Algeria, and its relations to the 2003 Mw 6. 9 earthquake, Geophys. Res. Lett., 32, L04311, doi:10.1029/2004GL021646, 2005.
De Vicente, G., Cloetingh, S., Muñoz-Martín, A., Olaiz, A., Stich, D., Vegas, R., Galindo-Zaldivar, J., and Fernandez-Lozano, J.: Inversion of moment tensor focal mechanisms for active stresses around the microcontinent Iberia: Tectonic implications, Tecton-ics, 27, TC1009, doi:10.1029/2004GL021646, 2008.
Eva, C. and Rabinovich, A. B.: The Febuary 23, 1887 tsunami recorded on the Ligurian coast, western Mediterranean, Geo-phys. Res. Lett., 24, 2211–2214, 1997.
Fukao, Y.: Thrust faulting at a lithospheric plate boundary: The Por-tugal earthquake of 1969, Earth Planet. Sci. Lett., 18, 205–216, 1973.
Grandin, R, Borges, J. F., Bezzeghoud, M., Caldeira, B., and Car-rilho, F.: Simulations of strong ground motion in SW Iberia for
the 1969 February 28 (Ms=8.0) and the 1755 November 1
(M∼8.5) earthquakes – II. Strong ground motion simulations,
Geophys. J. Int., 171, 816–822, 2007.
Greenslade, D. J. M., Simanjuntak, M. A., and Stewart, C. R. A.: An enhanced tsunami scenario database: T2, Centre for Australian Weather and Climate Research (CAWCR), CAWCR Technical Report, 14, 2009.
Hébert, H. and Alasset, P-.J.: The tsunami triggered by the 21 May 2003 Algiers earthquake, CSEM/EMSC Newsletter, 20, 10–12, 2003.
Hébert, H., Reymond, D., Krien, Y., Vergoz, J., Schindelé, F., Roger, J., and Loevenbruck, A.: The 15th August 2007 Peru earth-quake and tsunami: influence of the source characteristics on the tsunami heights, Pure Appl. Geophys., 166, 1–22, 2009. Kherroubi, A., Deverchère, J., Yelles, A., Mercier de Lépinay, B.,
east-ernmost Algerian margin, Western Mediterranean Sea: New ev-idence for contractional tectonic reactivation, Mar. Geol., 261, 17–32, 2009.
Lorito, S., Tiberti, M. M., Basili, R., Piatanesi, A., and Valensise, G.: Earthquake generated tsunamis in the Mediterranean Sea: Scenarios of potential threats to Southern Italy, J. Geophys. Res., 113, B01301, doi:10.1029/2007JB004943, 2008.
Martins, I. and Mendes Victor, L. A.: Contribução para o estudo da sismicidade de Portugal continental, Universidade de Lisboa, Instituto Geofisico do Infante D. Luis, publicacion 18, 67 pp., 1990.
Matias, L. M., Cunha, T., Annunziato, A., Baptista, M. A., and Car-rilho, F.: Tsunamigenic earthquakes in the Gulf of Cadiz: fault model and recurrence, Nat. Hazards Earth Syst. Sci., 13, 1–13, doi:10.5194/nhess-13-1-2013, 2013.
Meghraoui, M., Maouche, S., Chemaa, B., Cakir, Z., Aoudia, A., Harbi, A., Alasset, P. J., Ayadi, A., Bouhadad, Y., and Ben-hamouda, F.: Coastal uplift and thrust faulting associated with
theMw=6.8 Zemmouri (Algeria) earthquake of 21 May, 2003,
Geophys. Res. Lett., 31, L19605, doi:10.1029/2004GL020466, 2004.
Okada, Y.: Surface deformation due to shear and tensile faults in a half-space, Bull. Seism. Soc. Am., 75, 1135–1154, 1985. Pirazzoli, P. A., Laborel, J., and Stiros, S. C.: Earthquake clustering
in the Eastern Mediterranean during historical times, J. Geophys. Res., 101, 6083–6097, 1996.
Platania, G.: Il maremoto dello Stretto di Messina del 28 Dicembre 1908, Boll. Sismol. Soc. It., 22, 369–458, 1909.
Pondrelli, S., Morelli, A., and Ekstrom, G.:
European-Mediterranean regional centroid-moment tensor catalog:
solutions for years 2001 and 2002, Phys. Earth Planet. Int., 145, 127–147, 2004.
Roger, J., Allgeyer, S., Hébert, H., Baptista, M. A., Loevenbruck, A., and Schindelé, F.: The 1755 Lisbon Tsunami in Guadeloupe Archipelago: Source Sensitivity and Investigation of Resonance Effects, Open Oceanogr. J., 4, 58–70, 2010.
Roger, J., Hébert, H., Ruegg, J. C., and Briole, P.: The El Asnam 1980 October 10 inland earthquake: a new hypothesis of tsunami generation, Geophys. J. Int., 185, 1135–1146, 2011.
Sahal, A., Roger, J., Allgeyer, S., Lemaire, B., Hébert, H., Schindelé, F., and Lavigne, F.: The tsunami triggered by the 21 May 2003 Boumerdés-Zemmouri (Algeria) earthquake: field investigations on the French Mediterranean coast and tsunami modelling, Nat. Hazards Earth Syst. Sci., 9, 1823–1834, doi:10.5194/nhess-9-1823-2009, 2009.
Salamon, A., Rockwell, T., Ward, S. N., Guidoboni, E., and Comas-tri, A.: Tsunami hazard evaluation of the Eastern Mediterranean: Historical analysis and selected modelling, Bull. Seismol. Soc. Am., 97, 705–724, 2007.
Scotti, O., Baumont D., Quenet G., and Levret, A.: The French mi-croseismic database SISFRANCE – objectives, results and per-spectives, Ann. Geophys., 47, 2–3, 571–581, 2004.
Semmane, F., Campillo, M., and Cotton, F.: Fault location and source process of the Boumerdès, Algeria, earthquake inferred from geodetic and strong motion data, Geophys. Res. Lett., 32, L01305, doi:10.1029/2004GL021268, 2005.
Shaw, B., Ambraseys, N. N., England, P. C., Floyd, M. A., Gor-man, G. J., Higham, T. F. G., Jackson, J. A., Nocquet, J. M., Pain, C. C., and Piggott, M. D.: Eastern Mediterranean tectonics and tsunami hazard inferred from the AD 365 earthquake, Nature Geosci., 1, 268–276, 2008.
Sorensen, M. B., Spada, M., Babeyko, A., Wiemer, S., and Grun-thal, G.: Probabilistic tsunami hazard in the Mediterranean Sea, J. Geophys. Res., 117, B01305, doi:10.1029/2010JB008169, 2012.
Stich, D., Serpelloni, E., de Lis Mancilla, F., and Morales, J.: Kine-matics of the Iberia–Maghreb plate contact from seismic moment tensors and GPS observations, Tectonophysics, 426, 295–317, 2006.
Tinti, S., Armigliato, A., Bortolucci, E., and Piatanesi, A.: Iden-tification of the Source Fault of the 1908 Messina Earthquake through Tsunami Modelling. Is it a possible task?, Phys. Chem. Earth B., 24, 417–421, 1999.
Titov, V. V., Gonzalez, F. I., Bernard, E. N., Eble, M., Mofjeld, H. O., Newman, J., and Venturato, A. J.: Real-time tsunami forecast-ing: Challenges and solutions, Nat. Hazards, 35, 41–58, 2005. Wells, D. L. and Coppersmith, K. J.: New empirical relationships
among magnitude, rupture length, rupture width, rupture area, and surface displacement, Bull. Seismol. Soc. Am., 84, 974– 1002, 1994.
Yelles, K., Lammali, K., Mahsas, A., Calais, E., and Briole,
P.: Coseismic deformation of the May 21st, 2003,Mw=6.8