Themed Section: Science and Technology
Proposing A New Methodology For Weather Forecasting By
Using Big Data Analytics
S. Saranya1, T. Meyyappan2
1Research Scholar, Department of Computer Science Alagappa University, Karaikudi, India
2Department of Computer Science Alagappa University, Karaikudi, India
ABSTRACT
Big data has described an enormous quantity of data which needs new technologies to make potential to obtain value from it by analysis and capturing method. Data Analytics often includes scrutinizing past traditional data to research potential trends. Weather prognostication has been one of the most fascinating and exciting domain, and it performs an essential role in aerography. The weather situation is the state of the atmosphere at a given time regarding weather variables like wind direction, rainfall, cloud conditions, pressure, temperature, thunderstorm, etc. The Big data obtained by NCDC (National Climatic Data Center) has received over more than 116 weather locations and more than 1000 observations centers. The data produced by them is unstructured which grows a challenging job to explain it. In this paper, these enormous amounts of data have loaded onto the Apache Pig, Hadoop Distributed File System, Apache Hive is to process the data, which utilizes mappers and reducers to process the data. The above dataset has explained by using given methods and the final output of this project in the form of maximum, minimum and average temperature according to the given time and date.
Keywords: Big Data, Hadoop, HDFS, MapReduce, Mapper, Reducer, Min, Max, Average, NCDC.
I.
INTRODUCTION
Big Data is the method of analyzing large data sets comprising a class of data types [1]. The big data maintain a significant amount of data and process them. It is conventional data analysis which can handle the structured data, but not unstructured data. In big data, it can process both unstructured and structured data. Big data involves data sets typically with different dimensions beyond the ability of generally employed software tools to manage, capture, process and curate the data. Big data size varies from terabytes to several petabytes of data. Weather prognostication is the employment of technology to predict the behavior of the environment for a given area. It is essential for farmers, disasters, business agriculturist, etc. weather prediction is one of the
most exciting and fascinating domain and plays a significant role in aerography. There are numerous conditions in an excellent implementation of weather forecasting for example in data mining methods; it cannot forecast weather in short-term efficiently.
Figure 1
II.
MAPREDUCE PROGRAMMING
MapReduce application performs in three steps, namely map step, shuffle step, and reduce step. Map stage: The map or mapper's job is to process the input data. The input data is in the sort of file or directory and is collected in the Hadoop file system (HDFS) [4] [5]. The Reduce task takes the output from the Map as input and combines those data tuples (key-value pairs) into a smaller set of tuples.
III. DESCRIPTION OF THE DATASET
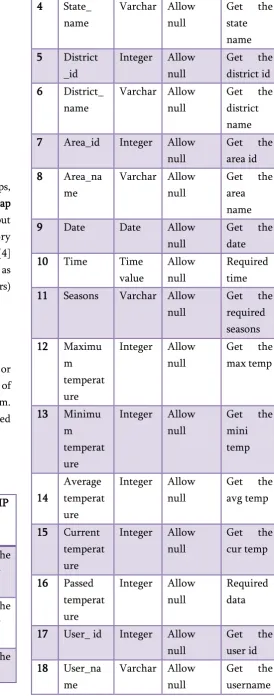
A dataset is a collection of portraits of the items or data objects in a data model for the advantage of programmers and others who need to refer to them. The following table 1 depicts the data dictionary used in this Weather Prediction.
Table 1. Data Dictionary used in the proposed weather forecasting methodology S. N O COLUM N NAME DATAT YPE CONSTR AINTS DESCRIP TION
1 Country_ id
Integer Allow null
Get the country id 2 Country_
name
Varchar Allow null
Get the country name 3 State_id Integer Allow
null
Get the state id
4 State_ name
Varchar Allow null
Get the state name 5 District
_id
Integer Allow null
Get the district id 6 District_
name
Varchar Allow null
Get the district name 7 Area_id Integer Allow
null
Get the area id 8 Area_na
me
Varchar Allow null
Get the area name 9 Date Date Allow
null
Get the date 10 Time Time
value
Allow null
Required time 11 Seasons Varchar Allow
null
Get the required seasons 12 Maximu
m temperat ure
Integer Allow null
Get the max temp
13 Minimu m temperat ure
Integer Allow null
Get the mini temp 14 Average temperat ure
Integer Allow null
Get the avg temp
15 Current temperat ure
Integer Allow null
Get the cur temp
16 Passed temperat ure
Integer Allow null
Required data
17 User_ id Integer Allow null
Get the user id 18 User_na
me
Varchar Allow null
19 Email_id Varchar Allow null
Get the mail id 20 Phone_n
o
Integer Allow null
Get the required phone no
Figure 2. Sample Weather Prediction Dataset
IV. PROPOSED METHODOLOGY FOR
WEATHER FORECASTING BY USING BIG DATA
ANALYTICS
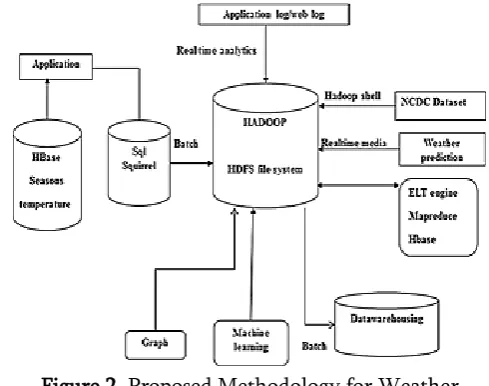
The following figure 2 depicts the proposed methodology for weather forecasting by using Big Data Analytics.
Figure 2. Proposed Methodology for Weather Forecasting by using Big Data Analytics
The forecast of the climate variance perpetually has shown very usefully and essential. In the United States of America (USA) there are typically many effects designed in different cities. These issues might involve the concerts, car racing, festivals, etc. As these are the open-air concerts, they experience a lot from the daily weather variations, which is rising because of global warming. To avoid these issues, they need to pre-plan and choose the data for their event in advance. It can work out only if they had any predictions of the climate data using the Hadoop and distributed system and map reduce. By using map-reduce and also calculate the maximum and the minimum temperature for the hot days and cold days. So, as a result, we can discover useful information about event planning, such as location, time and statistical data.
Maximum, Minimum and Average: In this step, to find out the maximum, minimum and average temperatures of the year, and able to predict the future weather forecast. Finally, to plot the graph for the obtained MAX, MIN and AVG temperature for each month of the particular year to visualize the temperature.
percentages for high temperature, low temperature, icon forecast precipitation and text forecast precipitation. Temperature accuracy is the percentage of estimates within three degrees. Precipitation accuracy is the percentage of correct forecasts. The forecasts have collected in the evening.
Seasons: This step used to Seasonal forecasting is the effort to present valuable information about the "weather climate" that has required in the following months. The periodical forecast is not a weather forecast. Weather can be examined as a snapshot of continually varying atmospheric situations, whereas climate has viewed as the statistical report of the weather phenomena happening in an assigned season.
Prediction: The forecast of the climate change perpetually has proven very important and useful. It can work out only if it had any estimates of the climate data using the Hadoop and distributed system and map reduce. By using map reduce and also calculate the maximum and the minimum temperature for the hot days and cold days. So, as a result, we can discover useful information about event planning, such as location, time and statistical data.
Weather Reports: This Module includes displaying the list of locations on the weather reports. It has visualized as a pictorial representation which has used to identify the past and current year of the temperature.
Weather Format: This Module includes Displaying the list of locations weather Forecast Details. It will be predicted based on the past minimum, maximum, average temperature of the particular year. A user can search specific location weather Forecast by giving the location name in this Module.
Reports: This application provides for generation of reports like total no of need (Min, Max and avg
temperature) available in the application weather forecast reports based on user requirements.
Proposed Algorithm for Weather Forecasting using MapReduce Programming
Input: Cleans Dataset for particular region/City, Prediction Dates, Prediction Attribute
Output: Prediction for a specific range and specified attribute.
Step1: Select all data from noisy data source, and verify
each.
While(i ≠ Ø)
If(verified(i)) Then weight(i) = 1 Else Weight(i) = 0
End While
Step1 Traverses the entire database and verifies the validity of each parameter if the parameter value is found noisy, zero weight has given to that record, and that record will not participate in the prediction process.
Step2:
PRED_DATE = sequence to be predicted BASE_SEQ = (PRED_DATE) – (NO_OF_DAYS) The algorithm divides the whole data into equal chunks called sequences where every sequence is equal to the prediction time span, i.e., if the prediction is for 1 Month, the 12-year dataset has divided into monthly chunks. It has expected for the distance calculation in the dataset.
Step 3:
While days ≠ Ø
Selected_days[ ] = DAY(day) of MONTH(month) (if Validated)
End While
Calculate Distance(Selected_days[]) SORT(Selected_days[], Distance)
calculates its distance, and finally, it sorts the results according to distance.
Step4: Find the K nearest neighbor and calculate mean. The last step extracts K nearest neighbors from the array and takes its mean as the predicted value for a specific day.
Step5: The process stopped when all data has examined.
V.
RESULT AND DISCUSSION
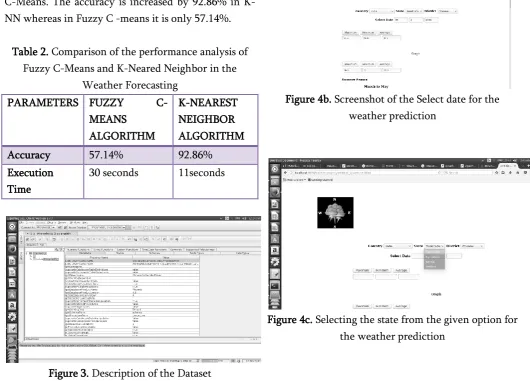
The following figure depicts the performance analysis of the k-nearest neighbor and fuzzy C-means in the weather forecasting. From the above table 2, the execution time of K-NN has reduced than the Fuzzy C-Means. The accuracy is increased by 92.86% in K-NN whereas in Fuzzy C -means it is only 57.14%.
Table 2. Comparison of the performance analysis of Fuzzy C-Means and K-Neared Neighbor in the
Weather Forecasting PARAMETERS FUZZY
C-MEANS ALGORITHM
K-NEAREST NEIGHBOR ALGORITHM
Accuracy 57.14% 92.86%
Execution Time
30 seconds 11seconds
Figure 3. Description of the Dataset .
Figure 4a. Screenshot of the Home Page of the Weather Prediction
Figure 4b. Screenshot of the Select date for the weather prediction
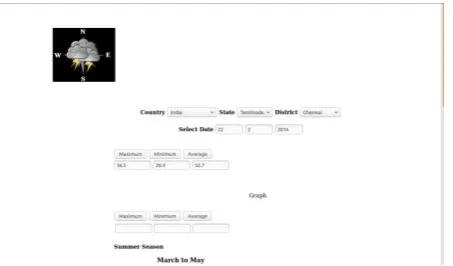
Figure 4d. Calculate the minimum, maximum and average temperature of the state for the selected date
for the weather forecasting
VI. CONCLUSION
The proposed methodology has analyzed from the past data and advanced weather prediction using big data environment. Hadoop with map reduces to analyze the sensor data, which has stored in the National Climatic Data Centre (NCDC) is an efficient solution. Map reduce is a framework for highly parallel and distributed systems across large dataset. By using map reduce with Hadoop helps in removing scalability bottleneck. This type of technology used to analyze large datasets has the potential for significant enhancement to the weather forecast. The query tools make the analytics much more comfortable by providing random access to Big Data. MapReduce is a framework for executing distributable algorithm across huge datasets are using a large number of computers. Using MapReduce with Hadoop, the weather data can be analyzed efficiently and also predict the future weather forecast, minimum and maximum temperature, hot days and cold days based on the data obtained from the NCDC. It helps for the people to preplanning for outdoor events based on the weather conditions.
VII.
REFERENCES
[1].N.Padmaja, Prof. T.Sudha, "Big Data Analytics With Long Range Plan To Process Large Data Sets," International Journal of Advanced Scientific
Technologies, Engineering and Management Sciences, pp.87-90.
[2].Harshawardhan S. Bhosale, Prof. Devendra P. Gadekar, "A Review Paper on Big Data and Hadoop," International Journal of Scientific and Research Publications, Volume 4, Issue 10, October 2014, pp.1-7.
[3].National Climatic Data Center Data Documentation for Data Set 3260 (DSI-3260). ftp://ftp.ncdc.noaa.gov/pub/data/noaa/dsi3260.pdf. [4].Pooja S.Honnutagi, "The Hadoop distributed file
system," International Journal of Computer Science and Information Technologies, Vol. 5 (5), 2014, 6238-6243.