9 IJSTR©2014
Performance Analysis Of Similarity Coefficients
In Web Information Retrieval Using Genetic
Algorithm
Vikas Thada, Dr. Vivek Jaglan
Abstract: Crawling is a process in which web search engines collect data from the web. Focused crawling is a special type of crawling process where crawler look for information related to a predefined topic[1].In this paper a method for finding out the most relevant document among a set of documents for the given set of keyword is presented. Relevance checking is done with the help of Rogers-Tanimoto, MountFord and Baroni-Urbani/Buser similarity coefficients. The method uses genetic algorithm to show that the average similarity of documents to the query increases when Probability of mutation is taken as low and Probability of crossover is taken as high. The method does the performance analysis of different similarity coefficients on the same set of documents and selects the best combination of ProC and ProM to achieve maximum relevancy using of Rogers-Tanimoto, MountFord and Baroni-Urbani/Buser similarity coefficients.
Index Terms: Algorithm, Coefficients, Crawling, Focused, Genetic ,Information, Ranking ,Retrieval ,Web.
————————————————————
1
I
NTRODUCTIONDesign of most focused crawlers is based on the vector space model. The model is used to judge the evenness of web pages and general web search algorithms. The relevance in turn work as guide in following target links [2]. One of the most important module of search engine is ranking module. The task of ranking module is to assign some ranking score to relevant pages using some criterion. Output of ranking module is an ordered set of pages according to their rank i.e. pages with high rank are near the top of the list and low rank pages are at the bottom of the list. These pages are then presented to the user in their ranking order. A GA based approach using Rogers-Tanimoto, MountFord and Baroni-Urbani/Buser similarity coefficients is taken in this paper for ranking the retrieved documents.
2
GENETIC ALGORITHMGAs are search algorithms that follow the concept of natural selection and genetics[3]. GA are powerful and very efficient search and optimization techniques motivated by the natural selection theory of Darwin [4]. Genetic Algorithms [5] are based on the principle of heredity and evolution which claims ―in each generation the stronger individual survives and the weaker dies‖. Therefore, each new generation would contain stronger (fitter) individuals in contrast to its ancestors. The process of GA‘s is iteration based of constant population size of candidate solutions. In each generation/iteration each chromosome‘s fitness in the current population is evaluated and new population evolves. Chromosomes with higher fitness values goes through reproduction phase in which selection, crossover and mutation operators are applied to get new population. Chromosomes with lower fitness values are discarded. Again this generated new population is evaluated and selection, crossover, mutation operators are applied. This process continues until we get an optimal solution for the given problem.
Fig. 1. Basic Operation of Genetic Algorithm [14]
2.1 Fitness Evaluation
10 Table 2
Variables Used to Calculate Binary Similarities/Dissimilarities[7,6,8]
Fig. 2. Selection Operator on a Population of 4 Individuals [9]
Fig. 3. Single Point Crossover Explained
Table 1
Coefficients Used As Fitness Function In Research [6]
For the calculation of similarity metric we define few parameters p,q,r and s as (n = p+q+r+s).
p= (x=1 and y=1) (total match) q= (x=1 and y=0) (single match) r= (x=0 and y=1) (single match) s= (x=0 and y=0) (no match) This is shown in table 2, where
Where A and B may be any query or document represented in binary form.
2.2 Selection
Once the fitness evaluation process is done next step is to perform selection operation. Process of selection operation is based on the principle of ‗‗survival of the fittest‘. Higher fitness valued chromosomes goes through reproduction. Lower fitness valued chromosomes are discarded. There are number of ways to implement this operator, but all relies on the concept that candidates with good fitness values are to be preferred over poor fitness values. The idea is to give preference to better individuals. This selection operation does the replication of candidate chromosomes with good fitness values and eliminating those with poor fitness values [9].
The research work uses roulette wheel selection method as selection operator [10]. It is also known as fitness proportionate selection method.
2.3 Crossover[3,11]
In the crossover operation mating of two chromosomes is performed that gives birth to two new offspring. This operation of crossover always happens with one parameterthat is knownas probability of crossover (ProC). When ProC is say 0.8 it means only 80% of the total population goes for crossover operation. Rests 20% chromosomes remain abstain from this operation and has no effect of crossover. Motive behind performing crossover operation is to explore new solutions and exploit use of old solutions. GA forms an optimum solution by mating two fit chromosomes together. Chromosomes with higher fitness will always have good selection probability then others with lower fitness values, thus a good solution moves from one generation to next generation.
2.4 Mutation[3,11]
11 IJSTR©2014
Fig. 4. Mutation Operation Explained
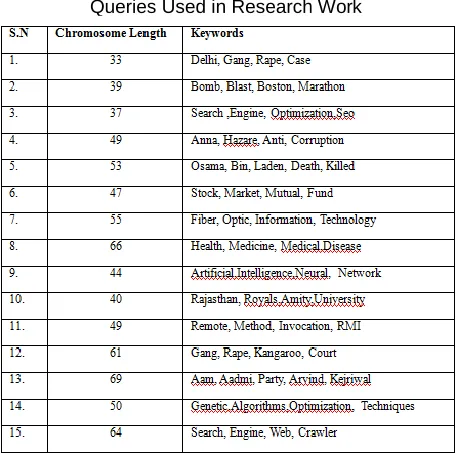
Table 3
Queries Used in Research Work
3.
R
ESEARCHT
OOLSThis section is about the introduction of tools which helped us to find the top keywords from relevant document. These keywords actually used for making the chromosomes; backbone of GA in which the research implementation work was carried out. We discuss a brief introduction of tools Text Analyzer and Keyword Density Checker. Both the tools were used to find out top most keywords present on webpage with highest frequency.
3.7.1 Textalyser
Textalyser[12] is tool for analyzing text or website online. The tool can be used for calculating detailed statistics of text like frequency of top occurring words in text or webpage etc. The tool has good application for translation purpose and webmasters for ranking webpages, for simply normal users to know about top keywords from a text. Using this tool keyword density can be easily found out. Further relative importance of word or expressions can also be found out. Webmasters can use this tool for the analysis of the links on their pages.
3.7.2 Keyword Density Checker
The keyword density checker tool [13] is an online tool which can be used for finding density of top occurred keywords. These keywords are then displayed at the top . Input to the tool can be URL only against both URL and text for textalyser tool. The tool crawls the given URL , bring out words normally as done by search engine , remove punctuations and return result in the form of density of the top URL keywords in the form of keyword cloud.
4.
E
XPERIMENTALS
ETUP&
R
ESULTSIn general the web documents are encoded in strings of 0‘s and 1‘s as shown in the figure 1. The documents have been obtained using some search query. The set of documents also contains some non relevant documents too. In the experimental setup of GA 50 documents have been retrieved for each different query. This set of 50 documents serves as document database. The query is also encoded in terms of string of 0 and
1. Process of experiment is as follows:
i. Query is input to the Google search engine.
ii. Top frequent keywords of each retrieved document are extracted using Textalyser or Keyword Density Checker online tool as discussed in chapter 3 and making list of keywords.
iii. Generate initial population by encoding retrieved documents to chromosomes for each query.
iv. Initial population now consists of these encoded documents. Pass this initial population to GA algorithm.
v. Either some maximum generation or some predefined fitness value is not achieved repeat step 4. At the end of this step we get an optimized document for retrieval.
related to each query.
vii. Rank the documents on the basis of fitness value as obtained in step 4.
4.1 Experimentation
The research work conducted the tests for 15 different queries and 30 documents for each query. The experimentation tests for all 15 queries with RT, MF and BUB coefficients chosen as fitness function. A complete MATLAB code has been written with roulette wheel selection operator, random point crossover with different rates of crossover and mutation. Experiment conducted with various GA parameters as : probability of crossover ProC = 0.7, 0.8 and 0.9 along with probability of mutation (ProM =0.01, 0.10, 0.30) to do performance analysis of this GA based retrieval system. The efficiency parameter is average relevance. Average relevance from three fitness functions are compared and best combination for crossover and mutation probability for any one among three similarity function is selected as best . Using this best selected similarity function the document‘s rank before and after the algorithm are checked and new ranks to document are assigned. The retrieval process now retrieves documents using this new ranking scheme.
4.2 Results
12 Fig. 5. Query vs best fitness for ProC=0.9,ProM=0.01
using RT,MF and BUB
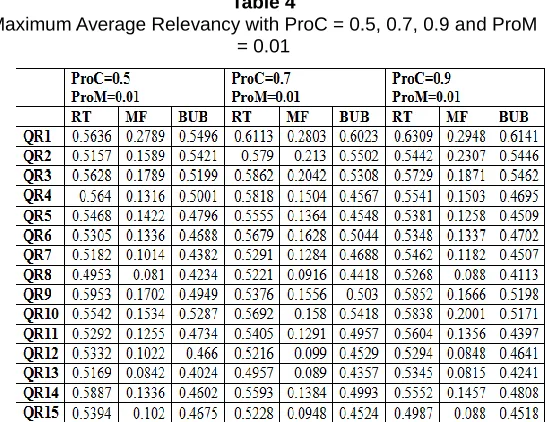
Table 4
Maximum Average Relevancy with ProC = 0.5, 0.7, 0.9 and ProM = 0.01
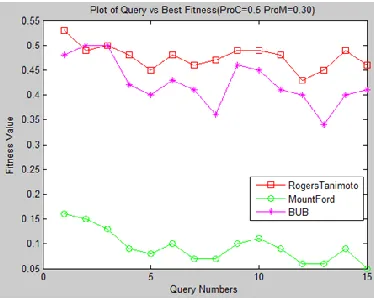
Fig. 7. Query vs best fitness for ProC=0.5, ProM=0.01 using RT,MFand BUB
Table 5
Maximum Average Relevancy with ProC = 0.5, 0.7, 0.9 and ProM = 0.1
Fig. 6. Query vs Best Fitness for ProC=0.7, ProM=0.01 Using RT, MF and BUB
13 IJSTR©2014
Fig. 9. Query vs best fitness for ProC=0.7, ProM=0.10 using RT, MF and BUB
Fig.10. Query vs Best Fitness for ProC=0.7, ProM=0.30 Using RT, MF and BUB
Table 6
Maximum Average Relevancy with ProC = 0.5, 0.7, 0.9 and ProM = 0.30
Fig. 11. Query vs Best Fitness for ProC=0.9, ProM=0.30 Using RT, MF and BUB
Fig. 12. Query vs best fitness for ProC=0.9, ProM=0.10 using RT, MF and BUB
14 4.3 Analysis
From tables 4 to 6 and figures 5 to 13 following observations can be noted:
For each query Queryi(i=1 o 15) maximum average fitness of RT is better than MF and BUB
Maximum average fitness for RT and BUB are very close to each other and they can be used for fusion.
Performance of MF is very poor as compare to RT and BUB for all queries.
Maximum average fitness is better for lower values of ProM and higher values of ProC. Best values are obtained at ProM=0.01 and ProC=0.9.
Changing the values of ProM from 0.01 to 0.10 and 0.30 increases the fitness value for a fixed ProC but we does not see much difference for fitness value at ProM=0.10 and ProM=0.30.
5.
C
ONCLUSIONSThe research work has calculated average maximum fitness value using RT, BUB and MF similarity coefficients. In the work ProC and ProM was varied from {0.5,0.7,0.9} and {0.01, 0.10, 0.30} respectively. It has been shown that average relevancy of retrieved document increases when PC is increased and ProM is decreased. In this way searching has been made easy, so more relevant document or web pages can be retrieved easily. Results show that average relevance of document increased up to 63%. In this way if focused crawler have key set with more relevancy then the retrieved data is more relevant for local collection of a search engine which improves the crawling performance.
References
[1]. B. Novak ―A Survey Of Focused Web Crawling Algorithms‖, Proceedings of SIKDD, pp. 55–58, 12-15 Oct 2004.
[2]. http://www.wikipedia.org/Web_Crawler
[3]. B.Klabbankoh, O.Pinngern. ―applied genetic algorithms in information retrieval‖ Proceeding of IEEE ,pp.702-711,Nov 2004
[4]. S.S.Satya and P.Simon, "Review on Applicability of Genetic Algorithm to Web Search," International Journal of Computer Theory and Engineering, vol. 1, no. 4, pp. 450-455, 2009.
[5]. Shokouhi, M.; Chubak, P.; Raeesy, Z ― Enhancing focused crawling with genetic algorithms‖Vol: 4-6, pp.503-508,2005.
[6]. www.sequentix.de/gelquest/help/distance_measures. htm
[7]. V.Consonni and R. Todeschini ,―New Similarity Coefficients for Binary Data‖, Communications in Mathematical and in Computer Chemistry, pp.581-592, 2012
[8]. H.Wolda, ―Similarity Indices, Sample Size and Diversity‖, OecoIogia-Springer-Verlag ,pp. 296-302,1981
[9]. M.A.Kauser, M. Nasar, S.K.Singh, ―A Detailed Study on Information Retrieval using Genetic Algorithm‖, Journal of Industrial and Intelligent Information vol. 1, no. 3, pp.122-127 Sep 2013.
[10]. http://en.wikipedia/wiki/Fitness_Proportionate_Selecti on
[11]. J.R. Koza, ― Survey Of Genetic Algorithms And Genetic Programming‖, Proceedings of the Wescon, pp.589-595,1995
[12]. http://textalyser.net/
[13]. http://www.webconfs.com/keyword-density-checker.php.
![Fig. 1. Basic Operation of Genetic Algorithm [14]](https://thumb-us.123doks.com/thumbv2/123dok_us/9075370.1442726/1.612.331.568.285.476/fig-basic-operation-genetic-algorithm.webp)
![Fig. 2. Selection Operator on a Population of 4 Individuals [9]](https://thumb-us.123doks.com/thumbv2/123dok_us/9075370.1442726/2.612.68.247.375.512/fig-selection-operator-population-individuals.webp)