
FORMULATION AND EVALUATION OF TIZANIDINE HYDROCHLORIDE MICROSPHERES BY USING 32 FULL FACTORIAL DESIGNS
6
0
0
Full text
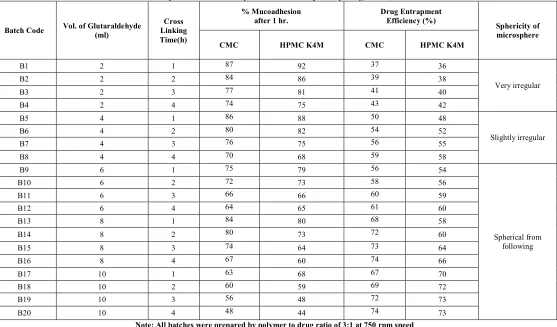
(2) Adimoolam Senthil et al. IRJP 2011, 2 (9), 110-115 agent and cross-linking time. The Polymer-to-drug ratio (1:1, 3:1 and 4:1) and Stirring speed (500, 750 and 1000 rpm) were varied in batches F1to F9 was showed in Table 2. Microspheres thus obtained were filtered and washed with Petroleum ether (80:20) to remove traces of oil. They were finally washed with water to remove excess of glutaraldehyde. The microspheres were then dried at room temperature at 250 C & 60% RH for 24 hours. EVALUATION OF MICROSPHERES Drug Content According to literature review the assay for tizanidine hydrochloride was estimated by UV spectrophotometric method. Aqueous solution of drug was prepared in 0.1N HCl and absorbance is measured on ultraviolet visible spectrophotometer at 319 nm22. Drug Entrapment Efficiency 50 mg of microspheres were crushed in a glass mortar and pestle, and the powdered microspheres was suspend in 10 ml of 0.1N HCl. After 24 hours, the solution filtered and the filtrate is analyzed for the drug content. Particle Size The particle size of the microspheres was determined by using optical microscopy method23. Approximately 50 microspheres are counted for particle size using a calibrated optical microscope. Swelling Index of Microspheres For estimating the swelling index, the 100 microspheres was suspended in 5 ml of simulated gastric fluid USP (pH 1.2)24. The particle size would be monitored by microscopy technique every 1 hour using an optical microscope. The increase in particle size of the microspheres will be noted for up to 8 hours and the swelling index is calculated as per method described by Ibrahim25. In-Vitro Wash-Off Test for Microspheres The mucoadhesive properties of the microspheres are evaluated by in-vitro wash-off test reported by Lehr et al26. A 1cm by 1cm piece of rat stomach mucosa was tied onto a glass slide (3inch by 1inch) using thread. Microspheres are spread onto the wet rinsed tissue specimen, and the prepared slide is hung onto one of the groves of a USP tablet disintegrating test apparatus. The disintegrating test apparatus is operated such that the tissue specimen was given regular up and down movements in a beaker containing the simulated gastric fluid USP (pH 1.2). At the end of 30 minutes, 1 hour, and at hourly intervals up to 10 hours, the number of microspheres still adhering onto the tissue is counted. Drug Release Study The drug release study will perform using USP XXIV basket apparatus22 at 370C±0.50C and 50 rpm using 900 ml of 0.1N HCl as dissolution medium. Microspheres equivalent to 10 mg of tizanidine hydrochloride were used for the test. The 5 ml of sample was withdrawn at predetermined time intervals and filtered through a 0.45 micron membrane filter, diluted suitably and analyzed spectrophotometrically by 319 nm. Scanning Electron Microscopy A scanning electron photomicrograph of drug loaded microspheres was taken. A small amount of microspheres was spread on glass stub. Afterwards, the stub containing the sample was placed in the scanning electron microscope chamber. The scanning electron photomicrograph is taken at the acceleration voltage of 20 kv chamber pressure or 0.6 mm Hg, Original magnification X 80011. Release Kinetics and Mechanism To know the release mechanism and kinetics of tizanidine hydrochloride, optimized formulation was attempted to fit in to mathematical models and n, r2 values for zero order, First order, Higuchi and Peppas models. The peppas model is widely used, when the release mechanism is not well known or more than one type of release could be involved.. Mt/M∞ = ktn Where, Mt/M∞ is fraction of drug released at time‘t’, k represents a constant, and n is the diffusional exponent, which characterizes the type of release mechanism during the dissolution process. For nonfickian release, the value of n falls between 0.5 and 1.0; while in case of fickian diffusion, n = 0.5; for zero-order release (case II transport), n = 1; and for supercase II transport, n > 1. Observation of all the r2 values indicated that the highest r2 (0.9756) value was found for Zero order release. According to ‘n’ value it is one, so it follows non-fickian diffusion with zero order release (case II transport). Factorial Design A statistical model incorporating interactive and polynomial terms was utilized to evaluate the responses. Where, Y is the dependent variable, b0 is the arithmetic mean response of the nine runs, and bi is the estimated coefficient for the factor X1. The main effects (X1 and X2) represent the average result of changing one factor at a time from its low to high value. The interaction terms (X1X2) show how the response changes when two factors are simultaneously changed. The polynomial terms (X12 and X22) are included to investigate non-linearity. On the basis of the preliminary trials a 32 full factorial design was employed to study the effect of independent variables i.e. drug: polymer ratio (X1) and the stirring speed at rpm (X2) on dependent variables percentage of mucoadhesion, drug entrapment efficiency, and particle size. RESULT AND DISCUSSION The tizanidine hydrochloride microspheres were prepared by simple emulsification phase separation technique using HPMC K4M and CMC. Acetic acid from 1% to 4% v/v was used to prepare polymer solution. But there is no effect in concentration of acetic acid was observed on percentage mucoadhesion or drug entrapment efficiency, therefore 1% v/v of acetic acid was used. Polymer concentration is an important factor, mentioned in Lee et al based on viscosity of polymers solution. Three different concentrations 0.5, 1 and 2% v/v were selected for trial batches, from this 1% concentration showed a maximum sphericity was observed so we select 1% w/v of polymer in 1% v/v acetic acid was found to be the optimum concentration and 1:1 heavy and light paraffin was used as dispersion medium and 0.5% v/v of Span 85 is added as anionic surfactant to dispersion medium was found to be essential to minimize aggregation of microspheres. Preliminary trail batches B1 to B20 of microspheres were prepared by using HPMC K4M and CMC as polymers, the volume of cross-linking agent 2 to 10 ml and stirring speed were varied from 500, 750 and 1000 rpm shown in Table 1. From these forty batches, the B1-B4 batches of HPMC K4M and CMC were prepared by using 2 ml glutaraldehyde showed very irregular shaped microspheres and percentage of mucoadhesion also good but drug entrapment efficiency is not good. Batches B5B8 prepared by using 4 ml of glutaraldehyde showed good mucoadhesion properties and drug entrapment efficiency. Batches B9-B12 of HPMC K4M and CMC was prepared by using 6 ml of glutaraldehyde showed spherical free flowing microspheres and also shows 63% to79% and 64% to 75% mucoadhesion, 54% to 60% and 56% to 61% of drug entrapment efficiency. Batches B13-B16 of HPMC K4M and CMC showed 60% to 80% and 67% to 84% of mucoadhesion, also showed 58% to 66% and 68% to 74% of drug entrapment efficiency. The batches B17-B20 was showed spherical free flowing microspheres and showed 70% to 73% and 74% to 67% of drug entrapment efficiency. The cross-linking agent increase means the mucoadhesivenes was decreases and cross-linking time did not show a significant effect on the percentage of drug. INTERNATIONAL RESEARCH JOURNAL OF PHARMACY, 2(9), 2011.
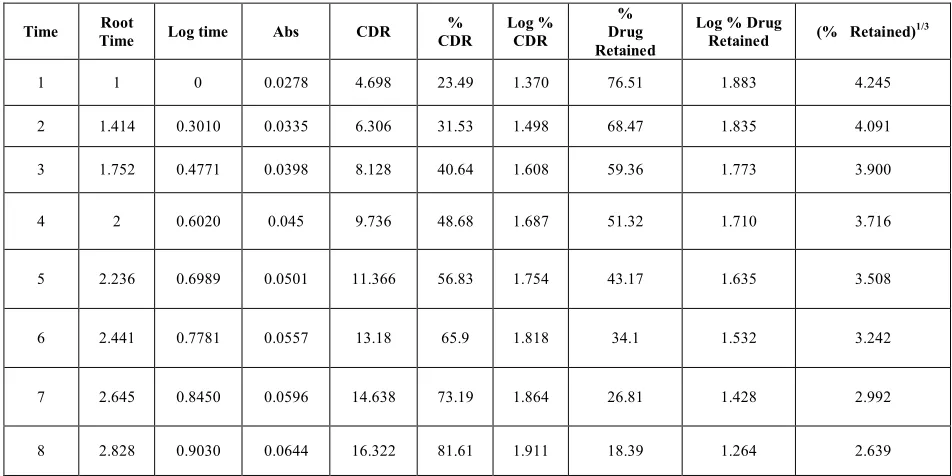
(3) Adimoolam Senthil et al. IRJP 2011, 2 (9), 110-115 entrapment efficiency, shown in Table 1. From these twenty batches HPMC K4M and CMC the best optimized formula was B17 and B14 shown in Table 1. Thus, we conclude the cross-linking time did not have a significant effect on the percentage drug entrapment efficiency. On the basis of the preliminary trials 32 full factorial design were employed, to study the effect of independent variable X1 (polymerto- drug ratio 1:1, 3:1 and 4:1) and the stirring speed X2 (500, 750 and 1000rpm) on dependent variables percentage mucoadhesion, drug entrapment efficiency, and particle size. The results depicted in Table 2 clearly indicate that all the dependent variables are strongly dependent on the selected independent variable as they show a wide variation among the nine batches. The polynomial equations can be used to draw conclusions after considering the magnitude of coefficient and the mathematical sign it carries (i.e. positive or negative).The dependent variables indicate a good fit. All the nine batches of two polymers HPMC K4M and CMC F1-F9 were prepare by using 10ml and 8ml of glutaraldehyde and 1 and 2 hours crosslinking time shown in Table 2. In-vitro wash of test for percentage mucoadhesion after 1 hour of HPMC K4M and CMC varied from 39% to 80% and 56% to 93% showed good correlation coefficient r2 0.9805 and 0.9811. These, indicates that the effect of X1(polymer-todrug ratio) is more significant thanX2 (stirring speed). Moreover, stirring speed had a negative effect on percentage mucoadhesion (the stirring speed increased means the percentage of mucoadhesion is decreased).This finding may be attributed to the change in particle size that affects mucoadhesion. Similar results were obtained for swelling index. Thus, the polymer concentration increased the swelling index also increased. The swelling index varied from 0.096 to 1.260 and 0.037 to 1.497 showed good correlation coefficient. Thus, we can conclude that the amount of polymer and stirring speed directly affect the percentage mucoadhesion and swelling index .The drug entrapment efficiency varied from 46% to 79% and 56% to 84% showed good correlation coefficient r2 0.9811 and 0.9805. Indicates that the effect of X1(polymer-to-drug ratio) is more significant thanX2 (stirring speed). Moreover, stirring speed had a negative effect on drug entrapment efficiency (the stirring speed increased means the particle size and drug entrapment efficiency was decreased) and all the nine batches shows spherical and free flowing. They range in particle size from 42.5 to 68.4 and 46.2 to 85. The stirring speed has negative effect on drug release because as the particle size increased the drug release decreases. Batches F7 and F5 was the optimized formulation and they were spherical free flowing. The stirring speed and polymer ratio was increased; the % of mucoadhesion and the drug entrapment efficiency was decreased. From these nine formulations of HPMC K4M and CMC the best optimized formula was F7 and F5 batches were shown in Table 2. The In-vitro drug release studies were carried out the percentage drug dissolved at different time interval was calculated using the Lambert’s-Beer’s equation were shown in Table 3 & 4. The release mechanism and kinetics of tizanidine hydrochloride, optimized formulation was attempted to fit in to mathematical models and n, r2 values for zero order, First order, Higuchi and Peppas models. The peppas model is widely used, when the release mechanism is not well known or more than one type of release could be involved and the report was given in Graphs 1 and 2, In-vitro Zero order dissolution studies and Hixon-Crowell models in Table 4, Graphs 3 & 4. The percentage of drug release for eight hours shows 84.52% for HPMC K4M and 81.61% for CMC which indicates the microspheres could sustain the release of the drug for more than 10 hours.. CONCLUSION The results of a 32 full factorial design revealed that the polymer-todrug ratio and stirring speed significantly affected the dependent variables percentage mucoadhesion, drug entrapment efficiency, particle size and swelling index. As the concentration of glutaraldehyde increases, the mucoadhesiveness decreases and there was no significant effect in time. Stirring speed has negative effect on drug release. Among these two polymers HPMC K4M microspheres exhibited a high percentage mucoadhesion of 80% after 1 hour and 79% drug entrapment efficiency. The microsphere of tizanidine hydrochloride could sustain the release of the drug for more than 10 hours. The percentage of drug release for eight hours shows 84.52% which indicates the mucoadhesive microspheres could sustain the release of the drug for more than 10 hours. REFERENCES 1. Woo BH, Jiang G, Jo YW, Deluca PP. Preparation and characterization of a composite PLGA and poly (acryloyl hydroxy methyl starch) microsphere system for proteindelivery, Pharm Res, 2001; 18:1600-1606. 2. Capan Y, Jiang G, Giovagnoli S, Deluca PP. Preparation and characterization of poly (D, L-lactide-co-glycolide) microsphere for controlled release of human growth hormone. AAPS Pharm Sci Tech, 2003; 4:E28. 3. Gohel MC, Amin AF. Formulation and optimization of controlled release diclofenac sodium microspheres using factorial design. J Control Release, 1998; 51:115-122. 4. Vasir JK, Tambwekar K, Garg S, Bioadhesive microspheres as a controlled drug delivery system. Int J Pharm, 2003; 225:13-32. 5. Jaya Krishnan and M.S Latha, Biodegradable polymeric microspheres as drug carriers control and novel drug delivery system by N.K Jain. 6. Ikeda K. Murata K, Kobayashi M, Noda K. Enhancement of bioavailability of dopamine via nasal route in beagle dogs. Chem Pharm Bull (Tokyo), 1992; 40:2155-2158. Nagai T, Nishimoto Y, Nambu N, Suzuki Y, Sekine K, Powder dosage form of 7. insulin for nasal administration. Control Release, 1984; 1:15-22. Llium L, Farraj NF, Critchley H, Davis SS. Nasai administration of 8. gentamycin using a novel microsphere delivery system. Int J Pharm, 1988; 46:261-265. 9. Schaefer MJ, Singh J. Effect of isopropyl myristic acid ester on the physical characteristics and in-vitro release of etoposide from PLGA microspheres. AAPS Pharm Sci Tech, 2000; 1:E32. 10. Rao SB, Sharma CP. Use of chitosan as biomaterial: studies on its safety and haemostatic potential. Bio med Mater Res, 1997; 34:21-28. 11. Lehr CM, Bouwstra JA. Schacht EH, Junginger HE. In-vitro evaluation of mucoadhesive properties of chitosan and some other natural polymers. Int J Pharm, 1992; 78:43-48. 12. Henriksen I, Green KL, Smart JD, Smistad G, Karlsen J. Bioadhesion of hydrated chitosans: an in-vitro and in-vivo study. Int J Pharm, 1996; 145:231240. 13. Chowdary KPR, Rao YS. Design and in-vitro and in-vivo evaluation of mucoadhesive microcapsules of glipizide for oral controlled release a technical note. AAPS Pharm Sci Tech, 2003; 4:E39. 14. Thanoo BC. Sunny MC, Jayakrishnan A. Cross-linked chitosan microspheres: preparation and evaluation as a matrix for the controlled release of pharmaceuticals. J Pharm Pharmacol, 1992; 44:283-286. 15. Hari PR, Chandy T, Sharma CP. Chitosan/Calcium alginate microcapsules for intestinal delivery of nitrofurantoin. J Microencapsul, 1996; 13:319-329. 16. Liu LS, Liu SQ, Ng SY, Froix M, Heller J. Controlled release of interleukin 2 for tumour immunotherapy using alginate/chitosan porous microspheres. J Control Release, 1997; 43:65-74. 17. Patel JK. Bodar MS. Amin AF, Patel MM. Formulation and optimization of mucoadhesive microspheres of metoclopramide. Ind J Pharm Sci, 2004; 66:300-305. 18. Dubey RR. Parikh RH. Two-stage optimization process for formulation of chitosan microspheres. AAPS Pharm Sci Tech, 2004; 5:E5. 19. Foster RH, Plosker GL, Glipizide: a review of the pharmacoeconomic implications of the extended-release formulation in type 2 diabetes mellitus Pharmacoeconomics, 2000; 18:289-306. 20. Thombre AG, Denoto AR, Gibbes DC. Delivery of glipizide from asymmetric membrane capsules using encapsulated excipients. J Control Release, 1999; 60:333-341. 21. Chowdary KPR, Balatripura G, Design and in vitro evaluation of mucoadhesive controlled release oral tablets of glipizide. Ind J Pharm Sci, 2003; 65:591-594. 22. The United States Pharmacopeial Convention. XXVI In: The United States Pharmacopeia. Rockville, MD: The United States Pharmacopeial Convention Inc; 2003:859.. INTERNATIONAL RESEARCH JOURNAL OF PHARMACY, 2(9), 2011.
(4) Adimoolam Senthil et al. IRJP 2011, 2 (9), 110-115 23. 24.. Milling Eugene L, Lachman L, Liberman HA, Theory and Practice of Industrial Pharmacy 2nd India. The United States Pharmacopeial Convention. XXVI In: The United States Pharmacopeia. Rockville, MD: The United States Pharmacopeial Convention Inc; 2003:2528.. 25.. Ibrahim El-Gibaly I. Development and in vivo evaluation of novel floating chitosan microcapsules for oral use: comparison with non-floating chitosan microspheres. Int J Pharm, 2002; 249:7-21. Lehr CM, Bowstra JA, Tukker JJ, Junginger HE. Intestinal transit of bioadhesive microspheres in an in situ loop in the rat. J Control Release, 1990; 13:51.. 26.. Table 1: Preliminary trials of tizanidine hydrochloride microsphere by using HPMC, K4M and CMC. Batch Code. Vol. of Glutaraldehyde (ml). B1. 2. Cross Linking Time(h). Drug Entrapment Efficiency (%). % Mucoadhesion after 1 hr. CMC. HPMC K4M. CMC. HPMC K4M. 1. 87. 92. 37. 36 38. B2. 2. 2. 84. 86. 39. B3. 2. 3. 77. 81. 41. 40. B4. 2. 4. 74. 75. 43. 42. B5. 4. 1. 86. 88. 50. 48 52. B6. 4. 2. 80. 82. 54. B7. 4. 3. 76. 75. 56. 55. B8. 4. 4. 70. 68. 59. 58. B9. 6. 1. 75. 79. 56. 54 56. B10. 6. 2. 72. 73. 58. B11. 6. 3. 66. 66. 60. 59. B12. 6. 4. 64. 65. 61. 60. B13. 8. 1. 84. 80. 68. 58 60. B14. 8. 2. 80. 73. 72. B15. 8. 3. 74. 64. 73. 64. B16. 8. 4. 67. 60. 74. 66. B17. 10. 1. 63. 68. 67. 70 72. B18. 10. 2. 60. 59. 69. B19. 10. 3. 56. 48. 72. 73. B20. 10. 4. 48. 44. 74. 73. Sphericity of microsphere. Very irregular. Slightly irregular. Spherical from following. Note: All batches were prepared by polymer to drug ratio of 3:1 at 750 rpm speed Table 2: Formulation of tizanidine hydrochloride microsphere by using HPMC K4M and CMC by using 32 full factorial design Drug Entrapment % Mucoadhesion Efficiency Swelling Particle After1hr Variable (%) Index Size levels in Batch coded from Code HPMC HPMC K4M CMC CMC HPMC K4M HPMC K4M CMC CMC K4M X2 X1 F1 F2 F3 F4 F5 F6 F7 F8 F9. -1 -1 -1 0 0 0 1 1 1. -1 0 1 -1 0 1 -1 0 1. 57 65 68.59 61.52 0.774 0.643 42 59 51.37 59.45 0.466 0.579 39 56 46.35 56.22 0.397 0.467 61 83 57.46 79.73 0.689 1.737 55 53.75 0.538 78 78.74 1.270 52 75 49.25 73.88 0.426 0.037 93 84.32 1.497 79.33 1.260 80 76 85 64.15 80.76 0.107 1.453 68 80 58.30 77.55 0.096 1.197 Variables level: Drug-to-polymer ratio (X1) and Stirring speed (X2) Low (-1) = 1:1-500 rpm, Medium (0) = 3:1-750 rpm and Low (+1) = 4:1-1000 rpm.. INTERNATIONAL RESEARCH JOURNAL OF PHARMACY, 2(9), 2011. 58.1 54.5 42.5 57.4 53.7 49.3 68.4 63.5 59.8. 56.0 54.2 46.2 65.1 62.2 58.8 85.0 76.8 71.4.
(5) Adimoolam Senthil et al. IRJP 2011, 2 (9), 110-115 Table 3: In-vitro release profile of tizanidine hydrochloride microspheres HPMC K4M-F7 (%Retaine d). Time. Root Time. Log time. Abs. CDR. % CDR. Log % CDR. % Drug Retained. Log % Drug Retained. 1. 1. 1. 0. 0.0286. 4.89. 24.45. 1.388. 75.55. 1.878. 2. 2. 1.414. 0.301. 0.0332. 6.246. 31.23. 1.494. 68.77. 1.837. 3. 3. 1.752. 0.477. 0.0374. 7.544. 37.72. 1.576. 62.28. 1.794. 4. 4. 2. 0.602. 0.0414. 8.828. 44.14. 1.644. 55.86. 1.747. 5. 5. 2.236. 0.698. 0.0466. 10.446. 52.23. 1.717. 47.77. 1.679. 6. 6. 2.441. 0.778. 0.0516. 12.068. 60.34. 1.780. 39.66. 1.598. 7. 7. 2.645. 0.845. 0.0603. 14.682. 73.41. 1.865. 26.59. 1.424. 8. 2.828. 0.903. 0.0672. 16.9. 84.5. 1.926. 15.5. 1.190. 8. 1/3. Table 4: In-vitro release profile of tizanidine hydrochloride microspheres CMC Time. Root Time. Log time. Abs. CDR. % CDR. Log % CDR. % Drug Retained. Log % Drug Retained. (% Retained)1/3. 1. 1. 0. 0.0278. 4.698. 23.49. 1.370. 76.51. 1.883. 4.245. 2. 1.414. 0.3010. 0.0335. 6.306. 31.53. 1.498. 68.47. 1.835. 4.091. 3. 1.752. 0.4771. 0.0398. 8.128. 40.64. 1.608. 59.36. 1.773. 3.900. 4. 2. 0.6020. 0.045. 9.736. 48.68. 1.687. 51.32. 1.710. 3.716. 5. 2.236. 0.6989. 0.0501. 11.366. 56.83. 1.754. 43.17. 1.635. 3.508. 6. 2.441. 0.7781. 0.0557. 13.18. 65.9. 1.818. 34.1. 1.532. 3.242. 7. 2.645. 0.8450. 0.0596. 14.638. 73.19. 1.864. 26.81. 1.428. 2.992. 8. 2.828. 0.9030. 0.0644. 16.322. 81.61. 1.911. 18.39. 1.264. 2.639. Table 5: Model fitting for the release profile of tizanidine hydrochloride microspheres HPMC K4M-F7 and CMC-F5 Zero Order. First Order. Higuchi Matrix. R. R. R. R. N. R. HPMC K4M. 0.982. 0.886. 0.962. 0.947. 0.597. 0.935. Zero. CMC. 0.989. 0.973. 0.988. 0.987. 0.612. 0.994. Zero. Formulation Code. Korsmeyer-Peppas. HixonCrowell. Best Fit Model. R= correlation coefficient; n= slope (≤0.5 – fickian diffusion; 0.5<n<1 – non fickian diffusion; 1 – Case – II transport; >1 – super case –IItransport). INTERNATIONAL RESEARCH JOURNAL OF PHARMACY, 2(9), 2011.
(6) Adimoolam Senthil et al. IRJP 2011, 2 (9), 110-115. Graph 1: Tizanidine hydrochloride microspheres (HIGUCHI Model). Graph 2: Tizanidine hydrochloride microspheres (KORSMEYER-PEPPAS Model). Graph 3: In-vitro release profile of tizanidine hydrochloride microspheres (ZERO ORDER). Graph 4: Tizanidine hydrochloride microspheres (Hixon-Crowell). Source of support: Nil, Conflict of interest: None Declared. INTERNATIONAL RESEARCH JOURNAL OF PHARMACY, 2(9), 2011.
(7)
Figure
Related documents
The significant differences between jejunal and ileal atresia were the increased duration between presentation and surgery (p-value 0.02), longer postoperative (p-value 0.01) and
The modified Medical Research Council (mMRC) assess- ment is widely used, and an mMRC score of $ 2 is still refer- enced as a threshold to discriminate “more breathlessness”
Rats were randomly divided into three groups, speci fi cally, 5% Carboxymethyl cellulose (CMC) for 8 days (Control), 5% CMC for 7 days + CAL for 1 day (single CAL) and CAL for 8
To understand the impact of prophages on the epidemiology of various types of MRSA, the prophages in all SCC mec isolates collected in 2010 (322 isolates) and 2014 (232 isolates)
The gradient methods are tested against a first order chemical reaction (reaction (i»whereas the PIPD application in the second sequel is tested against the same first order
Abstract — In this present paper, we design Wet clutch by Computational Modelling and z-D drawing’s are designed for multiplate clutch from computational calculations.3D
