Abstract— This paper proposes a content-based image retrieval system based on an efficient combination of both feature and color algorithms. According to Kekre Transform we derive feature vectors using a combination of row mean and column mean of both query as well as the database images, to measure the extent of similarity in features using Euclidian distance. Experimentation shows that taking row mean, column mean and combination improves the performance of image retrieval as compared to taking Kekre Transform of the whole image. Similarly, HSV colour space quantifies the colour space into different regions and thereby calculating its mean and Euclidian distance the colour vector can be derived. Taking mean or Euclidian distance of the individual Euclidian distances of both the algorithms improves the accuracy of the image retrieval process implemented. By calculating the precision and recall parameters of selective images from the database, comparison between the two algorithms and the effectiveness of the combination of both the algorithms can be measured.
Index Terms— CBIR, Feature Vector, Color Vector, Euclidian distance, HSV, Hue, Adaptive Segmentation
I. INTRODUCTION
Image processing has several applications leading to which there has been recent development of multimedia databases that have large amounts of digital image and video data available which challenges issues of cataloguing and retrieval is gaining increasing importance.This has resulted in an increased need for more efficient Content Based Image Retrieval [1], [2], [3]. The term 'content' in this context might refer to colors [4], [5], shapes [6], textures [7], features [8] or any other information that can be derived from the image itself. The term 'content' in this context might refer to colors, shapes, textures, or any other information that can be derived from the image itself. Here we are combining the two approaches viz. feature extraction and color extraction to obtain more efficient image retrieval.
Common CBIR systems perform two main operations in their approach [1], [9].The first one is feature extraction (FE) [8], where a set of features, called image signature or feature vector. Features of an image should have a strong relationship with semantic meaning of the image. In the second step, CBIR system retrieves the relevant images from the image data base for the given query image, by comparing
Manuscript received June 29, 2011, revised August 31, 2011.
Venu Shah is a Sr. Professor with Atharva College of Engineering, Malad (W), Mumbai-400095, India (email: [email protected]).
Pavan Bhat, Mahesh Dasarath, Shipra Gupta, Jackie Bhavsar are B.E EXTC students of Atharva College of Engineering, Malad (W), Mumbai-400095, India.
(email: [email protected], [email protected], [email protected], [email protected])
the feature of the query image and images in the database. Relevant images are retrieved according to minimum distance or maximum similarity [10] measure calculated between features of query image and every other image in the image database.
II. KEKRE TRANSFORM
Kekre Transform matrix can be described as a square matrix of any order N X N which need not have to be in powers of 2 unlike most of other transforms. All the upper diagonal and diagonal values of Kekre Transform matrix are ones, while the lower diagonal values just below the diagonal are zeros. The generalized Kekre Transform matrix can be represented in matrix form as under:
(1) The above matrix can be generated using the following mathematical relation:
(2)
For taking Kekre Transform of an image of the size NxN, the numbers of required multiplications are (N-1) and numbers of additions are 2N (N-1).
III. KEKRE TRANSFORM COMBINATION IMAGE RETRIEVAL
The image retrieval process has two main steps of Feature Extraction and Query Execution. The retrieval process initiates by applying Kekre Transform matrix to row mean vectors and column mean vectors of the image to get Kekre transform row mean vectors and column mean vectors respectively as shown below.
Row Mean Vector = [Average (Row-1), Average (Row-2), …., Average (Row-n)] (3)
Column Mean Vector = [Average (Column-1), Average (Column-2),…., Average (Column-n)] (4)
These coefficients are used to extract features from both
Content Based Image Retrieval Using Combination of
Kekre Transform and HSV Color Segmentation
the query image and the image from the database with the multiplication of the Kekre Transform matrix with the row mean and column mean vectors. For identifying the similarity measure between the query image and the database image, we calculate the Euclidian Distance for row coefficient and column coefficient respectively. However, the two steps of deriving the row coefficient and column coefficient and their combination can be used as individual methods by just using Kekre Transform with row mean/column mean for the whole image. But effectiveness can be obtained by considering the combination of the two methods.
1 Column mean and row mean concept as applied to image retrieval
This feature vector is used for comparison with the images in the database and matching for each image is calculated using Minkowski Metric (LM norm) equation. Euclidian distance is one of the special cases derived from the Minkowski metric when the equation has a power of 2. Thus, the Euclidian Distance obtained can be represented mathematically as follows:
(5)
IV. ADAPTIVE HSVSEGMENTATION
The pre-processing procedure constitutes of HSV color space which is widely used in computer graphics.Then, the image retrieval process using adaptive segmentation of HSV is carried out by converting its RGB colour space to HSV colour space using the formulae given in figure as follows .
Since the RGB values generally lie in the range of 0 to 255 we need to use the formulae given below, which will convert the Hue values between 0° and 360°, Saturation values between 0 and 1 and values between 0 and 1.
(9)
(10)
(11) After the conversion from RGB colour space to HSV colour space of the entire image, the image is divided into m different regions depending on the values of hue and saturation. The TABLE I illustrates the fact that the hue is divided into partitions of 20° is done in order to separate the 3 primary colours and yellow magenta and cyan into 3 sub-divisions each. And the saturation for each hue is further sub-divided by 0.2. Due to this we get 18*5=90 different regions of colour distribution in the image.
After dividing the image into various regions using table given above the pixels present in each region of the image are selected. Then the corresponding hue values are extracted and grouped together to form a hue vector. This vector for every region is divided into n segments depending on the number of pixels in the hue vector of the region. If the number of pixels in the region are more the hue vector will be divided into more number of segments and if the number of pixels in the region are less the hue vector will be divided into less number of segments.
TABLEI:DIFFERENT RANGES OF HUE AND SATURATION USED IN IMAGE
RETRIEVAL PROCESS
In order to partition the regions into various segments we need to use the following equation.
(12)
where, ni represents the number of segments in region I, Xi represents the number of pixels in region i (where i ranges from 1 to m), T represents total number of pixels of the image, and TS represents total number of required segments of the entire HSV image.
After this process of breaking the various regions into segments the necessary colour distribution information is calculated by finding the maximum occurrence in each segment by using the hue histogram. Using this information we can generate the feature vector of the image.
In order to perform an image retrieval operation we need to
D =
^Vpi- Vqih2i= 1 n
/
S =
255
S
V =
255
V
(6)
(7)
generate a feature vector for the database image from individual regions. This feature vector is used in comparing both the images by using the Euclidean distance equation. Segments in each region of the query image are compared with the corresponding region of the database image using the Euclidean distance equation as given in eqn (5). Once the Euclidean distance of the individual regions is computed the summation of sqaures of all the regions is computed and the under root is taken to get the final distance that can be used to compare various images. Database images having a lower distance will be similar to the original image.
V. PROPOSED ALGORITHM
Steps for proposed algorithm for Feature Extraction: 1. Take a query input image.
2. Calculate row mean and column mean for the image. 3. Apply Kekre transform on the row mean and the
column mean to obtain Kekre Transform row mean and Kekre Transform column mean respectively.
4. Compare these query image coefficients with the database coefficients using Euclidian Distances (D1 and D2) as a measure of similarity for row mean and column mean coefficients respectively.
5. Calculate mean (M1) of D1 and D2.
6. Now follow the steps given in proceeding algorithm.
Fig. 2. Flowchart for Proposed Algorithm
Steps for proposed algorithm for Colour Extraction: 1. Take a query input image.
2. Convert the image from RGB colour space to HSV colour space.
3. Divide the image into different areas based on the ranges mentioned in TABLE I.
4. Further divide the areas obtained into segments depending on the number of pixels in each area, using the relation given in eqn.(B)
5. Find the maximum colour occurrence from each segment by calculating the mode of Hue values in it. 6. Find Euclidian distances of corresponding areas in
query image and the database image considering the included segments individually.
7. Find the summation of all the squares of all the Euclidian distances obtained in the previous step and take under root (M2).
Steps proposed for The Merging Concept:
1. To merge the results obtained by Feature extraction and Colour Extraction, we require the final values M1 and M2 from the above proposed steps of feature and colour algorithms respectively.
2. Taking the mean of M1 and M2 would suffice to obtain results.
3. But we must obtain the Euclidian Distance or Mean (M) between M1 and M2 in order to acquire optimum results through better similarity measure between the query image and the database images.
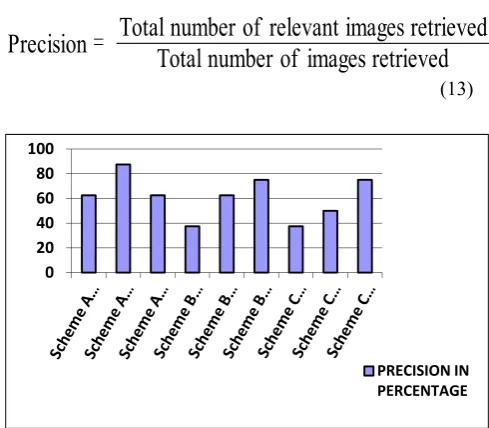
4. Thereby, sorting the values of M would result into an effective content based image retrieval process. A comparative study can be made on the calculation of the precision and recall parameters of the individual schemes listed above using the formulae as illustrated below.
(13)
Fig. 3. Precision in percentage for CBIR Technique.
(14)
Fig. 4. Recall in percentage for CBIR Technique.
Precision
=
Total number of images retrieved
Total number of relevant images retrieved
0 20 40 60 80 100
PRECISION IN PERCENTAGE
Recall
=
Total number of relevant images in the database
Total number of relevant images retrieved
0 20 40 60 80 100
RECALL IN PERCENTAGE
Query Image
Proposed Kekre
Algorithm Proposed HSV
Database Image Database Image
Merging Concept (Euclidian Distance)
From the column graphs shown above we can realize that the output obtained in Scheme C which follows the combination logic gives more averaged and stable results as compared to Scheme A and Scheme B which follow Color and Feature logic respectively. Precision and Recall can be denoted in percentages. P and R can be represented as the number of relevant images retrieved and the number of relevant images in the database respectively. Also, the total number of images on result be N and the total number of images in the database be X.
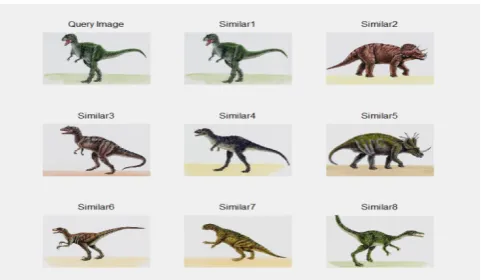
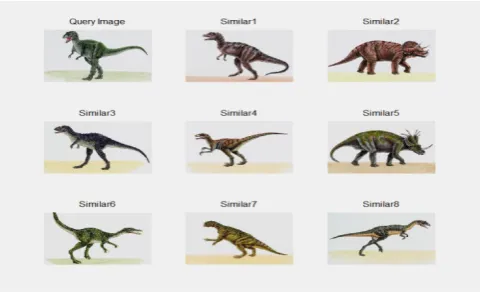
Fig. 5. Final result of CBIR using Kekre Transform 113.jpg from PENN university database
Fig. 6. Final result of CBIR using adaptive HSV segmentation obtained
from i/p image 113.jpg from PENN university database
Fig. 7. Final result of CBIR using combination logic for input image 113.jpg from PENN university database
Fig. 8. Final result of CBIR using Kekre 227.jpg from PENN university database
Fig. 9. Final result of CBIR using adaptive HSV segmentation obtained from i/p image 227.jpg from PENN university database
Fig. 10. Final result of CBIR using combination logic for input image 227.jpg from PENN university database
Then aligning the images into ascending order, thereby displaying the images based on the extent of similarity with the query image.
VI. RESULTS
The outcome of the experiment can be achieved by arranging the obtained mean of both the algorithms in ascending order. The proposed algorithm has been implemented using the database of Penn State University for experimentation. Any database which may have a clear distinction in either the features or the colours of the photos so that the results through the combination algorithm can be optimized as we can see in the case of fig.11, 12, & 13 as compared to the other results displayed in the other query searched. Since our algorithm is based on both features and colour information and a combination of both is also implemented.
The bar graph comparing precision and recall obtained from the three algorithms with three different set of query images is shown above in figure 9 and 10. The details of the graph have been calibrated using the data available from the comparisons of the 3 schemes in Table II. Thus, the graph shows that the combination of adaptive HSV segmentation and Kekre’s transform gives a stable and an averaged result.
TABLEII.COMPARISON OF CBIR SCHEMES USED
VII. CONCLUSION
The Image retrieval process involves combination of both Kekre Transform and adaptive segmentation of HSV color space for image retrieval. In Kekre transform the image vector is converted to a row mean and column mean vector and then multiplied with the Kekre transform matrix to get the Kekre row and column mean vectors. After this the Euclidean distance is computed using the query image and the database image. Thus we get 2 Euclidean distances for Kekre row and column mean vector which are combined together by taking the mean respectively for query and database images. In adaptive segmentation of HSV the regions are initially computed and further divided into number of segments depending upon the number of pixels in the region. After this the Euclidean distances for the individual regions is calculated using the query image and the summation of squares of all the regions is performed and under root is taken thereafter. Finally the combination of Kekre transform and adaptive Segmentation of HSV color space takes place by calculating the mean of the resulting Euclidean distances obtained and arranging the values in ascending order and thereby the best image being arranged at the top.
ACKNOWLEDGEMENT
Among the wide panorama of people who provided us help & motivation to complete this paper, we express our deepest thanks to respected Dr. Anupama Deshpande for her never ending encouragement, moral support and patience at all stages. We are also obliged to the college, Atharva College of Engineering for providing us all the facilities required, without which it would have been difficult to complete our paper.
REFERENCES
[1] H.B.Kekre, Sudeep D. Thepade, “Rendering Futuristic Image Retrieval System”, In Proc. of National Conference EC2IT-2009, KJSCOE,
Mumbai, 20-21 Mar 2009.
[2] N.Krishnan, M.Sheerin Banu, C.Callins Christiyana, “Content Based
Image Retrieval using Dominant Color Identification Based on Foreground Objects”, In International Conference on Computational Intelligence and Multimedia Applications, 2007.
[3] H.B.Kekre, Sudeep D. Thepade, “Image Retrieval using Non-Involutional Orthogonal Kekre’s Transform”, International Journal of Multidisciplinary Research and Advances in Engineering
Fig. 12. Final result of CBIR using adaptive HSV segmentation obtained from i/p image 412.jpg from PENN university database
(IJMRAE), Ascent Publication House, 2009, Volume 1, No.I, 2009. Abstract available online at www.ascent-journals.com.
[4] Youngeun An, Muhammad Riaz and Jongan Park, “CBIR based on adaptive segmentation of HSV color space,” 2010, 12th
International Conference on Computer Modelling and Simulation.
[5] W.-K. Chen, Linear Networks and Systems. Belmont, Calif.: Wadsworth, pp. 123-135, 1993.
[6] Mehrotra, R. And Gary, J. E. 1995. Similar-shape retrieval in shape
data management. IEEE Computer 28, 9 (September), pp.57-62.
[7] B. S. Manjunath and W.Y. Ma. Texture Feature for Browsing and Retrieval of Image Data. IEEE Transactions on Pattern Analysis and Machine Intelligence, Vol. 8, No. 8, 1996.
[8] P. Gangadhara Reddy,”Extraction of Image Features for an Effective CBIR System”.
[9] H.B.Kekre, Sudeep D. Thepade, “Scaling Invariant Fusion of Image Pieces in Panorama Making and Novel Image Blending Technique”,
International Journal on Imaging (IJI), Autumn 2008, Volume 1, No.
A08.
[10] S. Satini, R. Jain. Similarity Measures. IEEE Transactions on pattern
analysis and machine Intelligence, Vol.21, No.9, pp. 871-883,
September 1999.
[11] S. Chen, B. Mulgrew, and P. M. Grant, “A clustering technique for digital communications channel equalization using radial basis function networks,” IEEE Trans. on Neural Networks, vol. 4, pp.
570-578, July 1993.
[12] J. U. Duncombe, “Infrared navigation—Part I: An assessment of feasibility,” IEEE Trans. Electron Devices, vol. ED-11, pp. 34-39, Jan. 1959.
[13] C. Y. Lin, M. Wu, J. A. Bloom, I. J. Cox, and M. Miller, “Rotation, scale, and translation resilient public watermarking for images,” IEEE
Trans. Image Process., vol. 10, no. 5, pp. 767-782, May 2001.
Venu Shah is currently pursuing M.E. from VESIT,
Chembur. She has 9 years of experience in teaching. She is presently working as a Senior Lecturer in Department of Electronics and Telecommunications at Atharva College of Engineering, Mumbai. Her area of interest is Wireless Networks and Image Processing. She is a member of ISTE. She has 2 papers in National conference in 2010 to her credit and three papers published in International Journals in July and august 2011 editions.
Pavan Bhat has completed his B.E. (Electronics and Telecommunications) degree from Mumbai University. He is an IEEE member. His areas of interest are Image Processing and Computer Communication Networks.
Mahesh Dasarath has completed his B.E. (Electronics and Telecommunication) degree from Mumbai University. He is an IEEE member. His areas of interest are VLSI and Image Processing.
Shipra Gupta has completed her B.E. (Electronics and Telecommunications) degree from Mumbai University. Her areas of interest are Signal Processing and Image Processing.