1
International Journal of Research in Social Scienceshttp://www.ijmra.us, Email: [email protected] AGRICULTURAL DIVERSIFICATION AND AGRO-CLIMATIC ZONES OF
BIHAR
Dr. Ram Pravesh Yadav* Associate Professor*
University Department of Geography* BRA Bihar University , Muzaffarpur (Bihar)* Abstract:
2
International Journal of Research in Social Scienceshttp://www.ijmra.us, Email: [email protected] divided into two unequal halves by the river Ganga which flows through the middle from west to east.Bihar with a geographical area of about 94.2 thousand square km is divided by river Ganges into two parts, the north Bihar with an area of 53.3 thousand square km and the south Bihar having an area of 40.9 thousand square km. Based on soil characterization, rainfall, temperature and terrain, four main agro-climatic zones in Bihar have been identified. These are: Zone-I, North Alluvial Plain, Zone-II, north East Alluvial Plain, Zone-III A South East Alluvial Plain and Zone-III B, South West Alluvial Plain, each with its own unique prospects. The principal agricultural crops are rice, paddy, wheat, jute, maize and oil seeds. Cauliflower, cabbage, tomato, radish, carrot, beat etc. are some of the vegetables grown in the state. Sugarcane, potato and barley are some of the non-cereal crops grown. The entire agricultural operations are divided into two crop seasons Kharif and Rabi. The Kharif season starts from the third week of May and lasts till the end of October followed by the Rabi season.
Keyword:
Agricultural Diversification, Mechanization, commercial agriculture, Agro-climatic zones, Land holding size, Food grains, Farmers, wheat, rice, Vegetables
Introduction:
Bihar, being the part and parcel of the Middle Ganga Plain consists an agricultural dominated economy. The principal agricultural crops are rice, paddy, wheat, jute, maize and oil seeds. Cauliflower, cabbage, tomato, radish, carrot, beat etc. are some of the vegetables grown in the state. Sugarcane, potato and barley are some of the non-cereal crops grown. The entire agricultural operations are divided into two crop seasons Kharif and Rabi. The Kharif season starts from the third week of May and lasts till the end of October followed by the Rabi season. Though endowed with good soil, adequate rainfall and good ground water availability, Bihar has not get realized its full agricultural potential. Its agricultural productivity is one of the lowest in the country, leading to rural poverty, low nutrition and migration of labour. This road map is aimed to trigger processes of development in agriculture and allied sector.The state is endowed with rich biodiversity.
Geographical Personality:
Bihar has roughly a rectangular shape between 24021‘10‖ north latitude and 27031‘15‖ north latitude and again between 83019‘50‖ east meridian and 88017‘04‖ east meridian. The maximum north-south extension of Bihar is 345 kms. while the maximum east-west extension is 483 kms. The state is delimited by Nepal in the north and by Jharkhand in the south. Bengal delimits the state from the east and U.P. delimits it from the west. The total geographical area of Bihar is 94163 sq. kms.
3
International Journal of Research in Social Scienceshttp://www.ijmra.us, Email: [email protected] Methodolgy and sources of data :
The present research paper is based mostly on secondary data but some facts have been evaluated with the help of primary data also. Data have been procured from the Agricultural Census Division, Ministry of Agriculture, New Delhi, Statistics and Evaluation Department, Govt. of Bihar, Agricultural Department, Govt. of Bihar, Central Water Commission Deptt. of Water Resource, Bihar and Central Ground Water Board, New Delhi, etc. Tha data procured from these sources have been tabulated and analyzed to find out the related facts. The generalized facts have been described in order to complete the present research paper.
Hypothesis :
The formulation of hypothesis becomes essential for improving the quality and utility of the research paper. The formulation of hypothesis is as follows:
The agricultural dimension in Bihar may provide a wider space for the development of agro-based industries in Bihar.
The agricultural dimension as well as agro-based industries may creat a big employment opportunity in Bihar.
Description :
4
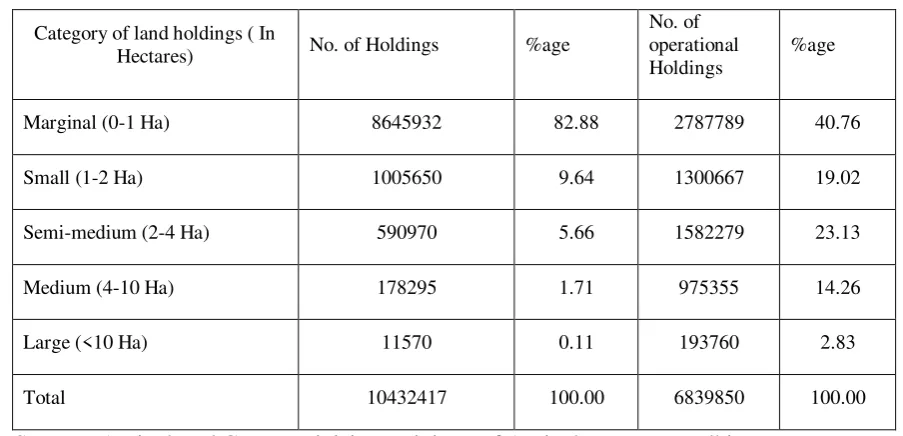
International Journal of Research in Social Scienceshttp://www.ijmra.us, Email: [email protected] MODE, viz. on honey bee, seed production including seed villages, conservation agriculture, integrated farming and vermi-compost. Bihar has a total geographical area of 93.60 lakh hectares on which it houses a population of 82.9 million, thereby generating a population density of 880 persons per sq. km (Census 2001). Gross sown area in theState is 79.46 lakh hectares, while net sown area is 56.03 lakh hectares. There are around 1.04 crore landholdings in the State of which around 83 percent are marginal holdings of size less than 1 hectare( Table). With around 90 percent of the total population living in rural areas, agriculture as the primary feeder of rural economy continues to operate not only on margins of land but also on the margins of human enterprise, its productivity being among the lowest in the country. Without increasing returns to these margins, not much can be done realistically to develop the agricultural sector. Thus, agriculture continues to define both the potentialities and constraints to development in Bihar.
Table - 1.1Distribution of Land Holdings by size class in Bihar, 2016-17
Category of land holdings ( In
Hectares) No. of Holdings %age
No. of operational Holdings
%age
Marginal (0-1 Ha) 8645932 82.88 2787789 40.76
Small (1-2 Ha) 1005650 9.64 1300667 19.02
Semi-medium (2-4 Ha) 590970 5.66 1582279 23.13
Medium (4-10 Ha) 178295 1.71 975355 14.26
Large (<10 Ha) 11570 0.11 193760 2.83
Total 10432417 100.00 6839850 100.00
Source : Agricultural Census Division, Ministry of Agriculture, New Delhi
Table 2.1 : Distribution of land Holdings by Size Class
%age
Marginal (0-1 Ha)
Small (1-2 Ha)
5
International Journal of Research in Social Scienceshttp://www.ijmra.us, Email: [email protected] Source :Agricultural Census Division, Ministry of Agriculture, New Delhi
Percentage Distribution of Landholdings by Size Class
2%
6% 0%
10%
82%
Marginal (0-1Ha.) Small (1-2 Ha.)
Semi medium (2-4 Ha.)
Medium (4-10 Ha.) Large (10-above Ha.)
%age
Marginal (0-1 Ha)
Small (1-2 Ha)
6
International Journal of Research in Social Scienceshttp://www.ijmra.us, Email: [email protected] Agriculture in Bihar is crucially dependent on monsoon. Although around 57 percent of its gross cultivated area is irrigated, irrigation itself is crucially dependent on monsoon as it largely depends on the use of surface water. According to the soil quality and climatic conditions of the relevant areas, Bihar has been classified in 3 agro-climatic zones : North-West Alluvial Plane ( Zone1), North-East Alluvial Plane ( Zone 2), and South Alluvial Plane (Zone 3), the last zone being further classified in two sub-zones 3A and 3B ( Table 2.2). Monsoon arrives earliest in the north-eastern Zone2, which also receives the highest rainfall among all three zones. Zone 3 receives monsoon showers last of all three zones and also the least amount. Total irrigated area in the State is 45.67 lakh hectares, of which nearly 30 percent is fed by canal water. This highlights the monsoon dependence of even irrigated lands as catchment areas of nearly all the major rivers in the State are outside the state.
2.2 Agricultural Production in 2016-17
Kharif 2016 started with a probability of a normal rainfall, but the deviation for the first showers of the monsoon was (-)48 percent. Rainfall in the month of June and July was normal, but was again below normal by 57 percent in August. It was again normal in the month of September. Finally, rainfall was 19 per cent below normal for the entire monsoon. This seems to have adversely affected area under cultivation. Area under paddy in the State according to the second advance estimate for kharif 2006 was 31.30 lakh hectares (Table 2.3) against the target of 37.00 lakh hectares (Table 2.4). Similarly, area under wheat for rabi 2016 stood at 20.34 lakh hectares, falling short of a target of 24.00 lakh hectares. Thus, there has been a fall in the area under foodgrains from 65.48 lakh hectares in 2015-16 to 61.55 lakh hectares in 2016-17 (Table 2.5). Under the conditions of deficient rainfall and a fall in acreage, foodgrain output is expected to register a fall over the figures for 2015-16. The second advance estimate of foodgrains for 2016-17 is 82.10 lakh MT. For kharif 2016-17 foodgrain production has been estimated at 40.04 lakh MT over an area at 34.83 lakh hectares. For rabi 2016-17 the estimate of foodgrain production is of 42.06 lakh MT over an area of 26.73 lakh hectares. This is a fall of around 4 lakh MT from previous year‘s production of around 86 lakh MT. Effect of falling acreage on production of foodgrains has, however, been moderated by an increase in yield from 12.39 qnts/hectare in 2005-06 to 13.34 qntls/hectare in 2016-17 (Table 2.6).
Cereal production is expected to fall by almost 3 lakh MT to 78 lakh MT as compared to previous year‘s production of 81 lakh MT(Table 2.7). This fall largely comes from a fall in acreage under cereals by almost 9 lakh hectares. Within cereals, fall in production is largely caused by fall in maize output by almost around 4 lakh MT. Other coarse cereals too are estimated to register a marginal fall in, both, acreage and production. While both rice and wheat are estimated to suffer a minor fall in acreage, their production is likely to improve over previous year due to increase in productivity (Table 2.5).
7
International Journal of Research in Social Scienceshttp://www.ijmra.us, Email: [email protected] Table 2.2 : Agro-Climatic Zones in Bihar and north Bihar
Agro climatic
Districts Soil Ph
Initiation/Ce Total
Temperature
Important
ssation of Rainfall Cropping
Zones ( dg. Celcius)
rainfall (mm) Sequence
Maximu Minimu
m m
Zone-1 Saran, Siwan, Sand 6.5 12th June/ 1040 – 1450 36.6 7.7 Rice – Wheat,
(North west
Gopalganj, y – 30th Sep to (1245.00) Rice-Rai, Rice-
E.Champaran, loam, 8.4 10th Oct Sweet Poatato,
alluvial plane
W.Champaran, loam Rice-
zone- Pusa)
Sheohar, Sitamarhi, Maize(Rabi),
Madhubani, Maize-Wheat,
Darbhanga, Maize-Sweet
Muzzafarpur, Potato, Maize-
Vaishali, Samastipur, Rai, Rice-lentil
Begusarai
Zone-2 Supaul, Khagaria, Sand 6.5 7th June/30th 1200 – 1700 33.8 8.8 Jute-Rice, Jute-
(North-East
Saharsa, Madhepura, y – Sep to 10th
( 1450.00)
Wheat, Jute-
Purnea, Katihar, loam, 7.8 Oct Potato, Jute-
Alluvial Plane
Kishanganj, Araria, Clay Kalai, Jute-
zone- Purnea)
Naugachia. loam Mustard, Rice-
8
International Journal of Research in Social Scienceshttp://www.ijmra.us, Email: [email protected]
Rice-Toria
Zone 3 Sand 6.8 990 – 1240 37.1 7.8 Rice-Wheat,
y – (1115.00) Rice-Gram, Rice-
loam, 8.0 Lentil, Rice-Rai
Clay
loam,
loam,
Clay
Zone-3A Sheikhpura, 15th June/30th
(South
Lakhisarai, Jamui, Sep to 10th
Banka, Munger and Oct
Alluvial Plane
Bhagalpur
Zone- Sabour)
Zone-3B Bhabhua, Rohtas, 10th June/
(South
Aurangabad, Buxar, 30th Sep to
Bhojpur, Jehanabad, 10th Oct
Alluvial Plane
Gaya, Nalanda,
Zone –
Patna, Nawada
Sabour)
9
International Journal of Research in Social Scienceshttp://www.ijmra.us, Email: [email protected] Table 2.3 : Second Advance Estimates of Area and Production of Crops for 2016-17
Area ( 000, hectares) Production ( 000, tones ) Yield (kg/hectare)
Kharif Rabi Total Kharif Rabi Total Kharif Rabi Total
1 2 3 4 5 6 7 8 9 10
Rice 3130.905 3130.905 3527.822 3527.822 1127 1127
Wheat - 2034.305 2034.305 - 3238.614 3238.614 - 1592 1592
Jawar 5,870 - 5,870 5,958 - 5,958 1015 - 1015
Bajra 4,039 - 4,039 4,310 - 4,310 1067 - 1067
Maize 268,015 200,124 468,139 411,913 580.76 992.673 1537 2902 2120
Ragi 16.011 - 16.011 11.560 - 11.560 722 - 722
Small Millets 4,246 - 4,246 3,172 - 3,172 747 - 747
Barley - 18,709 18,709 - 21,066 21,066 1126 - 1126
Coarse 298.181 218.138 517.014 436.913 601.826 1038.739 1465 2750 2009
Cereals
Cereals 3429.086 2253.138 5682.204 3964.735 3840.440 7805.175 1156 1704 1374
Tur - 35.814 35.814 - 46.845 46.845 - 1308 1308
Urad 28.415 - 28.415 21.340 - 21.340 751 - 751
10
International Journal of Research in Social Scienceshttp://www.ijmra.us, Email: [email protected] Other Kharif 14.900 - 14.900 11.86 - 11.860 796 - 796
Pulses
Gram - 71.989 71.989 - 65.006 65.006 903 - 903
Other Rabi - 311.704 311.704 - 253.834 253.834 - 815 815
Pulses
Total Pulses 54.188 419.507 473.695 39.332 365.685 405.017 726 871 855
Total food 3483.274 2672.645 6155.919 4004.067 4206.125 8210.192 11.50 15.74 13.34
Grains
Ground Nut 0.716 - 0.716 0.354 - 0.354 494 - 494
Castor Seed - 0.133 0.133 - 0.127 0.127 - 957 957
Sesamu
m 3.635 - 3.635 2.824 - 2.824 777 - 777
Niger Seed - - - -
Sun Flower 2.604 6.047 8.651 3.573 8.871 12.444 1372 1467 1438
Soyabea
n - - - -
Rapesee
d and - 83.021 83.021 - 68.658 68.658 - 827 827
Mustard
11
International Journal of Research in Social Scienceshttp://www.ijmra.us, Email: [email protected] Safflowe
r 2.604 6.047 8.651 3.573 8.871 12.444 1372 1467 1438
Total oil 6.955 120.073 127.028 6.751 103.795 110.546 971 864 870
seeds
Cotton* - - - -
Jute* 127.847 - 127.847 1191.963 - 1191.963 1678 - 1678
Mesta 12.990 - 12.990 118.357 - 118.357 1640 - 1640
Jute and - - - -
Mesta
Sugarcane 103.115 - 103.115 4131.509 - 4131.509 40067 - 40067
Onion 14.863 - 14.863 123.66 - 123.660 8.32 8.32
Potato 52.580 90.535 143.115 421.692 811.194 1232.886 8.02 8.96 8.61
12
International Journal of Research in Social Scienceshttp://www.ijmra.us, Email: [email protected]
Table 2.4 : Target area and Production of crops for 2016-17 (Area-lakhhectares/Production-lakh MT)
Name of Crop
Kharif Rabi Total
Area Production Area Production Area Production
Rice 37.00 68.00 2.50 6.00 39.50 74.00
Wheat 00 00 24.00 58.00 24.00 58.00
Maize 4.00 6.95 6.00 19.00 10.00 25.95
Other Coarse Cereals 0.75 0.75 0.50 0.50 1.25 1.25
Pulses 2.50 2.30 8.50 9.00 11.00 11.30
Total Foodgrains 44.25 78.00 41.50 92.50 85.75 170.50
Oilseeds 0.25 0.18 3.56 2.90 3.81 3.08
13
International Journal of Research in Social Scienceshttp://www.ijmra.us, Email: [email protected] 2.3 Long-term Trend In Food grains Production
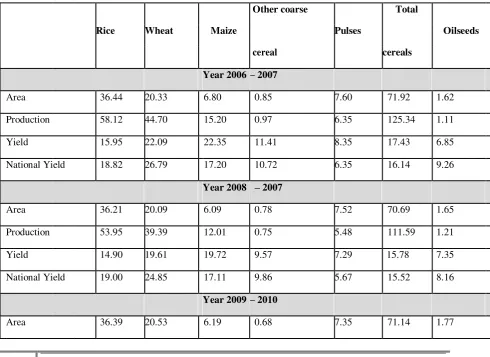
Food grain production in Bihar has shown high volatility, but there is a long-term trend of falling production in the State. Cereal production has fallen sharply from 122.29 lakh MT in 2011-12 to 81.12 lakh MT in 2015-16( Table 2.7). This fall in production has been accompanied by an almost secular decline in area under cereal production from 70.19 lakh hectares in 2015-2016 to 65.87 lakh hectares in 2016-17. Larger part of the fall in production and area is explained by the fall in production of and area under rice (Table2.5). Though production of wheat too has fallen, but area under it has largely been unchanged around 20 lakh hectares. Fall in production of wheat been due to its falling yield. While it‘s yield in the later half of nineties hovered around 22 qtls / hect, it has steadily fallen thereafter, reaching 21.46 qtls/hect in 2010-11 and still lower at 13.94 qtls / hect in 2015-16 ( Table 2.5). Pulses too have seen a fall in production and acreage, but the fall has been moderate. Their production has fallen from 5.47 lakh MT in 2010-12 to 4.83 lakh MT in 2015-16, with acreage falling in the corresponding period from 6.94 lakh hectares to 6.55 lakh hectares. While there has been a marginal fall in the productivity of pulses, but their yield rates have remained significantly above the national average. Acreage and production of coarse cereals have largely been unchanged over the last few years. For maize, there has been a rise in production from around 12 lakh MT in late nineties to nearly 15 lakh MT in 2015-16, with almost unchanged acreage and rising productivity, from around 20 qtls/hect to 23 qtls/hect over the same period.Acreage and production of oilseeds has more or less hovered around 1.4 lakh hectares and 1.2 lakh MT in recent years with moderate fluctuations.
14
International Journal of Research in Social Scienceshttp://www.ijmra.us, Email: [email protected] MT over an area of 22.53 lakh hectares. The fall in production has been largely on account of fall in area from 65.87 lakh hectares in 2005-06 to 56.82 lakh hectares in 2016-17. The second advance estimates for 2016-17 have put the production figures for coarse cereals at 10.38 lakh MT on an area of 5.17 lakh hectares and an yield of 20.09 quintals/hectare. Production of pulses has been estimated at 4.05 lakh MT and that of oilseeds at 1.11 lakh MT. Estimates put the area under sugarcane cultivation at 1.43 lakh hectares with an output of 12.33 lakh MT.
The observed trend of fall in acreage and production of cereals, is not incidental occurrence or happening but has been a deliberate effort by the State government during the last five years, to divert land under rice and wheat cultivation towards horticulture. Plan of crop diversion has been given priority in 12 districts of the state. About 30 percent of area under wheat in the districts of Muzaffarpur, Darbhanga, Samastipur and Madhubani (Zone 1 districts) is being considered for diversion towards mango, litchi and makhana. Similarly 20 percent of crop area in the districts of East Champaran, Samastipur, Khagaria, Muzaffarpur and Vaishali is being considered for diversion towards banana. Further, about 20 percent of rice-wheat area in the districts of Buxar, Bhojpur, Sasaram etc. is likewise being considered for diversion towards vegetable production. Finally, about 30 percent total area of the state is being considered for diversion from current crops towards new crops.
Table 2.5 : Area, Production & Productivity of Foodgrains and Oilseed
Rice Wheat Maize
Other coarse
Pulses
Total
Oilseeds
cereal cereals
Year 2006 – 2007
Area 36.44 20.33 6.80 0.85 7.60 71.92 1.62
Production 58.12 44.70 15.20 0.97 6.35 125.34 1.11
Yield 15.95 22.09 22.35 11.41 8.35 17.43 6.85
National Yield 18.82 26.79 17.20 10.72 6.35 16.14 9.26
Year 2008 – 2007
Area 36.21 20.09 6.09 0.78 7.52 70.69 1.65
Production 53.95 39.39 12.01 0.75 5.48 111.59 1.21
Yield 14.90 19.61 19.72 9.57 7.29 15.78 7.35
National Yield 19.00 24.85 17.11 9.86 5.67 15.52 8.16
Year 2009 – 2010
15
International Journal of Research in Social Scienceshttp://www.ijmra.us, Email: [email protected]
Production 52.91 42.92 12.09 0.73 6.69 115.34 1.51
Yield 14.54 20.91 19.53 10.74 9.10 16.21 8.53
National Yield 19.21 25.90 17.57 10.68 6.34 16.27 9.44
Year 2009 – 2010
Area 35.96 20.81 6.38 0.64 7.22 71.01 1.57
Production 55.47 45.84 14.27 0.69 6.20 122.46 1.15
Yield 15.43 22.03 22.37 10.78 8.59 17.24 7.32
National Yield 19.86 27.78 17.92 10.34 6.35 17.04 8.53
Year 2010 – 2011
Area 36.56 20.68 6.21 0.56 7.17 71.18 1.54
Production 54.44 44.36 14.97 0.58 6.22 120.59 1.31
Yield 14.89 21.46 24.11 10.37 8.67 16.94 8.51
National Yield 19.01 27.08 18.22 10.27 5.44 16.26 8.10
Year 2011 – 2012
Area 35.52 21.23 5.94 0.53 6.94 70.19 1.39
Production 52.03 43.91 14.88 0.53 5.47 116.82 1.17
Yield 14.65 20.68 25.05 10.00 7.88 16.64 8.41
National Yield 20.79 27.62 20.00 11.31 6.07 17.34 9.13
Year 2012 – 2013
Area 35.85 21.31 6.04 0.53 6.98 70.69 1.37
Production 50.86 40.41 13.50 0.48 5.61 110.85 1.05
Yield 14.19 18.96 22.35 9.06 8.04 15.68 7.66
National Yield 18.04 26.19 16.42 9.62 5.56 15.62 7.10
Year 2013 – 2014
Area 35.78 20.77 6.16 0.47 6.80 69.98 1.41
Production 54.48 36.89 14.74 0.43 5.57 112.11 1.24
Yield 15.23 17.61 23.93 9.15 8.19 16.02 8.79
National Yield 20.50 27.07 19.83 12.28 6.23 17.07 10.72
16
International Journal of Research in Social Scienceshttp://www.ijmra.us, Email: [email protected]
Area 31.23 20.28 6.14 0.44 6.58 64.67 1.32
Production 24.72 32.63 14.66 0.39 4.67 77.07 1.17
Yield 7.91 16.09 23.88 8.86 7.09 11.92 8.66
Year 2015 – 2016 (4th advance estimate)
Area 32.22 20.38 6.22 0.51 6.55 65.87 1.36
Production 34.17 28.40 14.25 0.48 4.83 81.12 1.19
Yield 10.60 13.94 22.92 9.41 7.37 12.47 8.73
Year 2016-17 (
2nd advance estimates)
Area 31.31 20.34 4.68 0.49 4.73 56.82 1.27
Production 35.28 32.39 9.93 0.46 4.05 78.05 1.11
yield 11.27 15.92 21.20 9.38 8.55 13.74 8.70
Note : Area in lakh hectare, production in lakh MT and yield rates in qtls/hectare Source : Statistics and Evaluation Dept., GOB
Table 2.6 : Productivity of Different Crops ( Quintals / hectare)
Year Rice Wheat Maize Pulses Oilseeds
State
Nation
State
Nation
State
Nation
State
Nation
State
Natio
al al al al nal
2003- 2004 14.15 18.88 21.30 23.80 21.50 16.02 7.09 5.98 7.05 7.99 2004- 2005 13.52 19.11 21.08 25.59 20.61 15.70 7.38 6.10 7.07 8.43 2005- 2006 12.18 17.97 20.06 24.83 20.14 15.95 6.15 5.52 6.84 8.51 2006- 2007 15.95 18.82 22.09 26.79 22.35 17.20 8.35 6.35 6.35 9.26 2007- 2008 14.90 19.00 19.61 24.85 19.72 17.11 7.29 5.67 7.38 8.16 2008- 2009 14.54 19.21 20.91 25.90 19.54 17.97 9.10 6.34 8.55 9.44 2009- 2010 15.43 19.86 22.03 27.78 22.37 17.92 7.96 6.35 7.32 8.53 2010-2011 14.89 19.01 21.73 27.08 24.54 18.22 8.35 5.44 7.44 8.10
2011-12 14.65 20.79 20.65 27.62 25.04 20.10 7.88 6.07 8.41 9.13
17
International Journal of Research in Social Scienceshttp://www.ijmra.us, Email: [email protected]
2013-14 15.23 20.51 17.61 27.07 23.93 19.83 8.19 6.23 8.79 10.72 2014-15
7.91 - 16.09 - 23.88 - 7.09 - 8.86 -
2015-16
10.6 - 13.94 - 22.92 - 7.37 - 8.7 -
2016-17 11.27 - 15.92 - 21.20 - 8.55 8.73
Source : Statistics and Evalutation Dept., GOB
2.4 Flood Control and Drainage:
Every year, Bihar faces the vagaries of flood and waterlogging. After bifurcation of the State, Bihar has become the most flood prone area in the country. Total flood prone area of the State is 68.80 lakh hectares which is 73.06 percent of its total geographical area and 17.2 percent of the total flood prone area in the country. Flood situation is most severe in northern plains of Bihar. This is because almost all the major rivers in the State enter Bihar from Nepal in this region. Bed slope of these rivers is very sharp in the Nepal and they usually enter the State on plain lands. Because of a sudden drop in bed slope, silt brought by the flow of these rivers get deposited at their base to cause recurring floods.
18
International Journal of Research in Social Scienceshttp://www.ijmra.us, Email: [email protected] Table 2.7 : 10th Plan Performance on the Outlays for Flood Control (Rs in crore)
Sl.No Source of Funding 10th Plan Outlay
Flood Control Agreed Outlay Actual Outlay
Anticipated Performance 1 Establishment
114.08 152.52 145.79
(CSS+State Plan) 2 State Plan (Ongoing
1576.00 332.92 329.81
& New Schemes)
3 NABARD 55.00 21.00 16.97
Sub Total (works) 1631.0 353.92 346.78
Total Flood
1745.08 506.44 492.57
Control
Beside the menace of flood, about 9.41 lakh hectare of land suffer from the problem of water logging in Bihar. It has been found by various Expert Committees that it would not be economically viable to free 2.5 lakh hectares of land from water logging due to excessive depth. Thus, against 6.91 lakh hectares of water logged area from where water can be drained out, only about 1.50 lakh hectare have been freed from water logging. The task ahead is to free the remaining 5.41 lakh hectares of land area. Against a total agreed outlay of around Rs167 crore, on drainage works in the 10th Plan, there has been an actual utilisation of around 74 percent (Table 2.8).
Table 2.8 : 10th plan performance and 11th plan requirement Rs in Crore
Sl. Source of Funding 10th Plan Outlay No.
Drainage Agreed Outlay
Actual
Utilisation
1 State Plan (Ongoing & New Schemes) 120.94 7.79
2 NABARD 166.77 122.79
Total Drainage 166.77 122.79
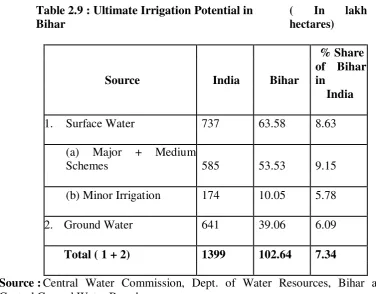
2.5 Irrigation:
19
International Journal of Research in Social Scienceshttp://www.ijmra.us, Email: [email protected] Table 2.9 : Ultimate Irrigation Potential in
Bihar
( In lakh hectares)
Source India Bihar
% Share
of Bihar in
India
1. Surface Water 737 63.58 8.63
(a) Major + Medium
Schemes 585 53.53 9.15
(b) Minor Irrigation 174 10.05 5.78
2. Ground Water 641 39.06 6.09
Total ( 1 + 2) 1399 102.64 7.34
Source : Central Water Commission, Dept. of Water Resources, Bihar and Central Ground Water Board.
Bihar has 45.67 lakh hectares of irrigated area against its total geographical area of 93.6 lakh hectares. While created irrigation capacity of 45.67 lakh hectare means that around 49 per cent ofctotal area is irrigated, distribution of irrigation capacity is not even across the State. The percentage of irrigated area varies greatly across different regions/districts, from a low of 16 percent (in Jamui) to around 86 percent (in Sheikhpura). In fact, both irrigation capacity and its source vary greatly across the 3 agro-climatic Zones of the state.
While Zone 1 accounts for nearly 37 per cent of total geographical area of the State, its share in total created irrigation capacity of the State is about 31 per cent ( Table 2.10). On the other hand, Zone 3B which also accounts for 31 per cent of geographical area has about 41 per cent of total irrigated land in the State. Zone 3A having 13 per cent of geographical area of the State has only around 8 per cent of total irrigated area of the. Finally, while around 64 per cent of Zone 3B area is irrigated, Zone 3A has only around 32 per cent of its area irrigated. This variation in irrigation capacity across the regions also extends to the sources of irrigation. Nearly 63 per cent of total created irrigation capacity in the State has tubewells as its source (Table 2.11). Canal irrigation accounts for nearly 30 per cent of total irrigated area. Thus major and medium sources of irrigation together account for 93 per cent of total created irrigation capacity in the State, with other sources ( minor and micro irrigation) accounting for only about 7 percent of total irrigation. A very high dependence of irrigation on tubewells, and operation of diesel tubewell due to lack of power infrastructure in the rural areas means a high cost and inefficient irrigation.
20
International Journal of Research in Social Scienceshttp://www.ijmra.us, Email: [email protected] Zone 1‘s irrigated area). On the other hand, canals have a greater role to play in Zones 3A and 3B and there is a greater balance between tubewell and canal irrigation in these regions. Incidentally, the latter two zones are also the zones with lowest rainfall among all the regions of the state. Thus, while importance of canal irrigation is much greater in southern parts of Bihar (Zone 3), there is an almost exclusive reliance on tubewell irrigation in the northern parts, especially in Zone 2. This is rather peculiar as most of the rivers in Bihar flow through its northern plains, which therefore should have had a better canal irrigation capacity.
Minor and micro irrigation have only a limited coverage in the overall irrigation scenario of the State, accounting for only 7.53 per cent of the irrigated area. Here too, there is a great deal of variation in its use across the State. While only 2 per cent of irrigated area of Zone 2 has minor irrigation as its source, its contribution to irrigated area in Zone 3 is around 17 per cent.
Ground water resources have remained largely unutilized in the State. To tap the huge potential of ground water irrigation, Million Shallow Tubewell Programme has been prepared which would imply additional irrigation capacity of 20 lakh hectares. About 6.97 lakh diesel tubewells and pumpsets are to be distributed by March 2017 under this programme. Farmers are given a grant of 30 per cent and a loan of 50 per cent of total costs under this Programme and no discrimination is made between different categories of beneficiary farmers. Against the distribution target of 5.37 lakh pumpsets by March 2016, 3.80 lakh pumpsets were distributed by November, 2015.
21
International Journal of Research in Social Scienceshttp://www.ijmra.us, Email: [email protected] Table 2.10 : Zonal Land Usage, and Percentage ofIrrigated Land
Land Area
Net Sown Total Crop Multi
total irrigated % irrigated
Districts Area Area Cropped Area
(in hectares)
( in hect.) ( in hect.) ( in hect.)
area area
Zone 1
Saran 265,000 192938 233024 40086 117706 44.42
Siwan 224,000 162889 238635 75746 107262 47.88
Gopalganj 204,000 150524 232775 82251 107689 52.79
Muzafarpur 315,000 207145 339364 132219 130164 41.32
E Champaran 432,000 288804 323302 34498 155655 36.03
W Champaran 484,000 279758 366712 86954 176683 36.50
Sitamarhi 222,000 121048 188399 67351 71682 32.29
Sheohar 44,000 26483 43567 17084 12652 28.75
Vaishali 201,000 126660 190331 63671 77546 38.58
Darbhanga 254,000 172716 209949 37233 102087 40.19
Madhubani 354,000 225113 317083 91970 138551 39.14
Samastipur 262,000 184718 252196 67478 112387 42.90
Begusarai 188,000 117193 174313 57120 91089 48.45
total 3,449,000 2255989 3109650 853661 1401153 40.62
% of total
36.85
land area
%of land area 65.41 90.16 24.75
Zone 2
22
International Journal of Research in Social Scienceshttp://www.ijmra.us, Email: [email protected]
supaul 239,000 155251 268820 113569 142114 59.46
madhepura 180,000 131531 205481 73950 133124 73.96
Purnia 314,000 221166 307003 85837 170504 54.30
Kishanganj 189,000 131105 195648 64543 50535 26.74
Araria 271,000 180983 282645 101662 110962 40.95
Katihar 291,000 167217 278835 111618 129408 44.47
Khagaria 149,000 84684 133902 49218 83393 55.97
1,798,000 1,181,570 1,866,356 684,786 915023 50.89
19 65.71579533 103.8017798
Zone 3A
Munger 140,000 48029 69030 21001 37015 26.44
Sheikhpura 62,000 44217 62737 18520 53423 86.17
Lakhisarai 129,000 68044 78098 10054 41934 32.51
Jamui 305,000 81117 88723 7606 50780 16.65
Bhagalpur 254,000 145667 177576 31909 78364 30.85
Banka 306,000 153818 161325 7507 115698 37.81
1,196,000 540,892 637,489 96,597 377214 31.54
% of total
13
land area
% of land 45.23 53.30 8.08
area
Zone 3B
Patna 317,000 206294 253848 47554 179595 56.65
Nalanda 232,000 180872 228353 47481 193288 83.31
23
International Journal of Research in Social Scienceshttp://www.ijmra.us, Email: [email protected]
Buxar 167,000 138277 144944 6667 113910 68.21
Rohtas 391,000 254360 363159 108799 330834 84.61
Kaimur 342,000 154226 204719 50493 166537 48.70
Gaya 494,000 200333 277364 77031 235090 47.59
Jehanabad 94,000 63650 80024 16374 67206 71.50
Arwal 63,000 41784 58263 16479 48131 76.40
Nawada 249,000 110565 149046 38481 126558 50.83
Aurangabad 330,000 197912 281626 83714 224201 67.94
2,916,000 1,733,637 2,268,882 535,245 1873444 64.25
% of total 31
land area
% of land 59.45 77.81 18.36
area
Bihar 9,360,000 5712088 7882377 2170209 4566,834 48.79
24
International Journal of Research in Social Scienceshttp://www.ijmra.us, Email: [email protected] Table 2.11 : Zonal Classification of Total Irrigated Area through Different Sources
Unit in hectares
Name of
Canal Tube well Other sources
Total irrigated
District Area
Zone 1
Saran 2414 115231 61 117706
Siwan 6314 93353 7595 107262
Gopalganj 50672 54027 2990 107689
Muzaffarpur - 130164 - 130164
E. Champaran 794 154450 411 155655
W. Champaran 128686 42971 5026 176683
Sitamarhi 1491 63661 6530 71682
Sheohar - 12652 - 12652
Vaishali - 65655 11891 77546
Darbhanga - 95736 6351 102087
Madhubani - 41113 97438 138551
Samastipur - 112387 - 112387
Begusarai - 89416 1673 91089
Zone 1 total 1,90,371 10,70,816
1,39,966
14,01,153
(13.59% of (76.42% of (30.68% of
(9.99% of total
total irrigated total irrigated total irrigated
irrigated area)
area) area) area)
25
International Journal of Research in Social Scienceshttp://www.ijmra.us, Email: [email protected]
Saharsa 5527 84562 4894 94983
Supaul 67352 73678 1084 142114
Madhepura 32795 92954 7375 133124
Purnea 11729 158775 - 170504
Kishanganj - 50535 - 50535
Araria - 110962 - 110962
Katihar - 129408 - 129408
Khagaria - 76748 6645 83393
Zone 2 total 117,403 777,622
19,998
9,15,023
(12.84% of (84.98% of (20.04% of
(2.18% of total
total irrigated total irrigated total irrigated
irrigated area)
area) area) area)
Zone 3A
Jamui 1040 30439 5536 37015
Sheikhpura 23951 525 28947 53423
Munger 13314 24550 4070 41934
Lakhisarai 2185 41107 7488 50780
Bhagalpur 4297 57797 16270 78364
Banka 90062 23893 1743 115698
Zone 3A total 1,34,849 1,78,311 64,054
3,77,214 (
( 35.75% of ( 47.27% of ( 16.98% of
8.26% of total
total zonal total zonal total zonal
irrigated area)
irrigated area) irrigated area) irrigated area)
Zone 3B
26
International Journal of Research in Social Scienceshttp://www.ijmra.us, Email: [email protected]
Nalanda 9442 164270 19576 193288
Bhojpur 40781 135775 11538 188094
Buxar 44421 66410 3079 113910
Rohtas 262570 36037 32227 330834
Kaimur 98493 54414 13630 166537
Gaya 232303 - 2787 235090
Jehanabad 596 57839 8771 67206
Arwal 28712 18034 1385 48131
Nawada 13944 108831 3783 126558
Aurangabad 142664 65794 15743 224201
9,25,041 8,28,453 1,19,950 18,73,444
Zone 3B total
( 49.38% of ( 44.22% of ( 6.4% of total (41.02% of
total zonal total zonal zonal irrigated total irrigated
irrigated area) irrigated area) area) area)
1367664
2855202
343968
( 62.52% of
TOTAL ( 29.95 of total (7.53% of total 4566834
total irrigated
irrigated area) irrigated area)
area)
27
International Journal of Research in Social Scienceshttp://www.ijmra.us, Email: [email protected] Table 2.12 : The total outlay required including establishment as per source of funding is as follows :
(Rs in crore)
Sl. Source of 10 th plan outlay Proposed outlay for 11th plan
No. funding
Major & Medium Agreed Outlay Actual Outlay Anticipated
Irrigation Performance
1 Establishment 468.00 508.35 482.58 625.00
(CSS + State Plan)
2 State Plan 1106.00 124.57 121.89 2006.90
( Ongoing & New Schemes)
3 RSVY 0.00 165.00 17.14 1500.00
4 AIBP 1257.63 995.00 980.85 2962.91
5 NABARD 441.56 188.0 144.87 1500.00
Sub Total 2805.19 1472.58 1264.75 7969.81
(Works)
Total Irrigation 3273.19 1980.93 1747.33 8594.81
2.6 Agricultural Inputs
Seeds
Agriculture in Bihar has been bedeviled by a trend of falling productivity over the last few years. Major crops, particularly rice and wheat which together account for 77.26 percent of total copped area have seen a substantive fall in their productivity in recent years.
28
International Journal of Research in Social Scienceshttp://www.ijmra.us, Email: [email protected] percent in Andhra Pradesh, the rate for wheat is 41 percent in Maharastra, for gram it is 30 percent in Orissa and for rapeseed and mustard it is 100 percent in Gujarat. However, the seed replacement ratios for oilseeds and maize in the State meet the desired norms, standing at 30 percent for rapeseeds and mustard, and 40 percent for rabi maize which is reflected in their yield being above the national average.
Table 2.13 : Seed Replacement Rates of Different Crops Sl. Name of
2013-14 2014-15 2015-16 2016-17
No the crops
Target achievement Target achievement Target achievement Target achievement
Kharif crops
1 Paddy 8% 6.8% 10% 10% 11% 12% 15%
2 Maize 40% 30% 50% 40% 50% 50% 60%
3 Pulses 10% 6% 10% 7.5% 10% 8% 14%
4 Oilseeds 5% 2% 5% 3% 5% 5%
Rabi Crops
1 Wheat 10% 8.1% 10% 9% 15% 11% 15%
2 Maize - - - - 50% - 80%
3 pulses 5% 1.2% 10% 7.5% 15% - 10%
4 Oilseeds 25% 20% 30% 25% 30% - 30%
5 Vegetables 25% 20% 60% 50% 60% - 60%
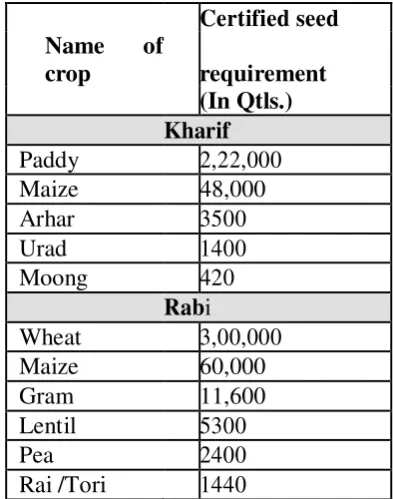
Table 2.14 : Certified Seed Requirement of Different Crops in Bihar ( 2016-17)
Certified seed Name of
crop requirement
(In Qtls.) Kharif
Paddy 2,22,000
Maize 48,000
Arhar 3500
Urad 1400
Moong 420
Rabi
Wheat 3,00,000
Maize 60,000
Gram 11,600
Lentil 5300
Pea 2400
Rai /Tori 1440
29
International Journal of Research in Social Scienceshttp://www.ijmra.us, Email: [email protected] production of wheat seeds is being carried out. This would facilitate timely and economical availability of modern crop breeds to the farmers.
Credit:
From an already low level, agriculture‘s share in total bank credit has fallen over the last 5 years. While its share was at 24 percent in 2010-11, it fell to 20 percent in 2013-14. Though it has registered an increase to 23 percent in 2014-15, it is still lower than the share in 2010-11. The entire rural credit delivery system is not in a good shape in Bihar. In terms of access of cultivators to the banking institutions, average population per bank branch in Bihar, as on end of June 2016, was 25,000, as against the national average of 16,000 (RBI 2006). While the number of commercial bank branches in the State is 2082, only 60.37 percent of these branches operate in rural areas. There are 5 Regional Rural Banks in the State, with 1486 branches, of which around 86 percent are located in the rural areas. The credit-deposit ratio ( CDR ) of RRBs at 44.77 percent is much higher than those of commercial banks.
Taking the entire banking sector, a total of 4015 branches of 72 banks cater to the 82.9 million strong population of the State ( Table 2.15). Even this sparse banking infrastructure is disproportionately oriented towards the urban economy of the State, with only 72 per cent of total branches catering to the rural areas which is home to nearly 90 percent of population . Total allocation of credit to agriculture in Bihar has been increasing over the last few years, but has remained way behind the target credit mark.
Table 2.15 : Institutional Arrangements (Branch Position) Agency No. of No. of Rural Semi urban Urban
Banks Branches Branches
CBS 30 2082 1257(60.3%) 443 386
RRR‘s 16 1486 1287(86.60%) 165 34
SCB 1 14 - - 14
DCCB‘s 22 280 240(85.71%) 13 27
LDB 1 151 80(52.98%) 16 55
UCB 2 2 - - 2
30
International Journal of Research in Social Scienceshttp://www.ijmra.us, Email: [email protected] Table 2.16 : Target and Achievement of Agricultural Credit by Different Banks.
(Rs. in crore) Year
Commercial Bank
Regional Rural bank Cooperative Bank Total Target Target Achievemen
t % of % of total Target
Achievemen
t % of % of total Target Achievement % of % of total total
achievemen
t total
achievemen
t total
achievemen t target in Credit target in credit target in credit credit allocation credit
allocation allocation
for for the year for
credit
for the year for the year
the the
for
year year the
year 2012-
1050.33 604.73 57.20 70.30 391.62 153.84 21.33 17.88 394.14 101.6 21.47 11.81 1836.09 13
2013-
1220.15 792.44 64.21 50.85 376.98 204.87 19.84 13.15 303.21 561.11 15.96 36.01 1900.34 2014
2014-
1386.29 1325.06 59.25 65.27 550.86 431.3 23.54 21.25 402.71 273.75 17.21 13.48 2339.86 2015
2015-
1645.57 1489.33 61.00 68.51 644.26 450.09 23.88 20.70 407.65 234.61 15.11 10.79 2697.48 2016
Commercial banks account for the largest share of the total credit disbursed to agriculture in the State, though this share has fallen moderately in recent years, from 70.30 percent in 2012-13 to 68.51 percent in 2015-16 ( Table 2.16). Total outstanding credit as on March 2005 of all scheduled commercial banks to agriculture stood at Rs. 2973.52 crore, out of which direct credit was Rs.2634.49 crore and indirect credit was Rs.339.03 crore. The share of regional rural banks in total agricultural credit has fluctuated around 20 per cent, although it registered a sharp fall in 2013-14 to 13 percent. Similarly, the share of cooperative banks in total agricultural credit is found to be about 12 percent, although it was suddenly high at 36 percent in 2013-14.
The agricultural credit need was estimated to be Rs. 11341.22 crore for Bihar in 2016-17. An amount of Rs. 10042 crore for crop loans, Rs. 78.22 crore for the Macromode / ISOPAM plan, Rs. 60 crore for micro-irrigation, Rs. 18.50 crore for agri-clinics and Rs. 1142 crore for horticulture mission etc. would be needed as loan from the banking sector. However, the credit target or agriculture set by banks for 2016-17 was only Rs 3732 crore which was much lower than the requirement.
31
International Journal of Research in Social Scienceshttp://www.ijmra.us, Email: [email protected] area of micro-finance, more than 17,000 Self-Help Groups had been financed by banks upto 2015 through their priority lending schemes in 38 districts. The target for 2016-17 is to raise the number to 24,000 SHGs and advance Rs. 48 crore through the scheme.
Insurance:
Agricultural production in Bihar has shown great fluctuation over the years. At one hand, this fluctuation can be devastating for a small-marginal farmer who operates on limits of subsistence, and, on the other hand, it is a disincentive for enterprising farmers who have the potential for investment. In this perspective, crops in the State are being insured since kharif 2000 to provide economic help to the insured farmers whose crops are damaged by natural disaster. Kharif crops such as paddy, maize, jute and chillies, and among rabi crops, wheat, gram, arhar, masoor, maize, rapeseed and mustard, potato, sugarcane and onion are covered under National Agricultural Insurance Plan. While participation of indebted farmers is compulsory in the plan, that of non-indebted farmers is voluntary.
Under this plan, grants are given in the premium to be paid by the small and marginal farmers, with equal shares of State and Central government. The number of beneficiary farmers for 2004-05 was 411532, 293442 in kharif and 118090 in rabi season .There has been a drop in coverage of farmers under crop insurance in 2015-16 as compared to 2014-15. Crop insurance policy was taken by 409,946 farmers in 2015-16, out of which 221985 took cover for kharif season and 187961 took cover for rabi season. The spread of insurance cover, however, is grossly inadequate keeping in mind that there are around 104 lakh landholdings in the State , nearly 93 percent of which are small and marginal holdings which are specially required to be protected through the agriculture insurance plan. Its coverage would have to be significantly expanded over the years in order to stabilize income from agriculture and create conducive environment for productive investment in agriculture.
Extension Services:
32
International Journal of Research in Social Scienceshttp://www.ijmra.us, Email: [email protected] that a mere 0.5 percent of farmers access information on modern technology from extension workers.
Steps to reform the above situation have been in the recent years and, in particular, in the current year. The State government has universalized Agricultural Technology Management Agencies (ATMAs) to cover all districts of the State. The ATMAs are designed to decentralize decision-making through ‗bottom-up‘ planning procedures that would directly involve farmers and the private sector in planning and implementing extension programmes at the block and district levels. Similarly, a decision has been taken in 2016 to universalize Krishi Vigyan Kendras to all districts of the State. In addition, 31 new seed testing laboratories have been sanctioned in the current financial year to give each district its own seed testing laboratory.
The State has a very distorted pattern of nutrient consumption regarding NPK ratio, which not only leads to a waste of resources but also mars the soil quality of the fields. A major reason for this imbalanced use of fertilizers is lack of knowledge among the farmers about the soil quality of their fields. In the current year, 16 soil-testing laboratories have been sanctioned, adding to the earlier strength of 23, thereby allowing for a complete coverage of all the districts. In fact, a mega-project with an outlay of Rs 309 crore has been sanctioned in this year to establish soil testing laboratories in all the 534 blocks of the state over next 4 years.
Management of seed supply is an important component of any programme of agricultural development. In the current year, Bihar State Seed Corporation has been revived and production of seeds is being undertaken by it on 45 state managed farm which remained inoperative for some years. More than 1100 agriculture graduates have been trained as agriclinics in the State. The utilization of technical expertise of these trained youths is necessary for agricultural development. A decision was taken in the current year to use the seeds produced by agriclinic for public sector programmes. In the current year, the Kisan Samman Yojna was also launched to identify and acknowledge enterprising farmers in the State and using them as extension agents. This plan is unique and innovative programme of extension reforms.
2.8 Forestry, Orchard and Vegetables :
33
International Journal of Research in Social Scienceshttp://www.ijmra.us, Email: [email protected] Table 2.17 :Fruits in Bihar : Area (in hectares), productivity (qutls/hect),
production (in tones), and estimated coverage for 2015-16 (in hect) Sl. Name of the Area (in Production ( in Productivity Estimated
coverage for No
.
Fruits hectares) tones) (in Qntls / hect) 2005-06 (in
hectares)
Mango 140106 865619 6.18 149500
2 Guava 27660 256057 9.26 27800
3 Litchi 28383 204897 7.22 28500
4 Lemon 16808 122875 7.31 17000
5 Banana 27988 920044 32.87 28300
6 Pineapple 4214 122534 29.08 4300
7 Coconut 15150 150778 9.95 15180
7 Others 30930 277450 8.97 31300
Total 291239 2920254 10.03 292880
Source : Agriculture Dept., GOB
Table 2.18 : Area under vegetables - Area ( in hectares), production ( in tones), productivity (qutls/hect), and estimated coverage for 2015-16 (in hect)
Sl. Name of the Area (in hect) Production Productivity Estimated area No.
Vegetable ( in tones) (quintals/hect) for 2015-16
1 Cauliflower 59701 955216 16.0 60000
2 Cabbage 36513 598813 16.4 36700
3 Onion 48759 975180 20.0 49000
4 Tomato 42987 601818 14.0 43100
5 Chilly 38070 456840 12.0 38300
6 Brinjal 53651 1073020 20.0 53800
7 Ladyfinger 56173 674076 12.0 56300
8 Kaddu 25143 402288 16.0 25300
34
International Journal of Research in Social Scienceshttp://www.ijmra.us, Email: [email protected]
10 Jhiguni 8078 48468 6.0 8300
11 Karela 8424 50544 6.0 8600
12 Parwal 4594 45940 10.0 4700
13 Wodi 11582 69492 6.0 11700
14 Others 99685 835590 14.0 59800
Total 486966 7257769 14.9 489400
Source : Agriculture Dept., GOB
2.11 Agricultural Mechanization:
Current level of mechanization of agriculture in the State is very low. While there are only 17 tractors per hectare in the State, the figure for Punjab is 68 tractors per hectare. At present, Bihar has 111672 tractors, 4000 power tillers, 2.5 lakh stonery engines, 66128 mould bold ploughs, 50000 cultivators, 15000 seed drills, 290000 sprayers, and 300000 threshers. While recommended electricity consumption for farming is 2 KW/hect, it is only 0.8 KW/ hect in Bihar due to limited availability of electricity. The Government is accordingly promoting agricultural mechanization on a large scale through provision of grants for small tractors, power tillers, threshers and GISE tillage machines.
2.12 Land and Agricultural Reforms:
The available data for landholdings demonstrate the extent of inequality in the agrarian structure. For example, more than 80 percent of operational holdings in Bihar are marginal (below one hectare), and they account for only 36 percent of total operational land area. At the other end, medium and large operational holdings of more than four hectares comprise less than 2.5 percent of all holdings, but constitute over 20 percent of operational land area. In Bihar, incidence of landlessness has increased in the decade of nineties from 9 percent to 10 percent of the rural households and the proportion of households in the marginal segment has also increased significantly in the same time period(Table 2.19).
Apart from widening of disparity in land distribution, it can also be observed that while incidence of poverty has declined for all landowning classes during the nineties it has actually increased for the landless from 51 percent to 56 percent, strongly suggesting that land ownership is clearly associated with poverty. At the end of the nineties, therefore, the share of land poor households in the total poor population has increased – from 12 to 14 percent for landless households and from 55 to 61 percent for marginal landholding households.
35
International Journal of Research in Social Scienceshttp://www.ijmra.us, Email: [email protected] turmoil in the backdrop of land related disputes and recommend remedial measures accordingly. The Commission is to look into feasibility and impact of co-operative farming, giving due importance to the rights and concerns of the small and marginal farmers.
Table 2.19 : Rural Poverty Incidence and Shares by Land Ownership
50th round 55th round
Land owned %of rural Poverty % Share % of rural Poverty % share of Incidence
(ha) Population of the poor population incidence the poor
%
No land 9 51 12 10 56 14
0<*<=o.4ha 43 51 55 53 46 61
0.4<*<=1ha 24 34 20 20 29 15
1<*<=2ha 15 28 10 10 30 7
2<*<=4ha 7 18 3 4 16 2
>4ha 3 6 0 2 18 1
Overall 100 40 100 100 40 100
Conclusion
36
International Journal of Research in Social Scienceshttp://www.ijmra.us, Email: [email protected] to rice crop because diesel operated tube well is the main source of irrigation which is costly, particularly for marginal farmers who purchase water at the rate of Rs 70-90 per hour.
References
1. Kumar Vimal, Ramdhari Singh Dinkar Rachna — Sanchayan, Sahitya Akademi, New Delhi, 2008, ISBN 978-81-260-2627-2.
2. Mishra Shree Govind, History Of Bihar 1740–1772, Munshiram Manoharlal, 1970
3. Verma B S, Socio-religious Economic And Literary Condition Of Bihar (From ca. 319 A.D. to 1000 A.D.), Munshiram Manoharlal, 1962
4. Maitra A,Magahi Culture, Cosmo Publications, New Delhi, 1983 5. Naipaul V S, India: A Wounded Civilization, Picador, 1977
6. Trevithick Alan, The Revival Of Buddhist Pilgrimage At Bodh Gaya (1811–1949): Anagarika Dharmapala And The Mahabodhi Temple
7. Jannuzi F. Tomasson, Agrarian Crisis In India: The Case Of Bihar, University of Texas Press, 1974, ISBN 0-292-76414-6, ISBN 978-0-292-76414-9
8. Omalley L S S, History of Magadh, Veena Publication, 2005, ISBN 81-89224-01-8
9. Shukla Prabhat Kumar, Indigo And The Raj: Peasant Protests In Bihar 1780–1917, Pragati Publications, 1993, ISBN 81-7307-004-0
10. Ahmad Qeyamuddin, Patna Through The Ages: Glimpses of History, Society & Economy, Commonwealth Publishers, 1988
11. Jain B D, Ardha Magadhi Reader, Sri Satguru Publications, Lahore, 1923
12. Patra C, Life in Ancient India: As Depicted In The Digha Nikaya, Punthi Pustak, 1996, ISBN 81-85094-93-4
13. Hazra Kanai Lal, Buddhism In India As Described By The Chinese Pilgrims AD 399–689, Munshiram Manoharlal, 1983, ISBN 81-215-0132-6
14. McCrindle John W., Ancient India As Described By Megasthenes And Arrian, Munshiram Manoharlal
15. McCrindle John W., Ancient India As Described By Ptolemy, Munshiram Manoharlal, 1927, ISBN 81-215-0945-9
16. Sastry Harprasad, Magadhan Literature, Sri Satguru Publications, Calcutta, 1923 17. Rai Alok, Hindi Nationalism, Orient Longman, 2000, ISBN 81-250-1979-0
18. Waddell Austine L., Report On The Excavations At Pataliputra (Patna) – The Palibothra Of The Greeks, Asian Publicational Services, Calcutta, 1903
19. Das Arvind N., The State of Bihar: an economic history without footnotes, Amsterdam: VU University Press, 1992
20. Brass Paul R., The politics of India since Independence, Cambridge University Press, 1990 21. Askari S. H., Mediaeval Bihar: Sultante and Mughal Period, Khuda Bakhsh Oriental Public
Library, Patna, 1990
22. Tayler William, Three Months at Patna during the Insurrection of 1857, Khuda Bakhsh Oriental Public Library, Patna, 2007
23. Taylor P.J.O., "What really happened during the Mutiny: A day by day account of the major events of 1857–1859 in India", Oxford University Press, 1997, ISBN 0-19-564182-5
24. Pathak Prabhu Nath, Society and Culture in Early Bihar (C.A.D. 200 – 600), Commonwealth Publishers, 1988
25. Basham A. L., The Wonder that was India, Picador, 1954, ISBN 0-330-43909-X
26. Nambisan Vijay, Bihar in the eye of the beholder, Penguin Books, 2000, ISBN 978-0-14-029449-1
27. Pathak Mohan, Flood plains and Agricultural occupance, Deep & Deep Publication, 1991, ISBN 81-7100-289-7
37
International Journal of Research in Social Scienceshttp://www.ijmra.us, Email: [email protected] 29. Radhakanta Barik –Land & Caste Politics in Bihar (Shipra Publications, Delhi, 2006)
POSSESSIVE LOVE IN WUTHERING HEIGHTS
Mrs. Preksha Vikesh Patel
Assistant Professor at Sardar Patel College of Administration And Management, Vallabh Vidhyanager
Abstract
The intent of the present paper is to discuss the possessive love of Heathcliff towards Catherine. Wuthering Heights is a supernatural love story of Heathcliff and Catherine by Jane Eyre. The novel is divided into eighteen chapters. Healthcliff is an orphaned adopted child of Mr. Earnshaw. Anyhow, Heathcliff wants Catherine, but unfortunately he cannot achieve her. In order to take revenge, he compels his son Linton Heathcliff to marry young Catherine, a daughter of Catherine to complete his love cycle.
Key Words
Possessive Love, Passionate, Revenge, Fortune, Villain
Possessive Love in Wuthering Heights
[1] Introduction
Wuthering Heights is a supernatural love story of Heathcliff and Catherine by Jane Eyre. The novel is divided into eighteen chapters. Healthcliff is an orphaned adopted child of Mr. Earnshaw. It tells the stories of two families: the Earnshaws who live at the Heights, at the edge of the moors, and the genteel and refined Lintons who live at Thrushcross Grange. Heathcliff from his childhood loves Catherine and she also loves him but with the curse of the time, she has to marry Edgar Linton. After the death of Mr. Earnshaw, Hindley ill-treats Healthcliff and sends him to work in the farm and behaves him with like an animal. Healthcliiff runs away from the tyranny and returns with his good fortune after three years. On his returns, he learns about Catherine‘s marriage and wants to take revenge with Hindley and Edgar. In order to take revenge, he ruins the lives of Hindley and Edgar. His love is so passionate that even after the death of Catherine; she talks to the ghost of Catherine.
[2] Possessive Love of Heathcliff
38
International Journal of Research in Social Scienceshttp://www.ijmra.us, Email: [email protected] Somehow, he manages to escape from the clutches of Hindley and returns after three years with his good fortune. On his return, he comes to know that his life like beloved is married to Edgar Linton and his enemy Hindley. Heathcliff cannot bear this reality and wants to take revenge anyhow. His love for Catherine is gigantic and untamed and matters to him more than anything else, but it is never easy it leads him to control and belittle and manipulate nearly everyone around him. Despite his many horrible deeds, Heathcliff is not a straight-out bad guy; he is a poor orphan who finds material success but not what he really wants the love of Catherine.
There is no character in Wuthering Heights who is either completely loveable or completely odious. Rather, as Phyllis Bentely has observed;
Emily shows to her characters exactly that clear-eyed compassion which she shows when she declines to judge the hare and the deer for timidity, or mock the wolf for his wolfishness (1).
Catherine knows that Edgar, though a coward, was kind, that Heathcliff, though cruel, was bitterly oppressed. As Oates states that;
Bronte is perfectly accurate in having her villain tell us, by way of Mrs. Dean and Lockwood, that brutality does not always disgust; and that there are those persons- often of weak, cringing, undeveloped characters-who innately admire it, provided they themselves are not injured (435-449).
Heathcliff finds him ready prey for his onslaught. When he visits Cathy at Thrushcross Grange his long denied happiness returns in a limited measure, now that Cathy has confirmed her love. He gets vicarious pleasure from the humiliation of Linton. Compounded by strange unconscious psychic impulses he plays out a double game of spiting Cathy and Linton at the same time. Having floored Cathy he entices Edgar‘s sister Isabella to elope with him to Wuthering Heights. That being done, he treats her cruelly and boorishly to make up his sum for all that he had suffered from the Linton family, and also Cathy. The enigma of it all is in the fact that he tried to inflict pain on Cathy for whose sake he went through the worst of both worlds. He tells the dying Catherine quite ruthlessly indeed, with all the rancour of one who believes in social propriety and who feels wilfulness must be punished;
Why did you betray your own heart, Cathy? I have not one word of comfort. You deserve this. You have killed yourself. Yes, you may kiss me and cry; and wring out my kisses and tears: they‘ll blight you - they‘ll damn you....Because...nothing that God or Satan could inflict would have parted us, you, of your own will, did it. I have not broken your heart - you have broken it; and in breaking it, you have broken mine. (Bronte 188)