Abstract
Purpose: Green Supply Chain Management is gaining significance swiftly in all business organizations across the world. Several businesses are greening their supply chain in different ways. Although some of them are not very clear about the expected performance factors, still they have realized the overall benefits of its implementation. This paper includes the framework of Green Supply Chain Management Performance factors based upon the primary study conducted on Chemical Industries including all three categories basic chemicals, specialty chemicals and knowledge chemicals.
Design/methodology/approach: The research approach includes literature review and cross sectional survey of 331 Chemical Industries in Gujarat, India. An exploratory factor analysis is conducted to derive groupings of green supply chain management performances from the primary survey data.
Findings: The study reveals the five major performance factors that are expected namely environmental performance, financial performance, operational performance, competitive performance and reduction in penalties. Reliability analysis is also assessed for these five factors.
Research limitations/implications: The research is concentrated only to large and medium Chemical Industries and factory units in Gujarat state. The geographic scope of the study can be extended to the other states of India or Chemical Industries in Pan India.
Practical implications: The paper offers important implications for managers, pointing out to the fact, that a dedicated commitment towards Green Supply Chain Management Implementation in chemical industries may results in five important organization performance criteria. Originality/value: This Study is based on literature available on various quantitative and qualitative studies. Also the findings are based upon the depth primary analysis of various inherent factors of various segments of chemical industries in Gujarat.
Keywords: Green Supply Chain Management, Financial Performance, Environmental Performance, Operational Performance, Competitive Advantage, Chemical Industry
Framework for GSCM Performance in Chemical Industries
– Rinki Rola
Introduction
2. Theoretical Background
2.1 Green Supply Chain Management
Green Supply Chain can be defined as a transformation process to convert environmental friendly inputs into recyclable or reusable outputs and by- products. Green Supply Chain Management practices are involving eco-friendly practices at every step of a supply chain combining green purchasing, green manufacturing / materials management, green distribution / marketing and reverse logistics (Sarkis, 2006). It is also known as Environmental Supply Chain Management or Sustainable Supply Chain Management (Kleindorfer, Singhal and Wassenhove, 2009 ; Linton et al., 2007). The scope of Green Supply Chain Management practices is very extensive and includes environmental management together with investment recovery and or design for environmental practices (Chien and Shih, 2007; Liu et al., 2012; Liu et al., 2011). The overall objective of green supply chain management is to reduce costs while protecting the environment from all hazards.
Green Supply Chain Management is an important innovation which helps the organisations to develop "win-win" strategies helpful in achieving profit and market share by lowering their environmental risk and impacts, while raising their ecological efficiency (Meera and Chitramani, 2014). Many organizations argue that being environmentally friendly increases your costs. Cost implications have been identified as one of the top level barrier on implementation of green supply chain management in India (Luthra et al., 2011). There are several barriers to implementing green and lean supply chain strategies, including a lack of environmental awareness, the common belief that environmental practices do not pay and the perception that green initiatives are time consuming and expensive (Mollenkopf et al., 2010; Wu and Pagell, 2011).
2.2 Green Supply Chain Management Performance
provide competitive advantages (low cost and differentiation), which will subsequently improve ?nancial performance (Molina?Azorín et al., 2009). Green Supply Chain Management practices tend to have win-win relationships in terms of environmental and economic performance (Zhu and Sarkis, 2004; Li, 2011). Greening of supply chain has been identified as an important approach for improving the environmental performance of processes and products (Kumar and Chandrakar, 2012). Companies that have adopted Green Supply Chain Management practices with a focus on distribution activities have successfully improved their business and environmental performance on many levels (Nimawat and Namdev, 2012). Chinese firms have implemented a variety of Green Supply Chain Management practices to improve their environmental performance and directly helped in enhancing export sales (Zhu, Sarkis and Geng, 2005). The study on manufacturers in Taiwan's electrical and electronic industry has adopted green procurement and green manufacturing practices have generated favorable environmental and financial performances for the respective companies (Chien and Shih, 2007). The survey shows that the Indian manufacturing industries carry out to some degree of Green Supply Chain Management practices adoption leads to relatively significant level of Green Supply Chain Management Performance. Both environmental and positive economics are in relatively significant (Zhu et al., 2011; Bhateja, 2012). In?uence of Green Supply Chain Management on Performance factors such as Environmental and positive economic are relatively significant in Indian Pharmaceutical Industries also (Gangele and Verma, 2011). The study on Evaluation and Measurement of Performance of Green Supply Chain Management in Chhattisgarh Manufacturing shows that the environmental performance increase, which indicates the implementation of the green supply chain significantly, enhances the level of the industrial environmental performance (Kumar and Chandrakar, 2012). Green Supply Chain Management pressures that influence. Green supply chain practices can improve environmental performance and hence enable organisations to be responsible citizens (Meera and Chitramani, 2014).
3. Methodology
3.1 Instrument Development
The data used in this study consist of questionnaire responses from the Managers of Environment, Health and Safety (EHS) departments and other equivalent departments at various Chemical Industries in Gujarat. The study combines issues related to the environment (green issues) with others supply chain functions. Therefore, the appropriate person from which the required data could be obtained should ideally have knowledge about both aspects. The questionnaire contains the section including 22 variables for Green Supply Chain Management performances based upon the number of sources from the literature and initial information inputs from the industry experts. Questions were asked using a five-point Likert type scale of level of agreement (e.g. 1 = Strongly Disagree to 5 = Strongly Agree).
3.2 Data Collection and Sample Characteristics
3.2.1.Pilot test. A pilot test was conducted to test and refine the questionnaire. A total of 28 valid responses were collected in the pilot test. Based on the suggestions from respondents, minor modifications were made to the questionnaire.
3.2.2. Sampling. There exists a large but finite population of small medium and large chemical industries in Gujarat. But only finite population of Large and Medium size Chemical Industries in Gujarat are considered to be surveyed. Sample size calculation performed with consideration of Finite Population correction factor with N = 2052, n = 384, p = 0.5, q = 0.5, Confidence level = 95%, a = + or - 5% gives n = 324 as sample size.
3.2.3. Random Surveys.To avoid the biases associated with the convenience sampling, we also conducted some random surveys through regular postal mail and email followed by the telephone calls. The target Chemical Industries are from the list of Chemical Industries available. Out of total 1000 Questionnaires mailed, a total of 331 usable chemical industries responses were received (a 33.1 percent response rate). Responses from the two groups early from the convenience sampling and the late from the more of random survey were compared using t - tests. The test results indicated that in all items no statistical differences existed between the mean scores of the early and late respondents at the 5 percent level of confidence. Thus we had used full data set of 331 responses. Table I shows the descriptive statistics for distribution of respondent Chemical Industries in terms of Size, ISO Certifications and organization types. Table II shows the descriptive statistics (mean and standard deviation) for the Green Supply Chain Management Performance variables.
Table I.Descriptive Statistics
Particulars Total Percentage (%)
Ownership Category (Total) 331 100
State Owned 53 16.01
Private 272 82.17
Proprietor 6 1.81
ISO 14001 331 100
Certified 215 64.95
Not Certified 116 35.04
EMS 331 100
Having EMS 204 61.63
Not having EMS 127 38.37
Size 331 100
Medium-Size 178 53.77
Large-Size 153 46.22
Segment of Industry 331 100
Basic Chemicals 178 53.77
Speciality Chemicals 73 22.05
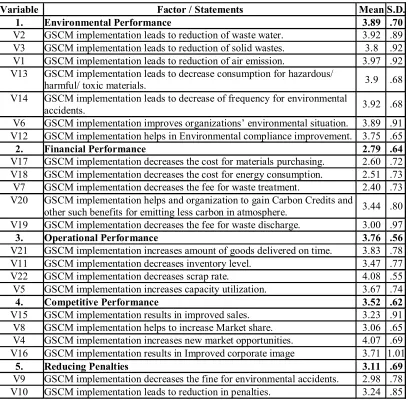
Table II. GSCM Performance Factors - Descriptive Statistics
Variable Factor / Statements Mean S.D.
1. Environmental Performance 3.89 .70
V2 GSCM implementation leads to reduction of waste water. 3.92 .89 V3 GSCM implementation leads to reduction of solid wastes. 3.8 .92 V1 GSCM implementation leads to reduction of air emission. 3.97 .92 V13 GSCM implementation leads to decrease consumption for hazardous/
harmful/ toxic materials. 3.9 .68
V14 GSCM implementation leads to decrease of frequency for environmental
accidents. 3.92 .68
V6 GSCM implementation improves organizations’ environmental situation. 3.89 .91 V12 GSCM implementation helps in Environmental compliance improvement. 3.75 .65
2. Financial Performance 2.79 .64
V17 GSCM implementation decreases the cost for materials purchasing. 2.60 .72 V18 GSCM implementation decreases the cost for energy consumption. 2.51 .73 V7 GSCM implementation decreases the fee for waste treatment. 2.40 .73 V20 GSCM implementation helps and organization to gain Carbon Credits and
other such benefits for emitting less carbon in atmosphere. 3.44 .80 V19 GSCM implementation decreases the fee for waste discharge. 3.00 .97
3. Operational Performance 3.76 .56
V21 GSCM implementation increases amount of goods delivered on time. 3.83 .78 V11 GSCM implementation decreases inventory level. 3.47 .77 V22 GSCM implementation decreases scrap rate. 4.08 .55 V5 GSCM implementation increases capacity utilization. 3.67 .74
4. Competitive Performance 3.52 .62
V15 GSCM implementation results in improved sales. 3.23 .91 V8 GSCM implementation helps to increase Market share. 3.06 .65 V4 GSCM implementation increases new market opportunities. 4.07 .69 V16 GSCM implementation results in Improved corporate image 3.71 1.01
5. Reducing Penalties 3.11 .69
V9 GSCM implementation decreases the fine for environmental accidents. 2.98 .78 V10 GSCM implementation leads to reduction in penalties. 3.24 .85
4. Data Analysis and Results
KMO and Bartlett's Test for Green Supply Chain Management Performance variables shows that the result of the Bartlett's Test of Sphericity is 0.000, which meets the criteria of value lower than 0.05 in orderfor the FactorAnalysis to be considered appropriate (See Table III). Furthermore, the result of the KMO Measure of SamplingAdequacy is 0.722, which exceeds the minimumvalue of 0.6 for good factoranalysis.
Table III. KMO and Bartlett's Test
Kaiser-Meyer-Olkin Measure of Sampling Adequacy.
.722
Bartlett's Test of
Sphericity
Approx. Chi-Square
9509.033
Df
231
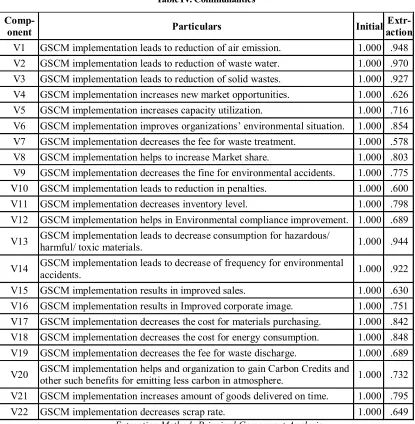
Table IV. Communalities
Comp-onent Particulars Initial
Extr- action V1 GSCM implementation leads to reduction of air emission. 1.000 .948 V2 GSCM implementation leads to reduction of waste water. 1.000 .970 V3 GSCM implementation leads to reduction of solid wastes. 1.000 .927 V4 GSCM implementation increases new market opportunities. 1.000 .626 V5 GSCM implementation increases capacity utilization. 1.000 .716 V6 GSCM implementation improves organizations’ environmental situation. 1.000 .854 V7 GSCM implementation decreases the fee for waste treatment. 1.000 .578 V8 GSCM implementation helps to increase Market share. 1.000 .803 V9 GSCM implementation decreases the fine for environmental accidents. 1.000 .775 V10 GSCM implementation leads to reduction in penalties. 1.000 .600 V11 GSCM implementation decreases inventory level. 1.000 .798 V12 GSCM implementation helps in Environmental compliance improvement. 1.000 .689
V13 GSCM implementation leads to decrease consumption for hazardous/
harmful/ toxic materials. 1.000 .944
V14 GSCM implementation leads to decrease of frequency for environmental
accidents. 1.000 .922
V15 GSCM implementation results in improved sales. 1.000 .630 V16 GSCM implementation results in Improved corporate image. 1.000 .751 V17 GSCM implementation decreases the cost for materials purchasing. 1.000 .842 V18 GSCM implementation decreases the cost for energy consumption. 1.000 .848 V19 GSCM implementation decreases the fee for waste discharge. 1.000 .689
V20 GSCM implementation helps and organization to gain Carbon Credits and
other such benefits for emitting less carbon in atmosphere. 1.000 .732 V21 GSCM implementation increases amount of goods delivered on time. 1.000 .795 V22 GSCM implementation decreases scrap rate. 1.000 .649
Extraction Method: Principal Component Analysis.
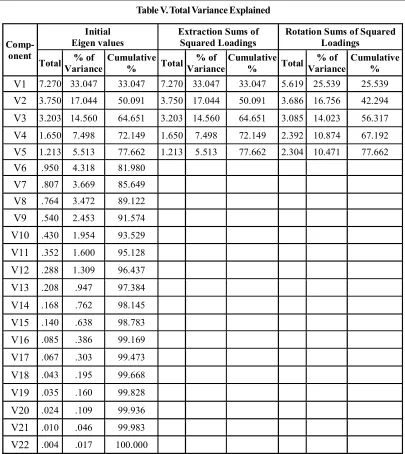
Table V. Total Variance Explained
Comp- onent
Initial Eigen values
Extraction Sums of Squared Loadings
Rotation Sums of Squared Loadings
Total % of Variance
Cumulative % Total
% of Variance
Cumulative % Total
% of Variance
Cumulative %
V1 7.270 33.047 33.047 7.270 33.047 33.047 5.619 25.539 25.539
V2 3.750 17.044 50.091 3.750 17.044 50.091 3.686 16.756 42.294
V3 3.203 14.560 64.651 3.203 14.560 64.651 3.085 14.023 56.317
V4 1.650 7.498 72.149 1.650 7.498 72.149 2.392 10.874 67.192
V5 1.213 5.513 77.662 1.213 5.513 77.662 2.304 10.471 77.662 V6 .950 4.318 81.980
V7 .807 3.669 85.649
V8 .764 3.472 89.122
V9 .540 2.453 91.574
V10 .430 1.954 93.529
V11 .352 1.600 95.128
V12 .288 1.309 96.437
V13 .208 .947 97.384
V14 .168 .762 98.145
V15 .140 .638 98.783
V16 .085 .386 99.169
V17 .067 .303 99.473
V18 .043 .195 99.668
V19 .035 .160 99.828
V20 .024 .109 99.936
V21 .010 .046 99.983
V22 .004 .017 100.000
Extraction Method: Principal Component Analysis.
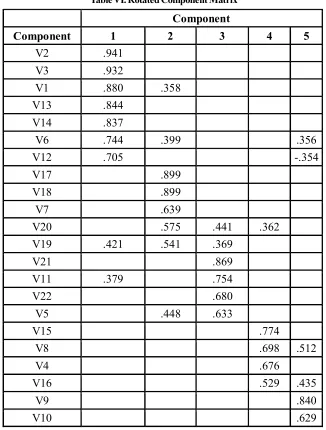
Operational Performance, Competitive Performance and Reduction in Penalties. Further analysis also confirms the reliability of these five factors with the levels of Cronbach's alpha equal to 0.940, 0.861, 0.815, 0.756 and (Only Two Variables). All Cronbach's alpha values are well above the limit of 0.6 to ensure the constructs' internal consistency and validity.
Table VI. Rotated Component Matrix
Component
Component
1
2
3
4
5
V2
.941
V3
.932
V1
.880
.358
V13
.844
V14
.837
V6
.744
.399
.356
V12
.705
-.354
V17
.899
V18
.899
V7
.639
V20
.575
.441
.362
V19
.421
.541
.369
V21
.869
V11
.379
.754
V22
.680
V5
.448
.633
V15
.774
V8
.698
.512
V4
.676
V16
.529
.435
V9
.840
V10
.629
Extraction Method: Principal Component Analysis. Rotation Method: Varimax with Kaiser Normalization.
Table VII. Factors of GSCM Performance and Reliability statistics
Factor
No.
Factor Name
Variables
Reliability
Statistics
Factor 1
Environmental
Performance
V2, V3, V1, V13, V14, V6, V12
0.940
Factor 2
Financial
Performance
V17, V18, V7, V20, V19
0.861
Factor 3
Operational
Performance
V21, V11, V22, V5
0.815
Factor 4
Competitive
Performance
V15, V8, V4, V16
0.756
Factor 5
Reducing
Penalties
V9, V10
(Only Two
Variables)
Over all
Scale
GSCM Performance
Scale
All 22 Variables
0.896
5. Discussions
5.1. Environmental Performance
Environmental Performance is defined as the environmental impact that the Industries activities has on the natural milieu (Sharma and Vredenburg, 1998). Environmental performance is a multidimensional construct with factors including environmental impact on the biosphere, customers, employees, the local community, and other stakeholders (Christmann, 2000; Lober, 1996; Ilinitch, Soderstrom and E. Thomas, 1998; Sharma, 2000; Sharma and Vredenburg, 1998). Environmental Performances includes the variables reduction in air emission, decrease in solid waste and water waste, better environmental situation of the chemical industry, decrease in number of environmental accidents etc. Environmental performance is now a value important to many competitive and successful companies around the world (Jacobs and Kleiner, 1995; Sarkis, Meade and Presley, 2006). Politicians (Gore, 1992), chief executive officers of major chemical companies (Reilly, 1990), and prominent scholars (Ahmed, Montagno and Firenze, 1998; Bragdon and Marlin, 1972; Cairncross, 1993; Dowell, Hart and Yeung, 2000; Farrow, Johnson and Larson, 2000; Halvorsen and Smith, 1991; Stead, McKinney and Stead, 1998; Zhu and Sarkis, 2007) argued that improved environmental practices do not necessarily detract from a firm's financial performance.
5.2. Financial Performance
Chain Management can cut the cost of material purchasing and energy consumption, reduce the cost of waste treatment and discharge, and avoid a fine in case of an environmental accident (Zhu and Sarkis, 2004). Here the financial performance which can be achieved by the chemical industries is nothing but the internal cost savings because of sustainable approach. Financial Performance here includes the variables as cost reduction and financial incentives like carbon credit gain by the companies. This construct has been found to be multi-dimensional (Venkatraman, 1987) and therefore is commonly operationalized in empirical studies using more than one measure. Financial performance refers to the financial impacts of the application of firm environmental strategies. Indeed, these costs are significant. This construct is often operationalized in environmental studies by measuring manager's perceptions of how the strategy has impacted the firm's bottom line (Sharma and Vredenburg, 1998). Rao and Holt (2005) research concludes that greening the supply chain also has the same potential to lead to competitiveness and economic performance. The financial performance of firms is affected by environmental performance in a variety of ways. When waste, both hazardous and non-hazardous, is minimized as part of environmental management, it results in better utilization of natural resources, improved efficiency and higher productivity and reduces operating costs. Again, when the environmental performance of the firm improves, it ushers in tremendous marketing advantage, and this leads to improved revenue, increased market share, and new market opportunities.
5.3. Operational Performance
In industry the most important dimension is amount of goods delivered on time followed by optimization of capacity utilization, decreases inventory level and decreases scrap rate which will improve the operational performance of the Industries. Green Supply Chain Management practices implementation leads to improvement in energy efficiency and conservation of resources logistics efficiency were evident in most of the companies. Other benefits achieved by companies after implementing the Green Supply Chain Management practices are increased efficiency, reduced cost, improved risk management, improved service, increased sales and market share, revenue growth and reputation. It is important that the company's supply chain is socially responsible and ethical. One of the dimensions in operational performance that needs to be incorporated to the framework is improved risk management. Sustainable Supply Chain Management practices have considerable effect on the operational performance of organizations.
5.4. Competitive Performance
goals and strategies of the organization (Pane Haden, Oyler and Humphreys, 2009). Frameworks for attaining competitive advantage through the managerial principles of customer satisfaction, employee empowerment, quality cost systems, lean manufacturing, environmental management or green supply chain management towards the overall competitiveness of the firm. Over the last few years there has been an upsurge in environmental awareness of consumers in general. Clearly a growing number of corporations are developing company-wide environmental programs and "green" products sourced from markets around the world (Min and Galle, 1997).Slowly the environmental friendly strategies are becoming a source of competitiveness.
5.5. Reduction in Penalties
Organizations that minimize the negative environmental impacts of their products and processes, recycle post-consumer waste and establish environmental management systems, are poised to expand their markets or displace competitors that fail to promote strong environmental performance (Klassen and Mclaughlin, 1996). Since many believe that green supply chain management does lead to improved environmental performance, it implies that greening different phases of the supply chain should directly, or indirectly, translate into enhancement of economic or financial performance. At the same time it is not necessarily true that greening all the phases of the supply chain should directly lead to financial performance. For instance, greening the inbound phase certainly should lead to reduction of pollution at the source and minimization of wastes. However, whether these initiatives have a direct impact on financial performance is yet to be explored. Similarly, greening of the outbound phase, involving green logistics, would intuitively be expected to lead to competitiveness, but again, whether it would render improved financial performance needs to investigated.
6. Conclusion and Implications
6.1. Practical Implications:
6.2. Limitations and Directions for Future Research
Future research can be done to identify the various mediating and moderating interrelationships that may exist between the explored factors or variables identified. Also a longitudinal research can be done to find the impact of actual Green Supply Chain Management implementation on Organizational performances. The research is concentrated only to large and medium chemical Industries and factory units in Gujarat state. The geographic scope of the study is only focused on Gujarat state Chemical industries which can be extended to the study on Chemical Industries in other states of India or Chemical Industries in Pan India. A more broadly based random sample study across India would also provide a better picture of these Green Supply Chain Management practices and what is going on throughout India in field of green supply chain management.The investigation and its findings are still relatively exploratory. It is expected that the as time progresses the relationships between the increasing pressures and nascent Green Supply Chain Management practices will become clearer in arriving the results we must mention the presently the research is concentrated only to large and medium chemical industries and factory units in Gujarat state.
References
1. Ahmed, N., Montagno, R. and Firenze, R. (1998). Organizational performance and environmental consciousness: an empirical study. Management Decision, 36(2), pp.57-62.
2. Bhool, R. and Narwal, M. S. (2013). An analysis of drivers affecting the implementation of green supply chain management for the Indian manufacturing industries. International Journal of Research in Engineering and Technology, 2(11).pp. 2319-1163.
3. Bragdon, J.H. Jr and Marlin J.A.T. (1972). Is pollution profitable?. Risk Management, April, pp. 9-18. 4. Chien, M. K. and Shih, L. H. (2007). An empirical study of the implementation of green supply chain
management practices in the electrical and electronic industry and their relation to organizational performances. Int. J. Environ. Sci. Tech., 4(3), pp.383-394.
5. Christopher, M., Mena, C., Khan, O. and Yurt, O. (2011). Approaches to managing global sourcing risk. Supply Chain Management: An International Journal, 16(2), pp.67-81.
6. Farrow, P., Johnson, R. and Larson, A. (2000). Entrepreneurship, Innovation, and Sustainability Strategies at Walden Paddlers, Inc. Interfaces, 30(3), pp.215-225.
7. Gore, A. (1992). Earth in he Balance, Houghton Mifflin Company, New York, NY.
8. Halvorsen, R. and Smith, T. (1991). A Test of the Theory of Exhaustible Resources. The Quarterly Journal of Economics, 106(1), pp.123-140.
9. Hung Lau, K. and Wang, Y. (2009). Reverse logistics in the electronic industry of China: a case study. Supply Chain Management: An International Journal, 14(6), pp.447-465.
10. Ilinitch, A., Soderstrom, N. and E. Thomas, T. (1998). Measuring corporate environmental performance. Journal of Accounting and Public Policy, 17(4-5), pp.383-408.
12. Klassen, R. and McLaughlin, C. (1996). The Impact of Environmental Management on Firm Performance. Management Science, 42(8), pp.1199-1214.
13. Kleindorfer, P., Singhal, K. and Wassenhove, L. (2009). Sustainable Operations Management. Production and Operations Management, 14(4), pp.482-492.
14. Lee, S. (2008). Drivers for the participation of small and medium?sized suppliers in green supply chain initiatives. Supply Chain Management: An International Journal, 13(3), pp.185-198.
15. Li, Y. (2011). Research on the Performance Measurement of Green Supply Chain
16. Lober, D.J. (1996). Evaluating the environmental performance of corporations. Journal of Managerial Issues, 8(2), pp. 184-205.
17. Min, H. and Galle, W. (1997). Green Purchasing Strategies: Trends and Implications. International Journal of Purchasing and Materials Management, 33(2), pp.10-17.
18. Nimawat, D. and Namdev, V. (2012). An overview of green supply chain management in India. Research Journal of Recent Sciences, 1(6), pp.77-82.
19. Pane Haden, S., Oyler, J. and Humphreys, J. (2009). Historical, practical, and theoretical perspectives on green management. Management Decision, 47(7), pp.1041-1055.
20. Rao, P. (2005). The greening of suppliers-in the South East Asian context. Journal of Cleaner Production, 13(9), pp.935-945.
21. Rao, P. and Holt, D. (2005). Do green supply chains lead to competitiveness and economic performance?.IntJrnl of Op & Prod Mnagemnt, 25(9), pp.898-916.
22. Sarkis, J. (2012). A boundaries and flows perspective of green supply chain management. Supply Chain Management: An International Journal, 17(2), pp.202-216.
23. Srivastava, S. (2007). Green supply-chain management: A state-of-the-art literature review. International Journal of Management Reviews, 9(1), pp.53-80.
24. Venkatraman, N. (1987). Measurement of Business Economic Performance: An Examination of Method Convergence. Journal of Management, 13(1), pp.109-122.
25. Walker, H. and Brammer, S. (2009). Sustainable procurement in the United Kingdom public sector. Supply Chain Management: An International Journal, 14(2), pp.128-137.