e-ISSN: 2278-7461, p-ISSN: 2319-6491
Volume 6, Issue 6 [June. 2017] PP: 15-21
Effect of
Trust
and
Perceived Risk
on
Intention To Use
as a Media Promotion
Eduard da Costa
1, RinabiTanamal
2Department of Information Multimedia Technology, Faculty of Creative Industry, University of Ciputra, UC Town Citraland, Surabaya - Indonesia, 60219
Abstract:
The development of technology is now developing very rapidly, the use of technology is
already used in various fields , as well as in the field of marketing, who use technology as a media to
promote and market the product .The increasing number of internet users , is expected to affect
people's behavior to make a purchase , from purchasing conventional to E - Commerce. To make a
transaction or customer participation is need the trust of each customer.Instagram is one of the social
media is changing as technology develops that into online marketing media and usefull for E -
Commerce. In this research , the Technology Acceptance Model theory with using the extended
variable that trust and perceived risk in order to find the influence of trust in the purchase or intention
to purchase on E - Commerce in instagram .This research used a population that respondents who ever
make purchases on E - Commerce through social media instagram . The data collection technique
used was a survey using a questionnaire. Prior to the data analysis , the authors to test the validity and
reliability by using SPSS software . The results obtained by researchers of this study is the perception
ease of use application for users in using the Instagram app as media E-commerce is a significant
effect on a person's desire to use Instagram as a E-Commerce.
Keywords: Technology Acceptance Model (TAM), Trust, Perceived Risk, E-Commerce, Instagram
I.
INTRODUCTION
Media communication is very important in the life of the community. The process of sending information in this golden age is very sophisticated. Telecommunication technology is the most sought after to deliver or transmit information or news because telecommunications technology is growing, faster, precise, accurate, easy, cheap, effective and efficient. There are several functions of high-tech communication media that is efficient information dissemination will become more efficient. With the existence of high-tech communication media, we can make information or message more powerful memorable to the audience. High-tech communication media is certainly more fun (for the familiar) and can provide entertainment for the audience and will have more supervisory functions on social policy. Instagram becomes one of the social media applications with many users and continues to increase in each year and become one of the applications that users most often open. Instagram became one of the social media samples received by the public and used as a media campaign or online marketing that makes popping up various online stores that sell goods or services. With the features that exist in the instagram make the e-commerce and consumers become easier on the process of promotion and their transactions. The hashtag feature makes searching for items desired by users easier and faster.
II.
MATERIAL AND METHODS
The test used in this research is outlier test, normality test, validity test, and reliability test. Outlier test and normality test are fused in the assumption test. The test is processed using SPSS version 20. Respondent's data were obtained from 202 Instagram users in Indonesia.
Assumptions Test
Validity Test
Validity shows the extent to which a measuring instrument is able to measure what it wants to measure (Syofian, 2010). Meanwhile, according to (Kuncoro, 2009), validity is a measurement scale called valid when doing what should be done and measuring what should be measured. The instrument can be declared valid if its significance value <0.05.
Reliability Test
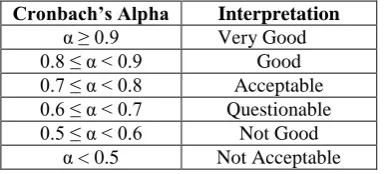
Reliability is used to determine the extent to which the measurement results remain consistent, if two or more measurements are taken against the same symptoms using the same measuring instrument (Syofian, 2010). A variable can be said reliably if the value of cronbach alpha> 0.70 (George & Mallery, 2003).
Table 1. Interpretation of Cronbach Alpha Numbers
Correlation Analysis
Correlation is done to measure the strength of the relationship between two variables with certain scales. Correlation is declared unidirectional if correlation coefficient value found positive; Otherwise if the value of negative correlation coefficient, correlation is not called unidirectional.
Path Analysis
Path analysis is an extension of the regression model used to test the correlation matrix matches against two or more causal models of relationships that are being compared by the researchers (Garson, 2008). After testing the validity, reliability test and assumption test using SPSS application, it will be done Path Diagram Test by using AMOS application.
Goodness-of-Fit, used to measure the compatibility of observational inputs with predictions of the proposed model (Ghozali, 2011). Goodness-of-fit from the statistical model illustrates how suitable the model with a set of observations. The goodness-of-fit index summarizes the difference between the observed values and expected values under the statistical model. Goodness-of-fit statistics are goodness-of-fit indexes with known sampling distributions, usually obtained using asymptotic methods, used in statistical hypothesis testing. As large sample estimates may work poorly in small samples, many studies use simulated studies that have been devoted to research with p-value conditions of accurate goodness-of-fit. Aspects that must be met are like the table below.
Table2. Interpretation of Fit Statistics Model Model Fit Statistik Interpretasi Model Chi-Square (CMIN) Small numbers with p > 0.05 Normed Chi-square (CMIN/DF) < 3
RMR (Root Mean Square Residual) Near Zero GFI (Goodness of Fit Index) > 0.90
AGFI (Adjusted GFI) > 0.90 NFI (Normed Fit Index) > 0.90 IFI (Incremental Fit Index) > 0.90 CFI (Comparative Fit Index) > 0.90 RMSEA (Root Mean Square Error of
Approximation)
< 0.05
III.
RESULT AND DISCUSSION
After conducting a series of tests, the results obtained that valid data used from a total of 202 respondents that amounted to 179 users Instagram in Indonesia. Survey done by using google form.
Cronbach’s Alpha Interpretation α ≥ 0.9 Very Good 0.8 ≤ α < 0.9 Good 0.7 ≤ α < 0.8 Acceptable 0.6 ≤ α < 0.7 Questionable 0.5 ≤ α < 0.6 Not Good
Assumptions Test
Normality test (Skewness and Kurtosis)
For Trust (T) variables listed as in the table below (Table 3) in accordance with the expected standards, ie the level of significance of skewness is at the value of -3 to +3 and the level of significance of kurtosis is in the values of -7 to +7.
Table 3. Skewness and Kurtosis Trust (T) Variable Std. Deviation Skewness Kurtosis
T1 0,891 -0,068 -0,215
T2 0,938 -0,148 -0,548
T3 0,871 -0,070 -0,410
T4 0,812 -0,069 -0,406
For Perceived Risk (PR) variables listed as in the table below (Table 4) in accordance with the expected standards, ie the level of significance of skewness is at the value of -3 to +3 and the level of significance of kurtosis is at the value of -7 to +7.
Table 4. Skewness and Kurtosis Perceived Risk (PR) Variable Std. Deviation Skewness Kurtosis
PR1 0,865 -0,228 -0,966
PR2 0,915 -0,127 -0,768
PR3 0,895 0,110 -0,284
For Perceived Usefulness (PU) variables listed as in the table below (Table 5) in accordance with the expected standards, ie the level of skewness significance is at the value of -3 to +3 and the level of significance of kurtosis is at the value of -7 to +7.
Table 5. Skewness and Kurtosis Perceived Usefulness (PU) Variable Std. Deviation Skewness Kurtosis
PU1 0,825 -0,108 -0,087
PU2 0,867 -0,434 0,286
PU3 0,825 -0,067 -0,343
PU4 0,924 -0,147 -0,362
PU5 0,914 -0,582 0,778
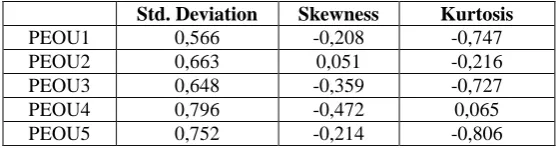
For Perceived Ease of Use (PEOU) variables are listed as in the table below (Table 6) according to expected standards, ie the level of skewness significance is in the values of -3 to +3 and the level of significance of kurtosis is in the values of -7 to +7.
Table 6. Skewness and Kurtosis Perceived Ease of Use (PEOU) Variable
As for Intention to Use (ITU) variables listed as in the table below in accordance with the expected standards, namely the level of skewness significance is at the value of -3 to +3 and the level of significance of kurtosis is at the value of -7 to +7.
Table 7. Skewness and Kurtosis Intention to Use (ITU) Variable Std. Deviation Skewness Kurtosis
PEOU1 0,566 -0,208 -0,747
PEOU2 0,663 0,051 -0,216
PEOU3 0,648 -0,359 -0,727
PEOU4 0,796 -0,472 0,065
PEOU5 0,752 -0,214 -0,806
Std. Deviation Skewness Kurtosis
ITU1 0.733 -0.935 1.482
ITU2 0.801 -0.955 1.411
Outlier Test
For z-scores of each of the TPR, PU, PEOU, and ITU variables tested have met the specified standards.
Validity Test
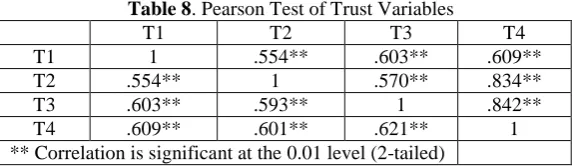
The test was developed by calculating the total of mean scores of Pearson test. Below will be listed tables of correlation test results (Table 8).
Table 8. Pearson Test of Trust Variables
T1 T2 T3 T4
T1 1 .554** .603** .609**
T2 .554** 1 .570** .834**
T3 .603** .593** 1 .842**
T4 .609** .601** .621** 1
** Correlation is significant at the 0.01 level (2-tailed)
It can be seen that all sub-variables are significant and correlate to each other.
Table 9. Pearson test of Perceived Risk Variable
PR1 PR2 PR3
PR1 1 .701** .250**
PR2 .701** 1 .212**
PR3 .250** .212** 1
** Correlation is significant at the 0.01 level (2-tailed)
It can be seen that all sub-variables are significant and correlate to each other.
Table 10. Pearson test of Perceived Usefulness Variables
PU1 PU2 PU3 PU4 PU5
PU1 1 .627** .594** .509** .555** PU2 .627** 1 .714** .714** .612** PU3 .594** .789** 1 .709** .665** PU4 .509** .749** .805** 1 .648** PU5 .555** .724** .805** .850** 1
** Correlation is significant at the 0.01 level (2-tailed).
It can be seen that all sub-variables are significant and correlate to each other.
Table 11. Pearson test of Perceived Ease of Use Variables PEOU
1
PEOU 2
PEOU 3
PEOU 4
PEOU 5 PEOU1 1 .760** .598** .464** .384** PEOU2 .598** 1 .625** .542** .667** PEOU3 .604** .625** 1 .535** .515** PEOU4 .464** .542** .535** 1 .687** PEOU5 .384** .667** .515** .687** 1
** Correlation is significant at the 0.01 level (2-tailed)
It can be seen that all sub-variables are significant and correlate to each other.
Table 12. Pearson test of the Intention to Use Variable
ITU1 ITU2 ITU3
ITU1 1 .653** .382**
ITU2 .653** 1 .480**
ITU3 .382** .595** 1
** Correlation is significant at the 0.01 level (2-tailed).
Table 13. Pearson Test among all variables
T PR PU PEOU ITU
T 0,159 1
PR -0,069 -0,066 1
PU 0,114 0337** -0,714* 1
PEOU 0,088 0,336** 0,115 0,313** 1 ITU 0,152 0,579** -0,140 0,607** 0,575** ** Correlation is significant at the 0.01 level (2-tailed)
The test result between all variables shows that all hypothesized variables have correlation with each other.
Reliability Test
ReliabilityTest is done by looking at the value of Cronbach Alpha. If the value above 0.7 then it can be considered reliable or acceptable for research. After tested obtained Cronbach Alpha value for this data as table below.
Table 14. Test Reliability for all variables Variables Value of Cronbach Alpha
Trust 0.852
Perceived Risk 0.662
Perceived Usefulness 0.923
Perceived Ease of Use 0.891
Intention to Use 0.742
The results obtained are all variables have reliable data for use in the study because the value obtained is above 0.7.
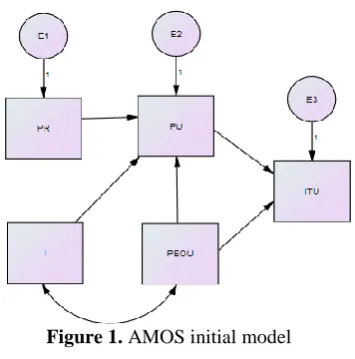
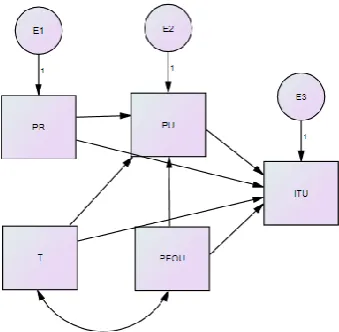
Test of Fit Model Using SOSS Amos Software Figure 1 is an initial model created in AMOS.
Figure 1. AMOS initial model
Figure 2 is a modified model in AMOS.
In Figure 2 above, after the relationship T to PR removed the results obtained fit model test as in the table below below.
Table 15. Results Table of Initial Fit Test
Goodness of Fit Index Value Obtained Result Chi-Square (CMIN) 46,896 and P = 0 Not Good
Normed Chi-Square (CMIN/DF) 15,632 Not Good
RMR (Root Mean Square
Residual) 0,033 Not Good
GFI (Goodness of Fit Index) 0,912 Good
AGFI (Adjusted GFI) 0,561 Not Good
NFI(Normed Fit Index) 0,807 Not Good
IFI (Incremental Fit Index) 0,817 Not Good
CFI (Comparative Fit Index) 0,811 Good
RMSEA (Root Mean Square
Error of Approximation) 0,287 Not Good
In table 15 above, the value of CMIN is still large that is 46,896 and P value is still below 0,05 ie 0.000. The value of CMIN / DF shows the value of 15.632, so it still does not meet the required conditions under 3. Then the value of RMR, GFI, and AGFI obtained as shown in table 16 below. The RMR value obtained is 0.027, the GFI value is 0.946, and the AGFI value is 0.796. The value of RMR and GFI can be said to be good however, the value of AGFI is still below 0.90 so the model is still not good.
Figure 3. Model After Adding Relations
In Figure 3 below shows the modified model by adding 2 relations ie the relation from PR to ITU and T to ITU. However the relation from PR to ITU is omitted because the value of P obtained shows a number of 0.058. Therefore, the relations does not show significant correlation. Figure 3 is also the last modification.
Table 16 Fit Test Results After Final Modification
Goodness of Fit Index Value Obtained Result Chi-Square (CMIN) 4,584 and P = 0,101 Good
Normed Chi-Square (CMIN/DF) 2,292 Good
RMR (Root Mean Square
Residual) 0,014 Good
GFI (Goodness of Fit Index) 0,990 Good
AGFI (Adjusted GFI) 0,925 Good
NFI(Normed Fit Index) 0,981 Good
IFI (Incremental Fit Index) 0,989 Good
CFI (Comparative Fit Index) 0,989 Good
RMSEA (Root Mean Square
Based on the fit test results in Table 16 that the model has been eligible and the model is feasible for use.
IV.
CONCLUSION
AllExogenous Variables of Trust, Perceived Risk, Perceived Usefulness and Perceived Ease of Use have an influence on Intention to Use. There are modifications to the model, due to a recommendation to add two relations ie: Trust has a significant positive influence on Intention to Use, and Perceived Risk has a significant negative impact on Intention to Use. Exogenous variables that have greatest influence on the intent of use are Perceived Ease Of Use variable. Thus if the higher level of perception of ease of someone in using Instagram then the intention of the person in using Instagram will be higher.
REFERENCES
[1] Garson, D. G. (2008). Factor Analysis: Statnotes. Retrieved June 6, 2017 , from North Carolina State University Public Administration Program, http://www2.chass.ncsu.edu/garson/pa765/factor.htm. [2] George, D., and Mallery, P. (2003). SPSS for Windows step by step: A simple guide and reference 11.0
update (4thed.). Boston: Allyn & Bacon.
[3] Ghozali, I. (2011). Structural Equation Model: Concepts & Applications With AMOS 19.0 Program. Semarang: Diponegoro University
[4] Hair J.F., Black, W.C., Babin, B.J., and Anderson, R.E. (1995), Multivariate Data Analysis With Reading, Fourth Edition,Prentice Hall. New Jersey
[5] Kline, R.B. (2011). Principles and Practice of Structural Equation Modeling (3rd ed.). New York : The Guilford Press.
[6] Kuncoro, M. (2009). Research Methods ForBusiness and Economics. Jakarta:Erland [7] Syofian, S (2010). Descriptive statistics for research. Jakarta: RajagrafindoPersada.