S
U
ME
D
H
A
J
O
U
R
N
A
L
O
F
M
A
N
A
G
EMEN
T
A
p
ri
l-J
u
n
e
2
0
1
9
CMR College of Engineering & Technology
About Sumedha Journal of Management
Submission of Articles
is Sponsored by MGR Educational Society, which has established in 2002. The College is situated on Hyderabad - Nagpur National Highway (Medchal Road), Andhra green and free of pollution. The college endeavors to impart Quality Technical Education and to meet the challenge imposed on, by being in tune with the fast changing Technology & Globalization. Since 2006, Department of Master in Business Administration at CMR has been building individuals with the capability to think act and lead in an increasingly complex business world. CMR Strongly believes in the change that individuals can bring about in the world and in themselves, when empowered with the knowledge to analyze the world the confidence to act on their decisions and perseverance to lead others in pursuit of change. It provides a platform to building a strong society and nation.
aims at promoting and disseminating relevant, high quality research in the field of management. It is a double blind reviewed referred academic quarterly journal focuses on publishing scholarly articles from the areas of management, management principles, recent inventions in management, company management, financial management, human resources, accounting, marketing, operations management, human resource management, statistics, international business, information technology, environment, risk management, globalization and related areas. Asian journal of management research seeks original manuscripts that identify, extend, unify, test or apply scientific and multi-disciplinary knowledge concerned to the management field. The journal endeavors to provide forum for academicians, scholars and practitioners.
The following types of Papers are considered for publication: 1. Original research works in the above-mentioned fields.
2. Surveys, opinions, abstracts and essays related to Operations research.
3. Few review papers will be published if the author had done considerable work in that area. 4. Case studies related to management domain.
Authors are invited to submit their research articles, review papers, case studies in a properly formatted file as per the author guidelines to [email protected] mentioning the name of the journal or through the submission.
V o lu m e 8 N u m b e r 2
Vol. 8 No. 2 April-June 2019
Referred Journal of CMR College of Engineering & Technology
ISSN (Online) : 2322-0449UGC Approval Journal (Serial No: 46802)
A Model Proposition for Prescreening Candidates in Recruitment Process Using Fuzzy Vikor Method
Murat Bolelli
An UGC Autonomous Institution
(Approved by AICTE, permanently affiliated to JNTU, Hyderabad)
(NAAC Accredited Institution with ‘A’ Grade)
ISSN (PRINT) : 2277-6753
Department of Master of Business Administration
An Integrated Marketing Communications, Media Synergies and its effect on the Consumer Decision Making Process Reshma Nikhat
Influence of Organizational Climate on Employee Turnover Intention in Information Technology Industry in Kerala Jnaneswar. K
Gayathri Ranjit
Impact of Transformational Leadership Style Dimensions on Organizational Performance: An Empirical Analysis Shruti Balhara
Harbhajan Bansal
Impact of Quality of Work Life on Organisational Commitment Indu Bala, Ramandeep Saini, B.B. Goyal
Mediating Role of Personal Accomplishment among Emotional Labour Strategies and Teaching Satisfaction among Professional College Teachers Jitha G. Nair
Testing of Long-Run Relationship between Gold Prices and Stock Market Return: An Empirical Analysis in India Tanvi Bhalala
Emerging Distribution Channel Effectiveness in Rural Jharkhand for Consumer Electronics
Punit Kumar Mishra Girish Kumar Srivastava
Changing Role of Learning and Development Methodologies Digital Age - A Comparison between Manufacturing and Service Industry S. Rajeswari, D.Raghunatha Reddy
M.Ramakrishna Reddy
Creativity and Innovation in B-Schools:Potential Areas for Development
K. Renuka Raju, Shakeel Ahmad A. Ramachandra Aryasri
Training Effectiveness on Job Performance - An Analytical Study with Reference to Dairy Industry
Menaka.Bammidi Puppala. Hyndhavi
Performance Appraisal Impact on Employee Job Satisfaction with Reference to TSSPDCL
M. Ramu Mohd. Akbar Ali Khan
Mobile Data Usage Behavior: A Study on Bottom of the Pyramid Market Leena Sharma
Cash to Cashless Economy: Challenges and Opportunities Saneem Fatima, Shakeel Ahmad
Dr. A Kotishwar
Dr. P. Vijaya Lakshmi, Associate ProfessorEditorial Board
GUIDELINES FOR AUTHORS
1. The cover page of the article/research paper should include the title of the paper, Author’s name, Designation, organization with the address, contact number & email address.
2. Abstract of not more than 200 words outlining the purpose of study should be presented on a separate sheet along with 5-6 keyword immediately preceding the text.
3. Name(s) of the author(s) should not appear anywhere in the entire text other than the cover page. 4. All the manuscript will be sent for blind review process, the corresponding author will be informed by
the editor about acceptance or rejection of the manuscript within a period of time. On acceptance of the manuscript, the modifications suggested by the reviewers are to be incorporated by the author with in a period of 10 days and send copy of the revised manuscript again.
5. The editor reserves the right to modify or improve the manuscript as per the standard of journal. 6. The copyright of the research papers published in the journal shall lie with the publisher.
7. The authors whose papers are selected for publication shall make a subscription (Rs. 2500) for annual of the printed edition of the journal per author.
8. Copies of the journal are available by way annual subscription (Rs. 2,500 for annual or Life Time Rs. 10,000).
General Information about submission
1.
• Covering Letter: Title of the Paper, Author’s Name, Designation, Organizations, Official Address, Personal Address, Contact Numbers (Official & Personal) and e-mail address
• - objectives, Research Questions / Hypothesis, Methodology,
findings and 5-6 keywords. Words limit - 250-300 words.
2.
• Format : A4 size, Ms-word
• Word Limit : Not to exceed 5000 words • Font : Times New Roman
• Size : Title - 18, Heading - 14, Text-12 • Line spacing : 1.5
3. Author must declare originality of work. The article should not have been published or be submitted for publication else where.
4. Editorial Board’s decision will be final.
5. The copyright of all accepted papers will vest with dept. of MBA - CMRCET For Submission:
Abstract: should contain
Full Paper
Declaration :
Medchal Road, Hyderabad.
Assistant Managing Editors
Telangana, India.
CMRCET-MBA Publication :
Authors shall be responsible for the ideas, thoughts expressed by them.
Patrons
Chairman CMRGI Vice-Chairman CMRGI Secretary & Correspondent CMRGI
Ch. Malla Reddy, Ch. Narasimha Reddy, Ch. Gopal Reddy,
Advisory Board
Director - (Academics), CMRGI Principal - CMRCET
Dr. N. Satyanarayana, Major Dr. V.A. Narayana,
Chief Editor
Professor & HOD, Dep of MBA, CMRCET
Dr. A Kotishwar,
Managing Editors
ProfessorDr. P. Hima Bindu,
Dr. P. Alekhya, Associate Professor
S.No Name Address
1 Honorable Former Vice-Chancellor. Telangana University, Nizamabad, Andhra Pradesh
2 Professor, Department of Commerce , Bangalore University 3 Pro-Vice chancellor, Maulana Azad National Urdu University,
Hyderabad
4 Professor & Head, Department of Commerce, University of Madras, Chennai 5 Head & Associate Professor, AL Buriami University College, Oman
6 Professor & HOD, Department of Banking & Business Economics, Mohan Lal Sukhadia University, Udaipur, Rajasthan.
7 Director, School of commerce & Management Science, Swami Ramanand Teerth, Marathwada University, Nandeds
8 Head, Department of Commerce. University of Mumbai
9 Professor, SMS, JNTUH
10 Professor, School of Management Studies, University, Hyderabad 11 Professor Department of Commerce, Dr. Babasaheb Ambedkar
Marathwada University, Aurangabad
12 Dean & Chairperson, Faculty of Commerce& Mgt, Bhagat Phool Singh Mahila Vishwavidyalaya, Khanpur Kalan, Haryana
13 Associate Professor, Indian Institute of Management Kozhikode, Kerala 14 Professor & Head, School of Management Studies, Punjabi University,
Patiala, Punjab, India
15 Associate Professor, School of Management Studies, University, Hyderabad
16 Associate Professor, Department of Commerce, Delhi School of Economics, University of Delhi
17 Professor Finance , Indian institute of management Kozhikode, Kerala 18 Associate Professor, Department of Business Administration,
Annamalai University, Tamil Nadu.
19 Associate Professor Department of Business Administration and Accounting, Al-Buraimi University College
(Affiliated to California State University, Northridge, USA), Prof. Mohd Akbar Ali Khan
Dr. M Muninarayanappa Dr. Shakeel Ahmad
Dr. S Gurusamy
Dr. Mohammed Jahangir Ali Prof. Renu Jatana
Prof. Vani N Laturkar
Dr. Vivek Deolankar Dr. Sindhu
Dr Mary Jessica
Prof. Walmik K. Sarwade
Prof. (Dr.) Sanket Vij
Dr. Sudershan Kuntluru Prof. G S Batra
Dr. Chetan Srivastava
Dr. Vanita Tripathi
Dr. Rachappa Shette Dr. A.A. Ananth
ISSN: 2277-6753 (Print) ISSN: 2322-0449 (Online)
SUMEDHA-Journal of Management
Referred Journal of CMR College of Engineering & Technology
April-June2019, Volume 8, No. 2
S. No.
Title Authors Page No.
1. A Model Proposition for Prescreening Candidates in Recruitment Process Using Fuzzy Vikor Method
Murat Bolelli* 1-19
2. An Integrated Marketing Communications, Media Synergies and its effect on the Consumer Decision Making Process
Reshma Nikhat* 20-32
3. Influence of Organizational Climate on Employee Turnover Intention in Information Technology Industry in Kerala
Jnaneswar. K*, Gayathri Ranjit**
33-46
4. Impact of Transformational Leadership Style Dimensions on Organizational Performance: An Empirical Analysis
Shruti Balhara*, Harbhajan Bansal**
47-57
5. Impact of Quality of Work Life on Organisational Commitment
Indu Bala*, Ramandeep Saini**, B.B. Goyal***
58-72
6. Mediating Role of Personal Accomplishment among Emotional Labour Strategies and Teaching Satisfaction among Professional College Teachers
Jitha G. Nair* 73-82
7. Testing of Long-Run Relationship between Gold Prices and Stock Market Return: An Empirical Analysis in India
Tanvi Bhalala* 83-96
8. Emerging Distribution Channel Effectiveness in Rural Jharkhand for Consumer Electronics
Punit Kumar Mishra*, Girish Kumar Srivastava**
97-112
9. Changing Role of Learning and Development Methodologies in Digital Age - A Comparison between Manufacturing and Service Industry
S. Rajeshwari*, D.Raghunatha Reddy**, M.Ramakrishna Reddy***
113-126
10. Creativity and Innovation in B-Schools: Potential Areas for Development
K. Renuka Raju*, Shakeel Ahmad**, A. Ramachandra Aryasri***
127-133
11. Training Effectiveness on Job Performance - An Analytical Study with Reference to Dairy Industry
Menaka.Bammidi*, Puppala. Hyndhavi **
134-147
12. Performance Appraisal Impact on Employee Job Satisfaction With Reference to TSSPDCL
M. Ramu*, Mohd. Akbar Ali Khan**
148-156
13. Mobile Data Usage Behavior:
A Study on Bottom of the Pyramid Market
Leena Sharma* 157-169
14. Cash to Cashless Economy: Challenges and Opportunities
Saneem Fatima*, Shakeel Ahmad**
Chief Editor Message
As SUMEDHA Journal of Management Thirtieth issue, We look forward to the momentous
growth of our Journal, increasing in their appeal, readership and relevance to the fast-changing
world of Business Management. During these six years journey our journal has been critically
evaluated by various institutions with similar line of interest and faculty fraternity. We have
been consistently seeking advice from experts to continuously improve the quality of the
journal. Our journal has got UGC Approval Journal (Serial No : 46802 ), Indexed in Indian
Citation Index (ICI), PROQUEST Database, Google scholar JUSER Database, MIAR Data
Base, Index Copernicus value 59.11, ISRA Journal Factor 4.018, Sjifactor Impact factor 4.339,
International Scientific Indexing Impact factor 1.332. On behalf of the Management, Editorial
Board and Editorial Team, I express my profound gratitude to all our authors, reviewers,
readers and patrons for offering their overwhelming support and I anticipate a continued
and lively partnership for years to come.
All of us recognize the necessity for change, which results in progress. It gives way to new
ideas and perspectives reflecting the current and emerging environment, which builds on
the solid foundations of the past.
Last but not least valuable would be your response and suggestions on this issue. Kindly
send us your views so that we can keep on upgrading our journal.
Thanking you
Mobile Data Usage Behavior: A Study on Bottom of the Pyramid Market Leena Sharma* SUMEDHA-Journal of Management
Referred Journal of CMR College of Engineering & Technology April-June 2019, Volume 8, No. 2, pp 157-169
ISSN: 2277-6753 (Print) ISSN: 2322-0449 (Online) http://cmrcetmba.in/sumedha/
Mobile Data Usage Behavior:
A Study on Bottom of the Pyramid Market
Leena Sharma*
* Asst. Professor, Department of Management, St. Xavier's College, Hathori Fort Road, Jaipur, Rajasthan.
Abstract
Internet connectivity and its relevant use on mobile through data can provide access to range of life enhancing services for Bottom of Pyramid Market (BoP) market. This paper is intended to provide a valuable insight for telecom players and policy makers to segmentrelatively unexplored BoP market. The recent phenomenon of mobile data usage behavior of telecom customers in the BoP market based on a large sample survey of telecom usersusing convenience random sampling is discussed in this study. Hypothesis of the study was mobile data consumption has a significant impact on various demographic factors. The questionnaire was administered to masons on construction sites, roadside vendors,and helpers of shop-keepers, office boys, Cycle Rickshaw pullers and house maids working in urban set up but falls in the category of BoP market segment. Data is analyzed using SPSS version 20. Descriptive statistical tools like frequency distribution and Cross Tabulations, Chi Square and ANOVA are used to interpret the data. Scope of the study will help the marketers to analyze the impact of mobile data usage by BoP customers thus helping them to provide data services relevant to improve their livelihood.
Keywords: Bottom of Pyramid Market(BoP), data consumption pattern, mobile data, digital revolution.
JEL classification : M31, O14, O33
PUBLISHING CHRONOLOGY
PAPER SUBMISSION DATE : JANUARY 19, 2019;
PAPERSENTBACKFOR REVISION : FEBRUARY 20, 2019;
PAPER ACCEPTANCE DATE : MARCH 16, 2019
Reference to this paper should be made as follows:
Mobile Data Usage Behavior: A Study on Bottom of the Pyramid Market Leena Sharma*
158
-1.
I
NTRODUCTIONThe concern of market share by increasing the number of subscribers has become obsolete for mobile companies. Data consumption and its usage is the king of telecom market.This is probably the impact of Reliance Jio's entry in Indian telecom market, followed by shutting of few mobile companies and mergers of big players. For Indian Telecom sector companies, where market and revenue both holds an equivalent weightage, mobile companies are keen to focus on data consumption pattern and want to increase their average revenue per user (ARPU) on the basis of more usage of data.
Rather instead of ARPU, ADC (Average data consumption) is the key to hold the telecom market share. As the premium and super premium segments already stand at verge of saturation.Moreover increased availability of bandwidth, cheap data plans and increased awareness driven by government programs have contributed to increasing the mobile internet user base of 627 million by end 2019(Mathur ,2019)The rate of data adoption is increasing annually with 35 % growth Rate (Kantar IMRB ICUBE report, 2018) There is need felt by the telecom companies to shift their focus from largely urban, already well-served and highly competitive market to untapped market which is Bottom of the Pyramid (BOP )market. The only market that can sustain a business in future decades to come.
Beyond this Introduction on the background details. The paper is divided into four sections. Section 1 gives an idea about the nature of Bop market for telecom companies. Each company follows a unique or a combination of diverse strategies by offering more data plans to target this market. Section 2 reviews the existing literature on the studies done on BoP market relevant to telecom. Section 3 and 4 discuss the objective and research methodology .Section 5 explains the study results of buyer behavior based on responses obtained from a well-structured questionnaire. Section 6 concludes the study with the finding that the BoP market is a huge opportunity waiting to be tapped.
1.1 BOTTOMOF PYRAMID MARKET FOR TELECOM COMPANIES
Mobile Data Usage Behavior: A Study on Bottom of the Pyramid Market Leena Sharma*
Table 1: SWOT Analysis of Bop Market for Indian Telecom Companies
Strength of BOP market
Creates atmosphere of national and
regional integration.
Dependent on interaction with
neighboring market.
Continuous need of information
about employment
Better coordination for delivery of
administration and public service
Because of rural base requires
timely information on business, price, and markets.
Weakness of BOP market
This sector requires players with
huge financial resources.
Lack of better connectivity.
Slow pace of reform process.
Lack of infrastructure.
Problem of limited spectrum
availability and issue of interconnection charges between private and public
operators.
Opportunity in BOP market
Largest and fastest growing
segment
Huge market potential
Increase availability of Bandwidth.
Contribution in economic
development
Government
announcements/initiatives for increased awareness Driven Program.
Threat in BOP market
Profit earned by intermediaries
Linguistic fragmentation.
Source: Compiled by Author
Not only telecom companies marketing efforts but also Government is making an efforts to involve Bop market in digital connectivity by more access to internet/data as per their affordability.In spite of certain weaknesses and threats (Table 1), Indian Bop Market has empowered themselves by becoming techno friendly .They want to be digitally connected and reap the benefit of digital communication. They follow a mechanism to cope with poverty either by migrating for livelihood support or relying on more than one source of livelihood like free lancing. Telecom companies do understand their affordability issue thus they are innovating their data offerings by cheap data plans.
2.
L
ITERATURER
EVIEWMobile Data Usage Behavior: A Study on Bottom of the Pyramid Market Leena Sharma*
160
-money on basic needs is no longer hold to be true as Bop consumers are brand oriented (Prahalad, 2005), well informed, demanding, value seeking and impatient(Kumar, 2017) and like to experiment by adopting innovative products and services according to their affordability(Osakwe & Okeke, 2016). The digital economy is dependent on its use by poor. Moreover for both social and economic transformations Bottom of the Pyramid market contributes by involving them in digital revolution(Jung,2012).Studies on BoP market for their financial inclusion shows that connecting them through technology is an appropriate solution (Renuka , 2015).The acceptance of technology among BOP markets is dependent on factors including social influence, value, facilitation, ease of use and perceived usefulness (Hossain & Jamil, 2015) satisfying needs of customers from BoP markets requires companies to innovate (Jagtap & Kandachar, 2009). Studies has been done on influence of various factors that influence more technology adoption targeted to smartphone application (Malik, 2017). In determining the user preference towards mobile apps, demographic factors plays a critical role (Elangovan, Agarwal 2015).
India's BOP market using ICT(information and communication technology) is 51 percent urban, with urban BOP households outspending rural ones in the ratio of 3:1(WRI Report,2007).This Digital divide is hindering the data usage for effective utilization of BoP market. This digital divide is due to gap of supply and demand side. This gap can be minimized where supply side needs skill based training about the digital market and demand side can be satisfied by equivalent internet availability and digital literacy. (Zabir, Ashir, Yasuura, 2008) Urban Bop households are spending their extra earnings on mobiles(Joshi and Dogra, 2012).Studies on influencing behavior on use of internet is being done on social media usage at workplace by working professional (Gaurav, Dheer, 2018).However, it might be a good strategy for companies to target the urban BoP instead of the rural BoP as it promises to be a more realistic option (Mathur et al, 2018). Several studies have been done on the factors influencing the choice of mobile handset, purchasing motives, choice of brands and consumer buying behavior of mobile phone devices(Sata, 2013) like studies on Mobile usage at BoP market are underdeveloped countries like Kenya and South Africa ( World Bank report 2012 Report ). A study is also done on Motivational drivers for the use of mobile other than voice calls (more stress on SMS) with BOP context for South Asia also(Juhee Kang 2014). All studies are either focused on mobile use or digital literacy, studies focused on mobile data consumption by BoP is not explored in detail. This study is an attempt to fill the research gap to explore the possibility of data use in BOP context.
3.
O
BJECTIVEOF THES
TUDYWith the main aim, to find out the critical consideration of the BOP market for availing data services. The objectives of the study are:
• To study the determinants of the use of mobile data in a sample of people residing in urban area but are from the bottom of the pyramid (BOP).
Mobile Data Usage Behavior: A Study on Bottom of the Pyramid Market Leena Sharma*
• To determine the factors that would facilitate and encourage the adoption of data consumption by BOP market.
• To identify the marketing effort needed by the telecom companies to penetrate the BOP market for increasing the data consumption for relevant use.
4.
R
ESEARCHM
ETHODOLOGYThe study is exploratory and descriptive research. The research is primarily analytical in nature drawing upon information from various primary and secondary sources in order to furnish a clear picture of the prevailing mechanisms and fast changing scenario of digital revolution to cater to the needs of BOP market .The questionnaire was administered to auto drivers, masons, office assistants, roadside readymade vendors, tailors, helpers of shop-keepers , workers and laborers earning daily wage laborers, hawkers, rickshaw pullers, vegetable vendors and several others fall into this category.. Various findings were obtained in the course of administering the questionnaire to the BOP consumers.Data is collected and analyzed using SPSS version 20. Descriptive statistical tool like frequency distribution and Cross Tabulations, Chi Square test are used for analysis. One way ANOVA at a significance level of 5 % are used for testing the hypothesis regarding the data consumption and usage pattern of Bop market sample.
4.1 SAMPLESELECTION -CHOICEOF SAMPLEAREA
Method of sampling selected for the study is stratified random sampling .As different strata is classified on the basis of demography. Respondents are selected on the basis of convenience. Sampling is done from Jaipur City of Rajasthan. The target population consisted of consumers whose daily wages were not more than Rs 100 to Rs 300 a day. Basis of the selection of this city for data collection is more tele-density subscriber base and its socio-demographic features.
4.2 SAMPLE SIZE DETERMINATION
The sample size for the study was calculated with the help of following sample size determination formula for an infinite population:
n = Z 2 * p *q/E2
Where n= sample size to be determined
p= it was used as 0.50 to reach the maximum size of variation q = 1-p, which is 0.50
e = error tolerance (we have used 5 %)= 0.05
Z = 1.96 at 95 % confidence level (as per table of area under normal curve for the 95 % confidence level) n = 384.16 ~= 384 thus the response are collected from 384 respondents.
4.3 SAMPLEDISTRIBUTION
Mobile Data Usage Behavior: A Study on Bottom of the Pyramid Market Leena Sharma*
162
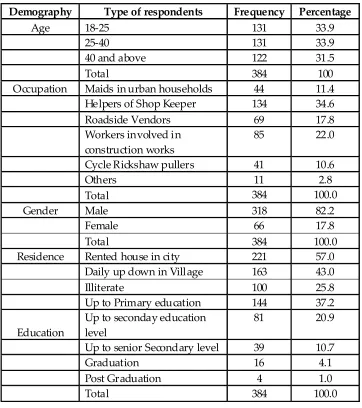
-Table 2: Frequency Distribution of Demography of sample respondents
Demography Type of respondents Frequency Percentage
Age 18-25 131 33.9
25-40 131 33.9
40 and above 122 31.5
Total 384 100
Occupation Maids in urban households 44 11.4
Helpers of Shop Keeper 134 34.6
Roadside Vendors 69 17.8
Workers involved in construction works
85 22.0
Cycle Rickshaw pullers 41 10.6
Others 11 2.8
Total 384 100.0
Gender Male 318 82.2
Female 66 17.8
Total 384 100.0
Residence Rented house in city 221 57.0
Daily up down in Village 163 43.0
Illiterate 100 25.8
Up to Primary education 144 37.2
Education
Up to seconday education level
81 20.9
Up to senior Secondary level 39 10.7
Graduation 16 4.1
Post Graduation 4 1.0
Total 384 100.0
Source : Primary Data
4.4 DATABASE
Mobile Data Usage Behavior: A Study on Bottom of the Pyramid Market Leena Sharma*
(11.4%), helpers of shopkeeper (34.6%), roadside vendors (17.8 %), workers, daily wage laborers who come to urban construction site for work (22%) and cycle rickshaw pullers (10.6%).As the respondents have migrated from rural areas for livelihood support thus with respect to their residence 51 % live in the rented housed in the city and 49 % do daily up down to their base village .Both male (82.8 %) and female(17.8%) respondents are considered for this study. Still BoP segment is deprived form education opportunity, 25.8 % respondents were found illiterate.
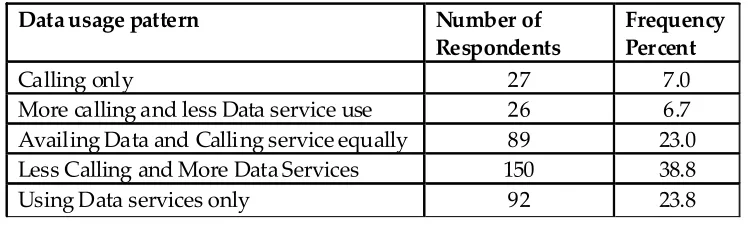
Responses about data usage pattern is collected( refer Table 3 ) from ratio of mobile use with data use as only 7 % use mobile for calling purpose . 6.7% were doing more calling than data service use. 23 % of the respondents use for both equally. However it is interesting to note that 38.8 % (150 respondents) use their mobile for more data consumption compared to calling purpose. Contrary to the perception of less data use by this market segment 92 (23.8 %) of the respondents are comfortable using their mobile only for data services.
Table 3: Frequency Distribution of Data Usage pattern
Data usage pattern Number of Respondents
Frequency Percent
Calling only 27 7.0
More calling and less Data service use 26 6.7
Availing Data and Calling service equally 89 23.0
Less Calling and More Data Services 150 38.8
Using Data services only 92 23.8
Source: Primary Data
4.5 RESEARCH IMPLICATIONS
In order to penetrate the BoP market it is not necessary to target rural areas. For telecom companies to succeed, providing efficient data service and to increase revenue on the basis of data consumption is necessary .Thus understanding the need of BoP market is of utmost importance.
4.6 LIMITATIONOFTHESTUDY
Respondents are limited to Jaipur city only due to time constraint. Convenience sampling is used to collect the data. Response could have been collected from more varied BoP mobile users other than used in this study.
5.
A
NALYSISANDI
NTERPRETATIONMobile Data Usage Behavior: A Study on Bottom of the Pyramid Market Leena Sharma*
164
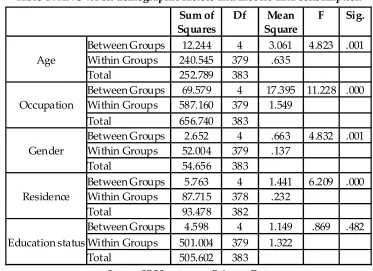
-Table 4 : ANOVA on demographic factors and mobile data consumption
Sum of Squares
Df Mean Square
F Sig.
Age
Between Groups 12.244 4 3.061 4.823 .001
Within Groups 240.545 379 .635
Total 252.789 383
Occupation
Between Groups 69.579 4 17.395 11.228 .000
Within Groups 587.160 379 1.549
Total 656.740 383
Gender
Between Groups 2.652 4 .663 4.832 .001
Within Groups 52.004 379 .137
Total 54.656 383
Residence
Between Groups 5.763 4 1.441 6.209 .000
Within Groups 87.715 378 .232
Total 93.478 382
Education status
Between Groups 4.598 4 1.149 .869 .482
Within Groups 501.004 379 1.322
Total 505.602 383
Source: SPSS output on Primary Data
Age, occupation, gender and residence with their significant value less than .05 in these factors, has a significant effect on consumption pattern on mobile data consumption pattern. While education status has no significant effect on use of data on mobile with value of significant value greater than .05 (.0482 as exhibited in exhibited in 6th Col. (Sig.) of table 4. In other words, there is no significant difference between levels of education concerning their data usage behavior, i.e., Illiterate = Primary education=Secondary education =Senior Secondary =Graduation = Post - Graduation. Data consumption and usage by subscribers can be increased by intensive awareness programs for BoP market.
Hypothesis 2: Mobile and data service usage is significantly affected by the monthly expenses on the mobile and data.
Table 5: ANOVA on Monthly Expenses on data Services and mobile data consumption
Sum of Squares
df Mean Square
F Sig.
Between Groups 19.448 4 4.862 4.488 .001
Within Groups 410.552 379 1.083
Total 430.000 383
Mobile Data Usage Behavior: A Study on Bottom of the Pyramid Market Leena Sharma*
Monthly expenses on data with their significant value less than .05 (.001 as per table 5) in these factors, has a significant effect on consumption pattern on mobile data. Data is collected on five levels of per month expenses on data pack on mobile ranging from less than Rs 10 ,10-50, 50-100, 100-200, more than Rs 200.The result signifies that more affordability increase the tendency of consuming more data packs offered by service provider. Small data packs are the key to enter increase Bop Data consumption. With an average of Rs 100 to Rs 300 earned per day, the price must be affordable for the BOP consumers. The top-up cards or the recharge coupons must be affordable to the consumers. If the top-up on data packs could be provided for small rechargeable packs, they stretch for use till one month, then it may provide larger volumes of sale. All the terms and conditions must be transparent and easy to understand by the BOP consumers.
Hypothesis 3: Purpose of using Internet /data packs is significantly affected by data service consumption.
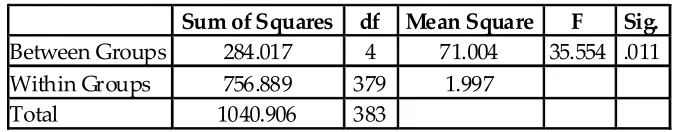
Table 6: ANOVA on Purpose of using Mobile Data Packs and Mobile data service consumption
Sum of Squares df Mean Square F Sig.
Between Groups 284.017 4 71.004 35.554 .011
Within Groups 756.889 379 1.997
Total 1040.906 383
Source: SPSS output on Primary Data
Purpose of consuming data on mobile with their significant value 0.011( As per table 6) which is less than .05 has a significant effect on data use on mobile. Respondents are using the data for following purposes like browsing internet, downloading games and apps, social relation, work connectivity, job opportunity, using messaging apps and social status and family relations. Though they are not able to calculate the amount of data consumed in these internet uses but they try to experiment by actual data usage.
Mobile Data Usage Behavior: A Study on Bottom of the Pyramid Market Leena Sharma*
166
-Table 7: ANOVA on type of occupation and basis of selecting handset and service provider
Sum of Squares
Df Mean Square
F Sig.
Basis of Selecting Service provider
Between Groups
19.502 5 3.900 4.371 .001
Within Groups 336.388 377 .892
Total 355.890 382
Basis of selecting handset
Between Groups
2.684 5 .537 2.770 .018
Within Groups 73.076 377 .194
Total 75.760 382
Source: SPSS output on Primary Data
As per ANOVA analysis Data Consumption pattern ( table 7) is significantly effected with value .001 and .018 by two variable i.e basis of selecting service provider( retailer suggestion, promotional campaigns or family or friends influence) and selection of handset( first hand or second hand purchase) respectively . With many BOP customers largely inaccessible to conventional advertising media so building awareness is another challenge. The information about a service could be obtained more through the "word-of-mouth. The main requirements of the respondents were good internet speed and low rates. Majority of respondents had come to know about the service they are using from their friends. Hence it is important to have satisfied customers too. It is also interesting to know that the handset with normal feature phone properties are replaced by second hand low cost smartphone for data accessibility purpose only by BoP mobile users .
Hypothesis 5:There is a significant relation between type of occupation and purpose of Data usage mobile
Table 8: Chi-Square Test of Occupation type and mobile data consumption
Value Df Asymp. Sig. (2-sided)
Pearson Chi-Square 118.910a 30 .000
Likelihood Ratio 113.248 30 .000
Linear-by-Linear Association .275 1 .600
N of Valid Cases 384
Mobile Data Usage Behavior: A Study on Bottom of the Pyramid Market Leena Sharma*
The above chi square test indicating that, the significant value is 0.00(refer Table 7), which is less than 0.05revealed that there is a significant relation between the type of occupation of BoP and their data usage purpose.
5.1 MAJOR FINDINGSOFSURVEY
• On the basis of responses obtained from the study it is observed that people are open to new schemes and offers but are highly price sensitive.
• They prefer to avail free Wi-Fi areas in the city to access data.
• A very small percentage of the target market was aware of the fact that data helped them in getting access to apps which are especially relevant to their basic needs like health, education and employment opportunities.
• As most of them are consuming data for entertainment purposes. They are using data calling (whatsapp video call) for social connectivity.
• BoP market prefer a low cost handset that too is a second hand purchase.
• Majority of the smartphone BoP users use it as a feature phone only, signifying smartphone just as a status symbol for urban BoP market.
• They still feel browsing internet and downloading applications as a complex phenomenon due to language and literacy issue.
• They are even dependent on others not only on purchasing handset and downloading
certain apps, games and ringtones but also on data plans.
• Data is mostly consumed by women users for downloading and playing online games
of which are they are not aware.
6.
C
ONCLUSIONA
NDR
ECOMMENDATIONSOperators need to generate short-term revenues through voice and more basic value-added services and discounted pricing schemes, rather than spending money on high-end services and content requiring expensive fees to content developers, for this innovation in value chain needs to be done. Since targeting this segment does not deal with a short term strategy so telecom companies need to focus on such corporate social responsibility (CSR) initiatives targeted to improve the standards of living in the local BOP communities. Handset companies need to work on innovative phone features specially designed for illiterate BOP customer by using icons with color identification along with the text in their menus.
Mobile Data Usage Behavior: A Study on Bottom of the Pyramid Market Leena Sharma*
168
-BOP market need to be segmented on varied parameters of age, gender, income, residence, occupation and noticeable service needs by the telecom companies to market its offerings.
In order to penetrate the BOP market it is not necessary to target only rural areas instead telecom companies should target women working as maids in urban households, working staff at various factories, construction houses, shops , hotels etc as these people are settled at urban cities for their livelihood .If telecom companies are able to generate awareness and are able to create need for mobile and data connections among these customers than somehow this will reach to wide customer base of BOP market.
7.
S
COPEOFF
URTHERR
ESEARCHThe study can also be done to understand the attitude towards data use specifically related to mobile application which are of relevant use for the improving the situation of BoP market. Study can be extended for specific mobile application of Government Schemes targeted for the use by BoP market. More research can be done on use of mobile data relevant according to their occupation which can increase their earnings.
R
EFERENCES[1]. Mathur, Nandita (2019). India's internet base crosses 500 million mark, driven by Rural India. Retrieved from https://www.livemint.com/industry/telecom/internet-users-exceed-500-million-rural-india-driving-growth-report-1552300847307.html.
[2]. Kantar IMRB REPORT(2018).Report on Digital adoption and usage trends. Retrieved from http:// www.uniindia.com/kantar-imrb-releases-the-twenty-first-edition-of-icube-report/press-releases/news/ 1521008.html, posted 7 march 2019.
[3]. Prahalad, C.K (2002). The Fortune at the Bottom of the Pyramid: Eradicating Poverty Through Profits , Wharton School Publishing, 5th Edition.
[4]. Dhobal, Shailesh (2006, August,24). ABCD consumer comes of age. The Economic Times.
[5]. Hart, Stuart L., Prahalad, C.K (2006).Rural India- An untapped market for Global solution providers, Marketing mastermind, ICFAI Publishing.
[6]. Heeks, Richard. 2010. Do Information and Communication Technologies (ICTs) Contribute to Development? Journal of International Development 22 (5): 625-640. doi: 10.1002/jid.1716.
[7]. Jagtap,S .Kandachar, P.(2009) . Towards Linking Disruptive Innovations And BOP Markets. Proceedings of International Conference on Engineering Design, ICED'09 24 - 27 August 2009, Standford University, CA, USA.
[8]. Prahalad, C.K. (2005). The fortune at the base of the pyramid: Eradicating poverty through profits, New Jersey: Wharton School Publishing.
[9]. Kumar, Anurag. (2017). Is Bottom of Pyramid Marketing more relevant today. Retrieved from https:/ /www.linkedin.com/pulse/bottom-pyramid-marketing-more-relevant-today-anurag-kumar/Published on May 24, 2017.
Mobile Data Usage Behavior: A Study on Bottom of the Pyramid Market Leena Sharma* [11]. Jung, Daniel. (2012). Digital communication and the BoP.Retrieved from https:// businessfightspoverty.org/articles/why-is-digital-communication-increasingly-important-for-marketing-at-the-bop/. Published on July 22, 2012.
[12]. Renuka, B (2015). Effectiveness of Financial Inclusion Through BC Model: From the Perspective of Account Holders. Sumedha Journal of Management. 4 (2), pp. 27-45.
[13]. Hossain, M.M. Jamil, Raihan. Md. (2015).Consumer Acceptance of More-Than-Voice (MTV) Services: Evidence from the Bottom of Pyramid in Bangladesh. The Journal of Developing Areas 49(5):25-39. DOI: 10.1353/jda.2015.0066.
[14]. World Resource Institute Report (2007).The Next 4 Billion: Market Size and Business Strategy at the Base of the Pyramid. World Resources Institute. Pg 48.Retrieved from https://www.wri.org/resources/ charts-graphs/india-total-bop-ict-spending-income-segment .
[15]. Zabir S.M.S., Ashir A., Yasuura H.(2008) Digital divide: The amazing facts at the bop MCCSIS'08 -IADIS Multi Conference on Computer Science and Information Systems; Proceedings of ICT, Society and Human Beings, pp. 155-162.
[16]. Joshi. M C. Dogra C.S. (2012). An analysis of Bop market of India and opportunities available for MNC's. ELK's International Journal of Marketing - UGC Approved, 03(1)62-69. Retrieved from http:/ /www.elkjournals.com/.
[17]. Gaurav.Kunal. Dheer Shreya (2018). Social Media Usage at Workplace - An Empirical Investigation. Sumedha Journal of Management. Vol 7 (1). 144-157.
[18]. Mahima Kaura Mathur, Ritu Mehta, Sanjeev Swami, Sanjeev Bhatnagar (2018). Exploring the Urban BoP Market, in Ramendra Singh (ed.) Bottom of the Pyramid Marketing: Making, Shaping and Developing BoP Markets (Marketing in Emerging Markets, Volume ) , pp.199 - 212
[19]. Sata M. (2013). Factors affecting consumer buying behavior of mobile phone devices. Mediterranean Journal of Social Sciences. Rome-Italy: MCSER Publishing. 2013; 4(12):103-12.
[20]. Kang, J. (2014). More-than-voice use mobile at the bottom of the pyramid: Analysis of motivational and contextual drivers to mobile use among low income users in South Asia. ProQuest Dissertations and Theses.
[21]. World Bank Report (2012).Mobile Usage at the Base of the Pyramid: Research Findings from Kenya and South Africa. Retrieved from http://www.infodev.org/mbopsummary.
[22]. Malik A, Suresh S, and Sharma S. (2017). "Factors influencing consumers' attitude towards adoption and continuous use of mobile applications: A conceptual model", Procedia Computer Science, Vol.122, pp.106-113.DOI .org/10.1016/j.procs.2017.11.348.