Vol. 5 Issue 3, March - 2019
Determination Of Several Plant Characteristics
Affecting Yield Per Decare In Peanut Using
Different Regression Models
Senol Celik1, Erkan Boydak2
1Department of Animal Science, Biometry Genetics Unit, Agricultural Faculty, Bingol University, Bingol, Turkey 2Department of Field Crops, Faculty of Agriculture, University of Bingol, Turkey
Corresponding author: [email protected]
Abstract—In this study, the effect of plant height (PH) and per plant yield (PID) on peanut yield per decare was investigated. Regression model was used in this research. The parameter coefficients of the regression model were found to be significant with ordinary least squares (OLS) method (P < 0.01). Heteroscedasticity problem was not detected in the regression model predicted by the OLS method, but autocorrelation problem was found since the Durbin-Watson (DW) coefficient was 0.96. Therefore, Robust regression model was tried. M, S and MM estimators in the Robust regression model were examined comparatively. The determination coefficient (R2) values for the M, S and MM estimators were found to be 0.813, 0.795, and 0.823, respectively. The MM estimator with the highest R2 value was considered the most suitable Robust regression model. According to the MM estimator, the PH coefficient was found to be 9.70 and the PPY coefficient was found to be 3.48. According to this result, when the other variable is constant, one cm increase in PH value will result in 9.70 kg increase in decare yield in peanut, and one gram increase in PPY will result in 3.48 kg increase in decare yield.
Keywords—Robust regression, groundnut, plant characteristics, yield
I. INTRODUCTION
Groundnut (Arachis hypogaea L.) is one of the most important oil seed crops throughout the world [1]. The groundnut is mainly used for human consumption in natura, processing, or oil production. It is currently being studied as a hopeful raw material for biodiesel production on account of the high concentration of oil in its seeds [2].
Groundnut has high economic and nutritional potential and is an important cash crop for peasants in poor tropical countries. Industrially, the oil produced from the kernels is used in the manufacture of lubricants and various items ranging from soap to plastics. The seedcake has been used for livestock feed and fertilizer and shells have been utilized as filter for wallboard and insulators [3]. Groundnut (Arachis hypogaea L.) is an important annual legume in the world primarily grown for oil seed and food [4, 5].
The groundnut plays an extremely important agronomic role in the institutional farming systems as a nitrogen fixer in crop rotations [6]. Groundnut has a great yield potential in Turkey [7]. Crop responses to variable water applications were used to determine irrigation and water use strategies for many crops [8].
Peanut plant is grown by periodic watering in regions influenced by the Mediterranean climate in Turkey. In terms of soil characteristics, peanut plant grows very well in soil with good drainage and airing, loamy sand structure, moderate organic matter level, lime rich, and with a pH between 6.0-6.4 [9].
Peanut yield is not only dependent on breeding of varieties suitable for the region where it is grown, climate and cultural practices, insect damage and disease problems, but it can also be dependent on the direct and indirect interactions of the elements that make up the yield and quality [10].
As of 2017, China, India, and the United States are the top three countries in terms of peanut production in the world, while Myanmar, Argentina, the United Republic of Tanzania, Senegal, Chad and Brazil are among the important countries that produce peanuts [11]. Peanut production in Turkey in 2018 was 173835 tons. Highest production is made in Adana province (98834 tons), followed by Osmaniye (47632 tons) and Şırnak (9000 tons) provinces. Peanut is also produced in provinces such as Aydın, Antalya, Kahramanmaraş, Mersin, Hatay, and Gaziantep [12].
There are studies conducted on the peanut plant [13-17].
In this study, linear regression and robust regression estimators were studied and their effects on peanut yield were comparatively examined.
II. MATERIAL AND METHOD
A. Material
B. Method
Linear Regression Model
Linear regression is an approach to model the relationship between dependent variable y and one or more explanatory or independent variables represented x.
A linear regression model can be expressed as
𝑦 = 𝛽0+ 𝛽1𝑥1+ 𝛽2𝑥2+ ⋯ + 𝛽𝑝𝑥𝑝+ 𝜀
Ordinary least squares (OLS) is the method of the most commonly used in parameter estimation. The OLS estimate is carried as the solution of the problem
min 𝐽 = 𝑚𝑖𝑛 ∑ 𝜀𝑖2 𝑛
𝑖=1
Taking the partial derivatives of J with respect to β [18].
Robust regression methods
The main purpose of robust regression methods is to provide stable results when fundamental assumptions of the least squares regression are not compensated owing to the existence of outliers. In order to perform this stability, robust regression limits the effect of outliers by reducing the weights of outliers, changing the values of outliers or using robust estimation techniques[19]. Methods have been developed for these problems such as Huber M-estimation, S-estimation and MM-S-estimation [20].
M-estimation
Huber-type M-estimator 𝜃̂𝑀 of θ minimizes the sum of
less rapidly increasing functions of the residuals:
𝜃̂𝑀= arg min ∑ 𝜌 (
𝑟𝑖
𝑠(𝜃))
𝑛
𝑖=1
where 𝑟𝑖= 𝑦𝑖− 𝑥𝜃
s: scale parameter, 𝜌(. ): loss function which is even, non-decreasing for positive values and less increasing than the square function.
Assuming s to be known, the M-estimate is found by solving:
∑ Ψ (𝑦𝑖− ∑ 𝑥𝑖𝑘𝜃𝑘
𝑝 𝑘=1
𝑠 ) 𝑥𝑖= 0
𝑛
𝑖=1
where Ψ is the first derivative of 𝜌 [20].
The choice Ψ of the function is based on the preference of how much weight to assign to outliers and this leads to different variants of M-estimators [21].
S-estimation
S-estimation minimizes the distribution of the residuals [22]. But, it uses a robust measure for the variance. It is defined as
𝜃̂𝑀= arg min 𝜎̂ (𝑟(𝜃)) where 𝜎̂(𝑟) is an M-estimator of scale, found as the solution of
1
𝑛 − 𝑝∑ ρ (
𝑦𝑖− 𝑥𝑖𝜃
𝜎̂ ) = 𝐾
𝑛
𝑖=1
here K=const=E[ρ]. 𝜎̂: the standard deviation of the residuals. ρ(x) is defined as follows [22].
𝜌(𝑥) =
{ 𝑥2
2 −
𝑥4
2𝑐2+
𝑥6
6𝑐4 𝑓𝑜𝑟 |𝑥| ≤ 𝑐
𝑐2
6 𝑓𝑜𝑟 |𝑥| > 𝑐
The parameter c is the tuning constant. Efficiency is likely based on choices for tuning constant c and K [21].
MM-estimation
MM-estimation is to estimate the regression parameter by S estimation which minimize the scale of the residual from M estimation and after that keep on with M estimation. MM estimation aims to obtain estimates that have a high breakdown value and more efficient [19]. MM-estimator is the solution of
∑ ρ (𝑦𝑖− ∑ 𝑥𝑖𝑗𝛽̂𝑗
𝑘 𝑗=0
𝑠 ) 𝑥𝑖𝑗= 0
𝑛
𝑖=1
where s is the standard deviation obtained from the residual of S estimation and ρ is a Tukey’s biweight function [23].
III. RESULT AND DISCUSSION
Peanut yield per decare (kg) was taken as the dependent variable and the factors affecting the yield, plant height (PH) and per plant yield (PPY), were taken as the independent variables. Descriptive statistics of these variables are given in Table I.
TABLE I. Descriptive statistics for groundnut plant
Plant characteristics Mean Standard deviation
Yield 470.7 176.91
PH 21.81 7.215
PPY 67.18 30.416
PH: Plant height (cm), PPY: Yield per plant (g)
Vol. 5 Issue 3, March - 2019 This result is close to the values obtained in this
study.
Regression model was performed to determine the plant characteristics affecting yield in peanut plants. The results of this model are shown in Table II.
Table II. OLS (Ordinary least square) Regression model results
Variable Coefficient Std.
Error t-Statistic Prob. Constant 26.541 21.736 1.221 0.228
PH 9.481 2.028 4.674 0.001 PPY 3.533 0.481 7.344 0.001 R-squared 0.941 Adj. R-squared 0.938
F-statistic 356.919 Durbin-Watson
stat. 0.959
Prob(F-statistic) 0.000001
As seen in Table II, in the model obtained by OLS, yield was the dependent variable and PH and PPY were independent variables. The coefficient of PH was 9.481 and the coefficient of PPY was 3.533. The coefficients of these parameters were statistically significant (P < 0.001). When the overall significance of the model was tested, it was found that the model was significant (P < 0.000001), the determination coefficient R2 was 0.941, and Adjusted R2 was 0.938. Durbun-Watson d statistic was performed for autocorrelation test and DW was found to be 0.959. This result shows that the model has an autocorrelation problem. White nR2 test was performed to determine whether there was a heteroscedasticity problem. Based on the result of the White nR2 test shown in Table III, it was found that there was no heteroscedasticity (nR2 = 3.102 and P = 0.212> 0.05). Robust regression models were tried since the regression model estimated by OLS failed to meet several assumptions.
Table III. Heteroskedasticity Test
F-statistic 1.555 Prob. F(2,45) 0.222
Obs*R-squared 3.102 Prob.
Chi-Square(2) 0.212 Scaled explained
SS 2.510
Prob.
Chi-Square(2) 0.285
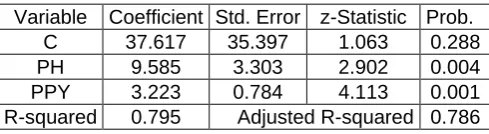
M, S, and MM estimation models were employed from robust regression models. M estimation results are shown in Table IV, S estimation results are shown in Table V, and MM estimation results are shown in Table VI. When M, S, and MM estimations were compared, the parameters of all models were found to be significant (P < 0.001 and P < 0.004). However, robust regression model with MM estimator that had
the highest R2 and Adjusted R2 values was chosen as the best regression model (Table 6).
Table IV. Robust regression model (M estimation)
Variable Coefficient Std. Error z-Statistic Prob. C 24.946 22.683 1.110 0.271 PH 9.718 2.117 4.591 0.001 PPY 3.474 0.502 6.919 0.001 R-squared 0.813 Adjusted R-squared 0.805
Table V. Robust regression model (S estimation)
Variable Coefficient Std. Error z-Statistic Prob. C 37.617 35.397 1.063 0.288 PH 9.585 3.303 2.902 0.004 PPY 3.223 0.784 4.113 0.001 R-squared 0.795 Adjusted R-squared 0.786
Table VI. Robust regression model (MM estimation)
Variable Coefficient Std. Error z-Statistic Prob. C 25.048 22.553 1.111 0.267 PH 9.701 2.105 4.609 0.001 PPY 3.479 0.499 6.968 0.001 R-squared 0.823 Adjusted R-squared 0.815
Using the robust regression model shown in Table VI, the coefficients of PH and PPY parameters were calculated as 9.701 and 3.479, respectively. In this case, robust regression model was obtained as Yield = 25.048 + 9.701*PH + 3.479*PPY. There is a positive correlation between PH and PPY variables and Yield. A 1-unit increase in the value of PH leads to a 9.701 unit increase in Yield, a 1-unit increase in PPY value leads to a 3.479 unit increase in Yield.
Arruda et al. (2015) performed a regression analysis to estimate the dry weight (DW) at 35, 47, 54 and 70 days after the emergence of peanut genotypes. By randomly selecting 10 plants in different genotypes, the authors created regression models to estimate the dry weight of the plant over time and obtained R2 values of 0.90 and higher [27].
IV. CONCLUSION
REFERENCES
[1] F. Onemli, “Impact of climate change on oil fatty acid composition of peanut (Arachis hypogaea L.) in three market classes”, Chilean J Agric Res., Vol. 72(4), pp. 483–8, 2012.
[2] J. Nakagawa and C. A. Rosolém, “O amendoim: tecnologia de produção”, Bauru: Fepaf, 2011
[3] I. C. Onwueme and T. D. Sinha, “Field crop production in Tropical Africa”, Technical Centre for Agricultural and Rural Co-operation Michael Health Ltd, Surrey, pp.324-336, 1991.
[4] S. Pande, R. Bandyopadhyay, M. Blümmel, J. Narayana Rao, D. Thomas and S. S. Navi, “Disease management factors influencing yield and quality of sorghum and groundnut crop residues”, Field Crops Res., vol. 84(1-2), pp.89-103, 2003.
[5] H. D. Upadhyaya, L. J. Reddy, C. L. L., “Gowda and S. Singh, Identification of diverse groundnut
germplasm: Sources of early maturity in a core collection”, Field Crops Res. Vol. 97(23), pp.261-271, 2006.
[6] G. V. Ustimenko-Bakumovsky, “Plant growing in the Tropics and Subtropics” Mir Publishers, Moscosw, 1993.
[7] S. Caliskan, M. E. Caliskan, M. Arslan and H. Arioglu, “Effects of sowing date and growth duration on growth and yield of groundnut in a Mediterranean-type environment in Turkey” Field Crops Res. Vol. 105(1-2), pp.131-140, 2008.
[8] S. Bozkurt, G. S. Mansuroğlu, M. Kara and S. Onder, “Responses of lettuce to irrigation levels and nitrogen forms”, African Journal of Agricultural Research vol. 4(11), pp.1171- 1177, 2009.
[9] A. Kadiroğlu, H. Baydar and M. Kocatürk, “Effect of application of gypsum on yield and quality characteristics of peanut (Arachis hypogaea L.), Batı Akdeniz Tarımsal Araştırma Enstitüsü Derim Dergisi, vol. 28(2), pp.42-54, 2011.
[10] M. Türkeri, “An investigation of determination for correlation and path analysis of yield and yield component in peanut (Arachis hypogaea L.)”,
Çukurova University Institute of Basic and Applied Sciences Agronomy Discipline, Graduate Thesis, Adana, Turkey, 2006.
[11] FAO, “Food and Agriculture Organization of the
United Nations”,
http://www.fao.org/faostat/en/#data/QC, 2017.
[12] TIS, Turkey Institute Statistics, https://biruni.tuik.gov.tr/medas/?kn=92&locale=tr, 2018.
[13] A. Sürücü, E. Boydak, A. R. Demirkiran and S. Yetim, “The effect of irrigation and nitrogen on mineral composition of peanut (Arachis hypogaea
L.) leaves”, Journal of Food, Agriculture and
Environment, vol. 11(3-4), pp.824-827, 2013.
[14]
K. Ravichandra, C. N. Jyothi, B. J. Sigh, J.
Dawson and A. Krupakar, “Growth of Groundnut (Arachis hypogaea L.) and its Yield as Influenced by Foliar Spray of Boron along with Rhizobium Inoculation”, Indian J. Dryland Agric. Res. and Dev. Vol. 30(1), pp.60-63, 2015.[15] D. Baributsa, I. B. Baoua, O. N. Bakoye, L. Amadou and L. L. Murdock, “PICS bags safely store unshelled and shelled groundnuts in Niger.”, Journal of Stored Products Research, vol. 72, pp.54-58, 2017.
[16] Md. Quamruzzaman, F. Md. Ullah, F. Md. Karim, N. Islam, J. Md. Rahman and D. Md. Sarkar, “Reproductive development of two groundnut cultivars as influenced by boron and light”, Information Processing in Agriculture, vol. 5, pp.289-293, 2018.
[17] A. Prakash, V. Vadivel, S. F. Banu, P. Nithyanand, C. Lalitha and P. Brindhad, “Evaluation of antioxidant and antimicrobial properties of solvent extracts of agro-food by-products (cashew nut shell, coconut shell and groundnut hull)” Agriculture and Natural Resources, vol. 52, pp.451-459, 2018
[18] D. C. Montgomery and E. A. Peck, “An Introduction to Linear Regression Analysis”, John Wiley Sons Inc., New York, 2006.
[19] C. Chen, “Robust Regression and Outlier Detection with the ROBUSTREG Procedure”, Statistics and Data Analysis, paper 265-27, SAS Institute Inc., Cary, NC., 2007.
[20] G. Dehnel, “Robust Regression in Monthly Business Survey”, Statistics in Transition new series, vol. 16(1), pp.137-152, 2015.
[21] Ö. G. Alma, “Comparison of Robust Regression Methods in Linear Regression”, Int. J. Contemp. Math. Sciences, vol. 6(9), pp. 409−421, 2011 [22] P. J. Rousseeuw and V. Yohai, “Robust
regression by means of S-estimators, W. H. J. Franke and D. Martin (Editors)”, Robust and Nonlinear Time Series Analysis, Springer-Verlag, New-York, 256−272, 1984.
[23] Y. Susanti, H. Pratiwi, H. Sulistijowati and T. Liana, “M Estimation, S Estimation, and MM Estimation in Robust Regression”, International Journal of Pure and Applied Mathematics, vol. 91(3), pp.349-360, 2014.
[24] Sajid, M., Rab, A., Wahid, F., Shah, S. N. M., Jan, I., Khan, M. A., Hussain, S.A., Khan, M. A., Iqbal, Z. 2010. Influence of rhizobium inoculation on growth and yield of groundnut cultivars. Sarhad J. Agric., 27(4): 573-576.
Vol. 5 Issue 3, March - 2019 groundnut in relation to seed size”, Environmental
and Experimental Biology, vol. 14, pp. 9-14, 2016
[26] B. Melese, N. Dechassa, “Seed yield of groundnut (Arachis Hypogaea L.) as influenced by phosphorus and manure application at Babile, Eastern Ethiopia”, International Journal of Advanced Biological and Biomedical Research, vol. 5(1), pp. 35–40, 2017.