ISSN 0000 ©2013 WEJ Journal
Comparing the relative efficiency of two
experimental designs in wheat field trials
Ashraf A. Abd El- Mohsen and Samir R. Abo-Hegazy
Agronomy Department, Faculty of Agriculture, Cairo University, El-Gamaa Street, P.O. Box12613 Giza, Egypt.
Corresponding author email: [email protected], [email protected].
ABSTRACT:This investigation was conducted in 2010/11 and 2011/12 growing seasons at the
experimental farm of the Faculty of Agriculture, Cairo University, Giza, Egypt. Twenty Egyptian bread wheat cultivars were evaluated in an alpha lattice design with three replications for nine characters. The aim was to compare the relative efficiency of two experimental designs based on error mean squares. In field trials, variation in soil fertility can result in substantial heterogeneity within blocks and thus, poor precision in treatment estimates resulted. For this purpose, two datasets were analyzed according to alpha lattice design and randomized complete blocks design (RCBD). For the two trials, alpha lattice design exhibited more efficient than randomized complete blocks design in reducing both the error mean squares and the coefficient of variation consequently, an efficient estimation of treatment differences, than RCBD. Average estimated relative efficiency (RE) was 9.5, 28.5, 30.0, 22.5, 40.0, 30.5, 35.0 and 28.5% for plant height, number of tillers plant-1, spike length, number of spikelets spike-1, number of grains spike-1, 1000-grain weight, 1000-grain yield plant-1 and grain yield feddan-1, respectively, indicating that the high precision to estimate treatment effects is gained significantly from using an alpha lattice design instead of RCBD. Whereas RE value of 0.98 for days to 50% heading indicated that the precision of both alpha lattice design and RCBD was similar. Mean rank comparisons for both RCBD and alpha lattice design were performed. The ranks were not constant across the experiments. The results showed that the traditional RCBD should be replaced by alpha lattice in the agricultural field trials when the number of treatments to be tested in an experiment increases to more than ten, where a homogeneous block is quite difficult to find in field experiments.
Key Words:Alpha Lattice Design, RCBD, Coefficient of Variation, Efficiency, Error Mean Squares, Relative Standard Error Difference, Wheat, Yield trials.
INTRODUCTION
A correct experimental design is as important as a correct statistical analysis in order to obtain valid and reliable conclusion from field experiments. Certain restrictions must be imposed when the plots are arranged in order to be able to accurately estimate the errors. The choices of experimental design as well as of statistical analysis are of huge importance in field experiments. These are necessary to be correctly in order to obtain the best possible precision of the results.
Wheat breeders and agronomists are faced a problem, how to select and evaluate the available experimental designs. The available literature of the efficiency of lattice designs relative to the randomized complete blocks design in wheat variety trials was very rare. The efficiency of one analysis over another is usually measured in terms of reduced error variance, expected error mean squares, or standard error of the difference between genotype means (Cochran and Cox, 1957, Binns 1987 and Magnussen 1990).
The randomized block, latin square, and other complete block types of experiments are inefficient for comparing large number of treatments, because of their failure to adequately minimize the effect of soil heterogeneity (Lentner and Bishop 1993). Also, when the number of factors and/or levels of the factors increase, the number of treatment combinations increase very rapidly and it is not possible to accommodate all these treatment combinations in a single homogeneous block.
102 number of genotypes is as large as sixteen in single block (Yang et al 2004). In field trials, variation in soil fertility can result in substantial heterogeneity within blocks and thus, poor precision in treatment estimates results (Idrees and Khan 2009).
The usual approach through local control by using replications is inefficient and a lot of research has recently been carried out, which suggest new methods of local control in field experiments (Williams 1986, Cullis and Gleeson 1991, Kempton et al 1994, Gleeson 1997 and Malhotra et al 2004). Alpha designs introduced by Patterson and Williams, (1976) are now routinely used for statutory field trials in the United Kingdom (Patterson and Silvey 1980) and are also widely used for breeding and varietals trials in Australia and elsewhere. They are more flexible than lattice designs and can accommodate any number of varieties. The use of these designs is recommended in variety trials involving large numbers of varieties when the trials are conducted on variable soil and when differences between the varieties are relatively small.
Due to the restriction on the number of genotypes that may be evaluated, there have been a number of proposed lattice type designs, the most popular being the alpha designs (Giesbrecht and Gumpertz 2004 and Hinkelman and Kempthorne 2006). Alpha designs allow us to construct resolvable incomplete block designs when the number of treatments (g) or block size (k) does not meet the strict requirements for one of the lattice designs. Alpha designs are resolvable incomplete block designs where the number of entries is a multiple of block size. Although these designs cannot achieve balance, they are used extensively in plant breeding primarily because they are quite flexible regarding the number of entries to be evaluated and the appropriate size of incomplete block and they allow for good error control. In addition, these designs can be simply adapted to situation where the number of entries is not an exact multiple of block size by omitting treatments from an alpha design with a larger number of treatments. Design generation is available by using the method given in Patterson and Williams (1976) or by using available software (Alpha+ of Williams and Talbot 1993, CycDesign 3.0 of Whitaker et al 2001 and Agrobase Software of Mulitze 2004).
Therefore, the purpose of this investigation was to compare the relative efficiency of alpha lattice design relative to randomized complete blocks design for yield and yield components in bread wheat cultivars.
MATERIALS AND METHODS
Experimental site and plant materials
This investigation was carried out at the experimental farm of the Faculty of Agriculture, Cairo University, at Giza, Egypt, during the two wheat successive growing seasons, 2010/2011 and 2011/2012. The experimental material comprised of twenty breed wheat (Triticum aestivum L.), cultivars from the Agricultural Research Center (ARC), Giza, Egypt, namely, Sids 1, Sids 4, Sids 6, Sids 12, Sids 13, Gemmeiza 3, Gemmeiza 5, Gemmeiza 7, Gemmeiza 9, Gimmeiza 10, Marute, Sakha 8, Sakha 69, Sakha 93, Sakha 94, Giza 157, Giza 164, Giza 168, Misr 1 and Misr 2. These cultivars were used as treatments and evaluated in the study.
Layout and experimental design
The experiment was laid out according to an alpha lattice design with incomplete blocks with three replications, 20 cultivars, 4 blocks within a replicate and 5 plots per block in each replication (Fig. 1). This arrangement of experimental units and blocks has been found to minimize variation within the block while maximizing variation among blocks. The randomization of 20 cultivars was done with Crop Stat v7.2.3 software (2007). The cultivars were planted in plots with six rows of 3.5 meter length and 20 cm apart and the distance between plants was 5 cm for each cultivar in each replication. The net experimental plot area was 4.2 m2 (1/1000 feddan).
Cultural practices
Cultivars were sown at the seed rate of 60 kg/fed and sowing dates were 10th and 17th of November in the two successive seasons, respectively. The plants were subjected to recommended package of agronomic and plant protection practices to obtain a healthy crop. Calcium super phosphate (15.5% P2O5) was applied
during soil preparation at the rate of 100 kg feddan-1 P2O5. Five irrigations were added during growth by
103
S. No.
Replication I Replication II Replication III
Block Cultivar name Block Cultivar name Block Cultivar name
1 2 3 4 5 1 1 1 1 1 Sakha 8 Sids 1 Gemmeiza 3 Sids 6 Misr 1 1 1 1 1 1 Sids 6 Giza 164 Gemmeiza 5 Sids 4 Sids 13 1 1 1 1 1 Misr 1 Marute Sakha 69 Gemmeiza 9 Giza 157 6 7 8 9 10 2 2 2 2 2 Sakha 69 Sids 4 Gemmeiza 5 Misr 2 Giza 157 2 2 2 2 2 Gemmeiza 10 Marute Sakha 8 Sids 12 Giza 168 2 2 2 2 2 Sids 12 Sakha 93 Gemmeiza 10
Sids 6 Sids 1 11 12 13 14 15 3 3 3 3 3 Sakha 93 Sids 12 Gemmeiza 7 Marute Giza 164 3 3 3 3 3 Gemmeiza 9 Sakha 93 Sids 1 Misr 2 Sakha 69 3 3 3 3 3 Sakha 94 Sids 13 Gemmeiza 5 Giza 168 Gemmeiza 3 16 17 18 19 20 4 4 4 4 4 Sakha 94 Sids 13 Gemmeiza 9 Giza 168 Gemmeiza 10 4 4 4 4 4 Gemmeiza 7 Sakha 94 Giza 157 Gemmeiza 3 Misr 1 4 4 4 4 4 Sakha 8 Misr 2 Gemmeiza 7 Giza 164 Sids 4
Fig 1. The lay out in the field of alpha lattice design with 20 treatments in 3 complete replications. The replications are divided into 4 blocks with 5 plots each.
Recording of observations
Data were recorded on days to 50% heading estimated on plot basis by visual observations. Observations were recorded on ten randomly selected plants from the two middle rows in each cultivar per replication for the following traits viz., plant height (cm), number of tillers plant-1, spike length (cm), number of spikelets spike-1, number of grains spike-1, 1000-grain weight (g) and grain yield plant-1 (g). At harvest one square meter was taken randomly from the middle area of each plot for the three replications to determine grain yield per square meter and then converted to grain yield in ardab per feddan (ardab=150 kg and 1 feddan= 4200 m2).
Statistical analysis and interpretation of data
In the data analysis, normalizing the data distribution as one of the primary assumptions was carried out by using SPSS (2009). Therefore, the normality of the data was evaluated using the Kolmogrov- Smirnov method. Also, data were tested for violation of assumptions underlying the analysis of variance.
The data in the two seasons were subjected to statistically analyzed according to the technique of analysis of variance (ANOVA) for the alpha lattice design developed by Patterson and Williams (1976) (Table 1).
Table 1. Form of analysis of variance for alpha lattice design
Source of variation Degrees of freedom Sum of
squares
Mean squares F
Replications r-1 SSr MSr
Blocks (within replications, ignoring treatments) rs-r SSb MSb
Treatments (adjusted for blocks) t-1 SSt MSt F0
Error rt-rs-t+1 SSe MSe
Total tr-1 SST
-The arrangement of treatments in alpha lattice into groups gave possibility the data analysis as a randomized complete block experiment.
The linear model of observations in alpha design is of the form:
104 where yijkdenotes the value of the observed trait for i-th treatment received in the k-th block within j-th
replicate (superblock), tiis the fixed effect of the i-th treatment (i = 1,2,…,t); rj is the effect of the j-th replicate
(superblock) (j = 1,2,…,r); bjkis the effect of the k-th incomplete block within the j-th replicate (k = 1,2,…s) and
eijk is an experimental error associated with the observation of the i-th treatment in the k-th incomplete block
within the j-th complete replicate.
For each dataset, coefficient of variation (CV), standard error (SE), mean square errors (MSE) and F-value were studied.
The error mean squares from each analysis were used to estimate the relative efficiency of an alpha lattice design compared with RCBD according to the following equation:
Relative efficiency =
x
100
design
lattice
alpha
in
squares
mean
Error
RCBD
in
squares
mean
Error
An estimated relative efficiency (ERE) less than 1 indicates that RCBD is a more efficient, while value nearly equal to 1 suggests that the two designs yield similar results. Value of ERE greater than 1 suggests that alpha lattice design is more efficient design than RCBD.
Unadjusted and adjusted cultivar means were computed and rankings compared for the randomized complete block (RCBD) and the alpha lattice designs.
All the statistical analyses were carried out through the computer software, SPSS (2009) and Agrobase Generation II (Mulitze 2004).
RESULTS AND DISCUSSION
Analysis of variance
Statistical analysis according to the technique of analysis of variance (ANOVA) for both successive seasons of alpha lattice design for studied traits are summarized in Tables 2 and 3. Based on the results obtained, statistical analysis revealed that the genotypes included in the study had highly significant variation (p≤ 0.01) for all traits under study. It could be concluded that varietal differences between wheat cultivars may be due to genetical differences between cultivars and indicating considerable amount of genetic variation present in these material. The varietal differences in growth, yield and yield components obtained in this study are in agreement with those obtained by Abd-Alla and Bassiouny (1994), Hassanein et al (1997), El-Habbasha (2001), Hassanein (2001), Zarea-Fizabady and Ghodsi (2004) and Sajjad et al (2011).
Efficiency of RCBD and alpha lattice design
As shown in Tables (4 and 5), statistical analysis of the data revealed that there is a great difference were detected between error mean squares (EMS) of alpha lattice design and error mean squares of RCBD. Moreover, the coefficients of variation (CV) of alpha lattice design were low as compared to RCBD for all studied traits except days to 50% flowering. Low value of CV indicates good index of reliability. These results are in agreement with those obtained by Gleeson and Cullis 1987, Cullis and Gleeson 1991, Kempton et al
1994, Masood et al 2006 and Idrees and khan 2009.
Data presented in Tables (4 and 5) show that there is a great differences between standard error of different traits under RCBD and standard error (SE) of the same traits under alpha lattice design. The smaller values of SE difference for alpha lattice design helps to detect smaller differences for the comparisons of mean. The effectiveness of the alpha lattice analysis at reducing experimental error was most evident in a portion of the trials for plant height, number of tillers plant-1, spike length, number of spikelets spike-1, number of grains spike-1, 1000-grain weight, grain yield plant-1 and grain yield feddan-1. Overall, alpha lattice analysis reduced experimental error for yield and yield component traits compared to the RCBD. Thus, it is possible to detect smaller significant differences between treatment means by using alpha lattice design. Alana and Guzman (2003) reported that alpha lattice appears to detect genotypic differences better than RCBD and may maximize accuracy in comparing and selecting genotypes.
105
Parameter
Error mean squares (EMS) Coefficient of variation (CV) Standard error (SE)
Experimental Design
RCBD Alpha RCBD Alpha RCBD Alpha
Days to (50%) heading 20.11 20.69 6.15 6.28 4.03 4.33
Plant height (cm) 42.35 38.15 8.56 6.24 6.55 5.23
No of tillers plant-1 35.20 31.20 7.13 6.25 5.22 3.74
Spike length (cm) 0.92 0.66 2.15 1.95 0.91 0.64
No of spikelets spike-1 0.97 0.74 5.90 4.68 2.78 1.56
No of grains spike-1 1.75 1.21 7.26 5.33 3.45 2.47
1000-grain weight (g) 8.7 6.25 4.56 3.62 1.09 0.94
Grain yield plant-1 (g) 13.98 10.15 7.89 5.75 3.20 2.88
Grain yield feddan-1 (ardab) 23.17 18.26 8.78 7.23 6.45 5.19
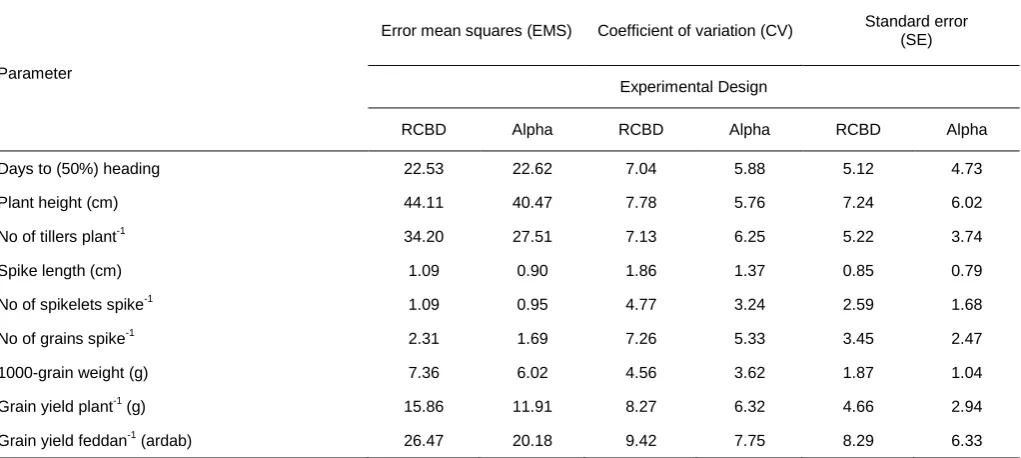
Table 5. Estimates of error mean squares, coefficient of variation and standard error of alpha lattice design vs RCBD, during 2011/2012.
Parameter
Error mean squares (EMS) Coefficient of variation (CV) Standard error (SE)
Experimental Design
RCBD Alpha RCBD Alpha RCBD Alpha
Days to (50%) heading 22.53 22.62 7.04 5.88 5.12 4.73
Plant height (cm) 44.11 40.47 7.78 5.76 7.24 6.02
No of tillers plant-1 34.20 27.51 7.13 6.25 5.22 3.74
Spike length (cm) 1.09 0.90 1.86 1.37 0.85 0.79
No of spikelets spike-1 1.09 0.95 4.77 3.24 2.59 1.68
No of grains spike-1 2.31 1.69 7.26 5.33 3.45 2.47
1000-grain weight (g) 7.36 6.02 4.56 3.62 1.87 1.04
Grain yield plant-1 (g) 15.86 11.91 8.27 6.32 4.66 2.94
Grain yield feddan-1 (ardab) 26.47 20.18 9.42 7.75 8.29 6.33
In both seasons, it can be concluded that the alpha lattice analysis was more efficient than the randomized complete block design at analyzing the eight traits of interest in this study (Tables 4 and 5). Detection of significant field trends using alpha lattice analysis supports the notion that unaccounted field heterogeneity often exists within a complete block of the RCB design. Then it is suggested to apply an alpha lattice design which is, if appropriately adopted, always efficient than complete block design.
Based on values of standard error (Tables 4 and 5) for grain yield feddan-1, the average standard error of the two trials for treatments in the RCBD analysis is 7.37 with 38 degrees of freedom. In the alpha lattice analysis, this was reduced to 5.76 with 29 degrees of freedom, a 22% reduction in treatment standard errors. The actual size of the reduction in standard error depends upon the amount of variation attributable to the blocking variable; the larger variation, the larger reduction in standard error.
106 Fisher (1926) in his first paper on field experimental designs emphasized the importance of randomized arrangements in the estimation of experimental error and described the randomized complete block (RCB) and latin square designs. However, in some situations, efficiency of the RCB design is not high. The problem with complete blocking is that as the block size increases due to the increase in the number of treatments, the homogeneity of experimental plots within a large block is difficult to maintain and thus local control of experimental variability becomes inefficient (Stroup et al 1994).
Many researchers reported that alpha lattice design is better than RCBD in providing smaller standard error of difference, coefficient of variation and error mean squares when the number of entries in the experiment is large (Wu and Dutilleul 1999, Campbell and Bauer 2007 and Masood et al 2008).
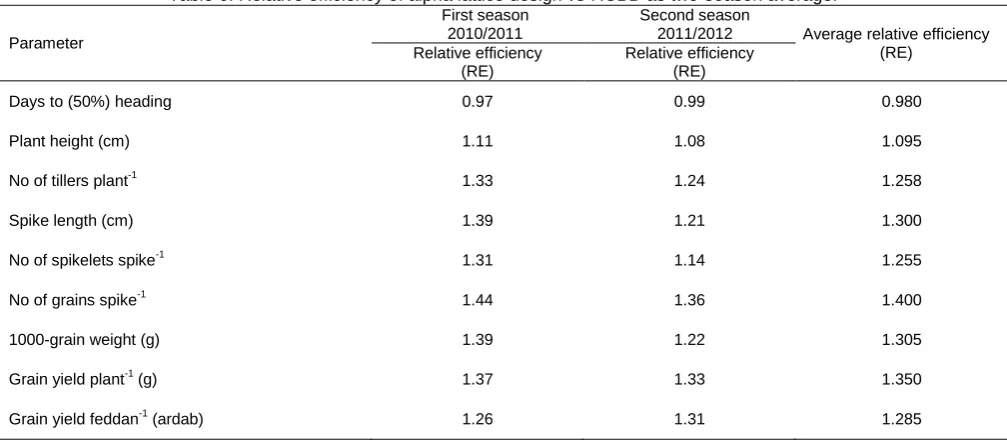
The results in Table (6) present a summary of the RCBD and alpha lattice design relative efficiencies calculated for yield and yield component traits. The value of relative efficiency greater than one shows that alpha lattice design was more efficient than randomized complete blocks design. To compare the amount of information provided by two experimental designs, one can look at the relative efficiency (RE). The relative efficiency indicates how much more efficient the alpha lattice design is as compared to RCBD, if the value of relative efficiency is greater than one then the alpha lattice results in a smaller error variance and it adjusts cultivar means for block effects. In addition to that the relative efficiency is less than one; the alpha lattice design is less efficient than the RCBD. In this case, the trail is analysed as RCBD and means are not adjusted for block effects.
Based on the results of relative precision, an alpha lattice analysis was more efficient than the randomized complete block design in both seasons at analyzing the eight traits of interest in this study (Table 6). Gains of precision ranged from 1.10 (Days to 50% heading) to 1.44 (No. of grains spike-1) in 2010-2011 season and from 1.08 (Plant height) to 1.36 (No. of grains spike-1) in 2011/2012 season.
For the 2010-2011 trial, the value of relative efficiency greater than one shows that alpha lattice design was more efficient than randomized complete blocks design (Table 4). Relative efficiency indicates that the use of alpha lattice design instead of RCBD increased experimental precision by 11, 33, 39, 31, 44, 39, 37 and 26% for plant height, number of tillers plant-1, spike length, number of spikelets spike-1, number of grains spike-1, 1000-grain weight, grain yield plant-1 and grain yield feddan-1, respectively (Table 4). The results indicated that enough variation existed in replications to justify the use of alpha lattice design. Also, for the 2011/2012 trial, gains in precision for earlier mentioned traits were 8, 24, 21, 14, 36, 22, 33 and 31%, respectively (Table 6).
Table 6. Relative efficiency of alpha lattice design vs RCBD as two-season average.
Parameter
First season 2010/2011
Second season
2011/2012 Average relative efficiency (RE)
Relative efficiency (RE)
Relative efficiency (RE)
Days to (50%) heading 0.97 0.99 0.980
Plant height (cm) 1.11 1.08 1.095
No of tillers plant-1 1.33 1.24 1.258
Spike length (cm) 1.39 1.21 1.300
No of spikelets spike-1 1.31 1.14 1.255
No of grains spike-1 1.44 1.36 1.400
1000-grain weight (g) 1.39 1.22 1.305
Grain yield plant-1 (g) 1.37 1.33 1.350
Grain yield feddan-1 (ardab) 1.26 1.31 1.285
107
Table 2. Mean squares of the 9 traits of bread wheat for 2010/2011 season
SOV df Days to
50% heading
Plant height
(cm)
No of tillers
plant-1 length Spike
(cm)
No of spikelets
spike-1
No of grains spike-1
1000-grain weight
(g)
Grain yield plant-1 (g)
Grain yield feddan-1
(ardab)
Replications 2 56.37ns 145.36* 120.21* 5.83** 6.81** 8.01** 37.77** 77.26** 88.86*
Blocks 9 30.22ns 90.45* 75.45* 3.85** 4.22** 4.56** 25.45** 43.45** 54.23*
Genotypes 19 215.49** 373.25** 1278.98** 8.07** 5.58** 9.45** 78.31** 88.21** 345.12**
Error 29 20.69 38.15 31.20 0.66 0.74 1.21 6.25 10.15 18.26
** = Significant at 1% level. * = Significant at 5% level. ns = Non-Significant
Table 3. Mean squares of the 9 traits of bread wheat for 2011/2012 season
SOV df Days to
(50%) heading
Plant height
(cm)
No of tillers
plant-1 length Spike
(cm)
No of spikelets
spike-1
No of grains spike-1
1000-grain weight
(g)
Grain yield plant-1 (g)
Grain yield feddan-1
(ardab)
Replications 2 44.29ns 167.33* 154.36** 4.02* 6.14** 7.25* 53.22** 66.80** 80.25*
Blocks 9 16.71ns 95.64* 68.75* 2.95** 3.66** 5.49** 31.74** 44.57** 67.62**
Genotypes 19 224.33** 365.98** 1245.32** 7.26** 5.09** 11.45** 86.32** 60.34** 315.49**
Error 29 22.62 40.47 27.51 0.90 0.95 1.69 6.02 11.91 20.18
** = Significant at 1% level. * = Significant at 5% level. ns = Non-Significant
Table 7. Rank changes of mean grain yield (ardab/fed) values under RCBD and alpha lattice during 2010/2011 and 2011/2012 seasons.
S. No. Cultivar
2010/2011 2011/2012
Unadjusted means of RCBD Rank
Adjusted means of alpha lattice Rank
Unadjusted means
of RCBD Rank
Adjusted means of alpha lattice Rank
1 Sakha 8 18.56 16 18.61 15 18.02 18 18.25 18
2 Sids 1 20.71 5 20.82 6 22.89 3 22.36 6
3 Gemmeiza 3 18.90 13 18.80 13 18.45 15 18.37 17
4 Giza 168 20.37 8 20.44 8 20.78 10 19.66 12
5 Misr 1 22.50 3 22.35 3 22.56 5 22.74 4
6 Sakha 69 17.63 18 17.43 18 18.25 16 18.52 15
7 Sids 4 16.56 20 16.65 20 21.23 9 21.49 8
8 Gemmeiza 5 18.66 14 18.71 14 17.89 19 17.75 19
9 Misr 2 22.58 2 22.21 4 23.31 1 23.17 2
10 Giza 157 17.38 19 17.30 19 17.23 20 17.02 20
11 Sakha 93 19.36 12 19.45 9 20.35 11 20.48 11
12 Sids 12 22.41 4 22.65 2 22.85 4 22.44 5
13 Gemmeiza 7 19.59 9 19.36 11 19.23 13 20.51 10
14 Marute 20.67 6 20.85 5 21.45 8 21.38 9
15 Giza 164 18.64 15 18.51 16 18.90 14 18.42 16
16 Sakha 94 17.67 17 17.78 17 19.78 12 19.54 13
17 Sids 13 23.27 1 23.57 1 23.12 2 23.45 1
18 Gemmeiza 9 19.55 11 19.37 10 22.05 7 22.22 7
19 Sids 6 19.56 10 19.35 12 18.09 17 17.94 19
20 Gemmeiza 10 20.41 7 20.70 7 22.45 6 22.76 3
Many researchers (Patterson and Hunter 1983, Pilarczyk 1991, Masood et al 2006, Masood et al 2008 and Kashif et al 2011) have used alpha lattice design in field trials. They concluded that alpha lattice design is more efficient than RCBD and have potential to replace RCBD in regional and international trials.
According to the means of two seasons (Table 6), average efficiencies of the two trials indicates that the use of alpha lattice design instead of RCBD increased experimental precision by 9.5, 28.5, 30.0, 22.5, 40.0, 30.5, 35.0 and 28.5% for (plant height, number of tillers plant-1, spike length , number of spikelets spike-1, number of grains spike-1, 1000-grain weight, grain yield plant-1 and grain yield feddan-1, respectively (Table 6). Finally, the results indicated that enough variation existed in replications to justify the use of alpha lattice design.
108 obtained in trials with fewer than 20 varieties. They represent an average efficiency of 1.43 over all 244 trials. Masood et al (2006 and 2007) compared efficiency of alpha lattice design. Their results indicated that alpha lattice design improved the efficiency by 9 and 14 percent as compared to RCBD in their studies. Yau (1997) reported the use of alpha lattice design in international yield trials of different crops and found that its average efficiency was 18 % higher than the RCBD. Masood et al (2008) reported that the use of alpha lattice design instead of RCBD increased experimental precision by 24 and 46 percent in wheat and potato, respectively.
Mean comparisons of randomized complete block and alpha lattice designs
The cultivar means of grain yield (ardab/fed) using the two models of analysis were estimated for both seasons shown in (Table 7). Also, the ranks of the 20 yielding cultivars resulted from the statistically preferred model (alpha lattice analysis).
In 2010/2011 season, cultivars Sids 13, Sids 12, Misr 1, Misr 2, Marute and Sids 1 produced the highest grain yield recording 23.57, 22.65, 22.35, 22.21, 20.85 and 20.82 (ardab/fed), respectively. In the second season, cultivar Sids 13, gave the highest grain yield followed by Misr 2, Gemmeiza 1, Misr 1, Sids 12 and Sids 1 recording 23.45, 23.17, 22.76, 22.74, 22.44 and 22.36 (ardab/fed), respectively. The differences between the ranks of the best cultivars through both seasons may be attributed to the effect of environmental factors and their interactions with cultivars. These results are in accordance with Abdelkareem and Ahmed (2003) and Hager (2012).
As regards, comparing means estimated from the RCBD and alpha lattice analyses indicates that cultivar rankings can differ amongst the two analyses (Table 7). According to mean values obtained from a two-season trial, differences in cultivar ranks between the RCBD and alpha lattice analyses present a challenge in selecting the best performing cultivars for a specific trait. The rank values of cultivars within trials vary considerably from season to the other. Cultivar rankings were influenced by the degree of precision for individual wheat cultivar trials.
The rank order of means based on alpha design and RCBD also change, which is relevant when selecting genotypes for the purpose of recommendations for the farmers. The effect is illustrated in Table 7 for trial 1, where the four significant rank changes were observed when ordering 20 cultivars according to their yield performance. The treatment mean ranks differences were detected in the cultivars 9, 11, 12, 13 and 19. Similarly several shuffling in ranks of different cultivars have been observed for trial 2 (Table 7), e.g. cultivar number 2 ranked at number three under RCBD moved down and attained a lower rank place of 6 under alpha lattice with an downward adjustment of 0.53 ardab/fed, while variety number thirteen moved from rank number 13 under RCBD to rank number 10 under alpha lattice. The observed inconsistency in ranking and reduction in error mean squares under alpha lattice design suggested that alpha lattice design appears better to detect genotypic differences than the RCBD and will therefore improve the efficiency of field trials. Alana and Guzman (2003) on corn detected significant positive rank correlation between the rank of hybrids in the unadjusted (i.e., RCBD) and adjusted means (i.e., alpha lattice) but inconsistencies in rank were observed. Kashif et al (2011) on rice reported that the ranks were not constant across the experiments.
CONCLUSION
The present investigation provided considerable information useful in variety trials involving large number of cultivars of bread wheat; also this study highlights the efficiency of alpha lattice design. This study illustrates that cultivar means calculated from RCBD and alpha lattice analyses sometimes differ in rank for both yield and yield components traits. In general, the results of this study showed that the alpha lattice design provided smaller standard errors of differences, coefficients of variation and error mean squares as compared to RCBD providing efficiency in comparing different cultivars. Therefore this design should be employed while conducting field research trials on different crops in Egypt when number of cultivars in the experiments is large. There is also a need to extend experimentation to more research stations for wider applicability of these designs for this crop and for some other crops too. For plant breeding and selection trials, alpha lattice design should be used in such a way that they form a resolvable incomplete block design so that the results could improvement precision of agricultural field trials. Finally, the data obtained from this study could be useful for wheat breeders and agronomists in order to recommend the use of alpha lattice design to improve the precision of wheat performance trials.
REFERENCES
Abd-Alla MM, Bassiouny AH. 1994. Response of two wheat cultivars to various planting densities. Egypt. J. Appl. Sci., 9: 836-849. Abdelkareem AA, Ahmed KZ. 2003. Somaclonal variation in bread wheat (Triticum aestivum L.). 2. Comparative field performance of
109
Alana MA, Guzman PS. 2003. Handling soil variability in high - N and zero-N field trials of corn genotypes. Philip. Agri. Scientist. 86 (2): 123-130.
Binns MR.1987. Practical use of neighbor methods and alternatives in the analysis of field trials. Can. J. Plant Sci. 67: 477-489.
Campbell BT, Bauer PJ.2007. Improving the precision of cotton performance trials conducted on highly variable soils of the southeastern USA Coastal Plain. Plant Breed.,126: 622–627.
Cochran WG, Cox GM. 1957. Experimental Design, 2nd Edition (John Wiley and Sons, New York.
Cullis BR, Gleeson AC.1991. Spatial analysis of field experiments-an extension to two dimensions. Biometrics. 47:1449-1460.
El-Habbasha El-S F. 2001. Effect of nitrogen fertilization on yield of some newly released wheat varieties under different seed rate treatments. M. Sc. Thesis, Fac. Agric. Ain Shams Univ., Egypt.
Fisher RA. 1926. The arrangement of field experiments. J. Ministry Agric., 33: 503-513.
Giesbrecht FG, Gumpertz ML. 2004. Planning, Construction, and Statistical Analysis of Comparative Experiments. Wiley. New York. Gleeson AC. 1997. Spatial Analysis. In Kempton, R.A. and P.N. Fox (eds) Statistical Methods for Plant Variety Evaluation. Chapman and
Hall, London.
Gleeson AC, Cullis BR. 1987. Residual maximum likelihood estimation of a neighbour model for field experiments. Biometrics, 43: 277-288. Hager MA.2012. Using trend analysis models to improve efficiency of wheat (Triticum aestivum L.) variety trials. Bull. Fac. Agric., Cairo
Univ., 63: 252-260.
Hassanein MS.2001. Effect of variety and nitrogen levels on growth, yield and yield components of wheat (Triticum aestivum L.) in newly cultivated land. Egypt. J. Agron., 23: 111-131.
Hassanein MS, Ahmed MA, El-Hariri DM. 1997. Response of some wheat cultivars to different nitrogen sources. J. Agric. Sci., Mansoura Univ., 22: 245-256.
Hinkelman K, Kempthorne O.2006. Design and Analysis of Experiments. Volumes 1 and 2. Wiley., New York.
Idrees N, Khan MI. 2009. Design improvement using uniformity trials experimental data. Pak. J. Agri. Sci., 46 (4): 315-320.
Kashif M, Khanb MI, Arifb M, Anwerc M, Ijazc M.2011. Efficiency of alpha lattice design in rice field trials in Pakistan. J. Sci. Res. 3 (1): 91-95.
Kempton RA, Seraphin JC, Sword AM.1994. Statistical analysis of two dimensional variations in variety yield trials. J. Agric. Sci. Cambridge 122: 335-342.
Lentner M, Bishop T. 1993.Experimental Design and Analysis (Second Edition). Valley Book Company, Blacksburg, Virginia.
Magnussen S. 1990. Application and comparison of spatial models in analyzing tree- genetics field trials. Can. J. Forest Res. 20: 536-546. Malhotra RS, Singh M, Erskine W.2004. Application of spatial variability models in enhancing precision and efficiency of selection in
chickpea trials. J. Ind. Soc. Ag. Statistics 57 (Special Volume): 71-83.
Masood MA, Farooq K, Mujahid Y, Anwar MZ.2008. Improvement in precision of agricultural field experiments through design and analysis. Pakistan J. Life Soc. Sci., 6: 89–91.
Masood MA, Malik SN, Nazakat N. 2007. Blocks within replication improve experimental efficiency in preliminary yield trial on groundnut. Pakistan J. of Agric. Res., 20 (3-4):116-118.
Masood MA, Mujahid Y, Khan MI, Abid S.2006. Improving precision of agricultural field experiments. J. of Sust. Develop., 3 (1, 2):11-13. Mulitze DK.2004. Agrobase Generation II. User’s Manual. Agronomix Software Inc. Winnepeg MB. http://www.agriconnection.com/id 24.htm Patterson HD, Hunter EA.1983. The efficiency of incomplete block designs in national list and recommended list cereal variety trials. J.
Agric. Sci., Camb. 101(2): 427-433.
Patterson HD, Williams ER.1976. A new class of resolvable incomplete block designs. Biometrika. 63: 83-90.
Patterson HD, Silvey V.1980. Statutory and recommended list trials of crop varieties in the United Kingdom. J. Royal Stat. Soc., A 143, 219–252.
Pilarczyk W.1991. The efficiency of α-designs in Polish variety testing field trials, Plant Varieties and Seeds 4: 37-41.
Sajjad M, Khan SH, Khan AS.2011. Exploitation of germplasm for grain yield improvement in spring wheat (Triticum aestivum). Int. J. Agric. Biol., 13 (5): 695–700.
Stroup WW, Baenziger PS, Multize DK.1994. Removing spatial variation from wheat yield trials: a comparison of methods. Crop Sci., 86: 62-66.
SPSS.2009. SPSS for Windows, version 17.0. SPSS Inc., Chicago, USA.
Whitaker D, Williams ER, John JA.2001. CycDesigN: A package for the computer generation of experimental designs. CSIRO Forestry and Forest Products, CSIRO, Canberra
Williams ER.1986. Row-column designs with contiguous replicates. Aust. J. Stat. 28: 154-163. Williams ER, Talbot M. 1993. Alpha+, Experimental Designs for Variety Trials. CSIRO, Canberra.
Wu T, Dutilleul P.1999. Validity and efficiency of neighbor analyses in comparison with classical complete and incomplete block analyses of field experiments. Agron. J. 91: 721–731.
Zarea-Fizabady A, Ghodsi M. 2004. Evaluation of yield and yield components of facultative and winter bread wheat genotypes (Triticum
aestivum L.) under different irrigation regimes in Khorasam Province in Iran. Journal of Agronomy 3 (3): 184-187
Yang R, Terrance ZY, Stanford SB, Manjula B.2004. Efficiency of spatial analyses of field pea variety trials. Crop Sci. 44(1): 49-55. Yau SK.1997. Efficiency of alpha-lattice designs in international variety yield trials of barley and wheat. J. of Agric. Sci., Cambridge 128: