678
ON THE RESULTS OF USING
INTERACTIVE EDUCATION METHODS IN
TEACHING PROBABILITY THEORY
Natalia M. Mezhennaya, Oleg V. Pugachev Bauman Moscow State Technical University, Russia E-mail: [email protected], [email protected]
Abstract
The impact of a complex of interactive computer algebra system (CAS) based methods with usage of supplementary education materials (e.g., interactive presentations, computer modeling patterns and supplementary home tasks prepared in CAS Mathematica) on the education outcomes in the subject “Probability theory and mathematical statistics” was estimated. A comparative analysis of education outcomes for two groups of third-year students of engineering specialization taught in Bauman Moscow State Technical University was carried out. Group I of 72 students was taught in the year 2016-17 using teaching methods including only lectures and seminars, without usage of supplementary interactive materials. A written control work was chosen as a tool of examination; its results were used as a means of assessment of education outcomes achieved by the students in the first module “Probability theory” of the semester course. The results demonstrated by Group I proved not to be satisfactory for achieving the aims of education: successful continuation of learning the next modules, and further usage in professional practice. After detailed analysis of the students’ works and interviewing them, the basic difficulties in understanding and interpretation of the tasks were clarified. Consequently, Group II of 70 students taught in the year 2017-18 in the same specialization as Group I, was provided with new variants of home tasks and supplementary sets of interactive materials to study on lectures and seminars, as well as for independent study at home. The students of Group II have demonstrated significantly higher outcomes as compared to the students of Group I.
Key words: CAS – computer algebra system, CAS Mathematica, education outcomes, education statistics, mathematical education, probability theory, teaching methods.
Introduction
The modern level of development of science and technology and market demands require new methods of education, in order to provide the applied direction of education, improvement of self-education and self-development skills, and zero gravity thinking (Sezonova, Galchenko, & Khodirevskaya, 2016). Students must learn to apply the achieved skills for independent construction of mathematical models of natural phenomena. For this sake, they need the experience of purposeful searching and systematization of information, comparison of various sources of information, logical construction of reasoning, and the skill of making adequate conclusions from the results obtained, so that they correspond to actual market situations (Lai & Savage, 2013).
Vol. 76, No. 5, 2018 679
Calculus, Analytical Geometry, Linear Algebra, Differential Equations, and Calculus of Complex Variables.
Since probability theory is axiomatic, the ideologies of probabilistic subjects strongly differ from other subjects of the mathematical circle such as calculus or differential equations etc. (Vlasova, Mezhennaya, Popov, & Pugachev, 2017a). Therefore, their education methods also significantly differ from other STEM-subjects (STEM – science, technology, engineering, and mathematics) (Griffith, Adams, Gu, Hart, & Nichols-Whitehead, 2012).
In solution of applied problems, students must demonstrate the work of general abstract principles in specific applied cases (Сalder, 2012). In learning probabilistic subjects, one often meets difficulties concerned with bulky formulas, huge data volumes, and “bad” numbers at the analysis of natural phenomena (Emmioğlu & Capa-Aydin, 2012; Griffith et al., 2012; Holmes, 2003). Moreover, the important aspect which should be taken in account in the choice of education strategy, is that possibly students have not been sufficiently trained in mathematical subjects in general (Morán-Soto & Benson, 2018). For instance, students of technical specializations do not study mathematical logics, although it is basic to understand what an axiomatic theory is. New methods of education intend to get over these difficulties, as well as to visualize the schemes and phenomena under consideration (Kendal & Stacey, 2002). That is why it is necessary to possess computer methods of data analysis. For solution of problems, one can use personal computers (Wiest, 2008), smartphones, or tablets (Harrison & Lee, 2018) with special program complexes installed. According to (Harrison & Lee, 2018), the choice of a certain technique should be in equal degrees motivated by availability of certain material resources and the expected education outcomes. The usage of numerical technologies essentially helps the process of education, as well as apprehension of the subject studied and its laws (Thomas, 2006).
It should be noted that the study of program languages is quite difficult for the students who have not studied them earlier, and requires a big amount of time (Broley, Caron, & Saint-Aubin, 2018). Moreover, the wide variety of program languages makes it difficult to provide knowledge of one certain language for a large collective of students consisting of groups of different specializations. Using CAS – computer algebra systems, such as Mathematica, MATLAB, MathCad and others, is more acceptable. They enjoy convenient interfaces, and the manners of presentation of mathematical expressions are similar to traditional mathematical form (Vlasova, Mezhennaya, Popov, & Pugachev, 2017b). The basic principles and methods of education with these techniques are presented in (Garner, 2004; Kramarski, & Hirsch, 2003).
Development of on-line education and intensive penetration of computer technologies in the process of education have a bilateral effect: they allow to stronger involve students to the process of education and to individualize it, and in the same time to obtain the data about the students’ successes (Barba, Kennedy, & Ainley, 2016). Peculiarities of study of the course of data analysis with active inclusion of computer technologies (extra-curricular possibility to access the virtual education environment, the special forum for collective on-line discussions on the problems occurring within independent work, access to supplementary materials on the server) are described in (Ivaniushina, Alexandrov, & Musabirov, 2016).
The didactic aspects of applying the CAS Mathematica in the study of the course of Discrete Mathematics, basic advantages of this system, possible difficulties in realization of the described methods and the ways of getting over these difficulties are discussed in (Ivanov, Ivanova, & Saltan, 2017). Problems of the same kind in concern with studying the subjects of the probabilistic course should also be explored. The current research deals with new CAS-based education technologies such as interactive presentations and patterns for computer modeling and explores its impact on the students’ education outcomes in probability theory.
Vol. 76, No. 5, 2018
680 of CAS is the possibility to create patterns of solution for some types of problems. If one changes the input data of a problem, the patterns generate complete solutions with changing intermediate and final results in a form of analytical dependences or in a graphical form. Such patterns and methodic advantages of their usage have been considered (Fisher, 2014; Rose & Smith, 2000), see also the monography (Abell & Braselton, 2009). To achieve the aims described, it is possible to use popular spreadsheets (Mendoza & Stafford, 2001; Soper & Lee, 1985), which are often used by students of medical, economical and sociological specializations (Nuriakhmetov, 2012). Moreover, for students of economical specialization, it is worthwhile to use special packages for statistical analysis (SPSS, SAS, Statistica, and others).
The teaching package of a subject (Vlasova et al., 2017a) usually consists of the materials of the lecture course and seminar studies, of variants of home tasks and control works for one or several teaching modules, and of supplementary teaching materials depending on the specific and direction of the course. The subject “Probability Theory and Mathematical Statistics” consists of three parts called modules, the first module “Probability Theory” is considered. Its successful mastering is basic for the study of the other modules, as well as for further branches of a professional course and application of obtained knowledge by the students in their future engineering practice. For successful passing the examination on the first module, it is necessary to fulfill the individual home task and the control work. In the 2016-17 year on lectures and seminars students were trained using a set of presentations illustrating the foundations and principles of the sample method. However, it turned out that it was not sufficient. The students taught in the year 2016-2017 demonstrated results of the first module control work, which were not sufficient for studying the second and the third modules. Basing on the analysis of the students’ works and the mistakes done, the supplementary CAS-based teaching materials including interactive presentations and patterns for computer modeling, and an improved set of home tasks purposed to a more profound study of certain topics have been elaborated. The study in the 2017-18 year has used these materials.
The aim of this research was to evaluate the effect of usage of interactive CAS-based education methods (interactive presentations, patterns for computer modeling, an improved set of home tasks purposed to a more profound study of certain topics) on the education outcome achieved by students. Examples of the mentioned supplementary materials are given in the Appendix.
Methodology of Research
General Background
This research deals with analysis of advantages of CAS-based education methods and its impact on education outcomes in the course of probability theory. The students taught in the year 2016-17 have demonstrated not sufficiently high results of the first module control work. Their works and mistakes were analyzed. Basing on the results of this analysis, a complex of materials, including new variants of home tasks, an additional set of interactive materials for lecture and seminar study, and for independent homework, has been elaborated. Usage of the new teaching materials enabled the students taught in the year 2017-18 to demonstrate significantly higher outcomes. Results of this work can be used as a basis for further elaboration and refinement of education methods in mathematical subjects for students of engineering specializations.
Vol. 76, No. 5, 2018 681
Sample of Research
The research embraced third-year students of engineering specialization taught on the faculty of Special Machine-building of BMSTU – Bauman Moscow State Technical University, taught in the years 2016-17 and 2017-18, studying the subject “Probability Theory and Mathematical Statistics”. Group I consisted of 72 students (29 female and 43 male students) taught in the year 2016-17, Group II consisted of 70 students (18 female and 52 male students) taught in the year 2017-18. For both groups the minimal age was 19; the maximal age was 23 for Group I and 24 for Group II. The mean age was 20.18 with a standard deviation of 0.94 for Group I, 20.07 with a standard deviation of 1.05 for Group II. Such distribution of gender and age is typical for third-year students of engineering specialization. Both groups of students carried out the control work No1 on the 8-th week of the semester in the years 2016-17 and 2017-18, respectively. The research included only the data of the students present on the control work hours and did not include the data of those who have carried out the control work later, to except a possibility of cribbing. All data about students and their education outcomes were presented in impersonal form. The results obtained in the two groups of students were compared and analyzed.
Instrument and Procedures
The instrument used in the research was a written control work consisting of three tasks in each of the 15 variants, the topics of the tasks were:
A. Calculating the probability of random events, B. Discrete random values and their parameters, C. Continuous random values and their parameters.
The variants of the control work were preliminarily prepared by two specialists in mathematical education and endowed with analytic solutions, including those using interactive computer systems Mathematica and Mathcad. In addition, the variants were validated by two independent experts who established that the variants are suitable for evaluation of knowledge of the first module, contain no ambiguities or mistakes, and the variants were declared eligible to be used for obtaining research data. See an example of a variant in Table 1. All works were checked by two teachers who had not hold studies in the groups I and II and were not familiar with the students. The personal data of the students were ciphered.
Table 1. Example of a variant of the control work.
Task
No. Task Statement
1 On a line segment of unit length, two random points are set. Find the probability that length of some part of the segment is more than 1/2.
2 The target consists of three parts I, II, III, the probabilities of hitting them are 0.2; 0.4; 0.4 respectively. Hit-ting part I gives 10 points, part II gives 5, part III gives 0. Find the distribution law of the sum of points won by 3 shots; calculate its expectation and dispersion. The shots are independent of each other.
3 Area of a circle has the uniform distribution on the interval (0; 9p). Find the density of distribution and the function of distribution of the circle’s radius. Calculate its expectation and dispersion.
Vol. 76, No. 5, 2018
682 The students of Group I, taught in the year 2016-17, had studied the first module for 7 weeks; lectures and seminar studies were held, including presentations on certain topics, but without interactive studies including computer modeling. On the topic C, the students demonstrated not sufficiently high results. That is why the teaching materials were corrected.
The students of Group II, taught in the year 2017-18, had studied the first module for 7 weeks as well. Side by side with the same studies as in Group I, they studied supplementary presentations on the topic “Functions of random values”, solved a supplementary task within the homework, and took part in a computer modeling using patterns prepared with Mathematica. Examples of supplementary presentations and tasks are presented in Appendix. Moreover, one of the patterns included a solution of a home task.
Data Analysis
On the first stage of research (in the year 2016-17) the results of the control work of 72 students of Group I were analyzed. The results achieved in all topics are presented in Table 2. The topic “Continuous random values” turned out to be the most difficult for the students. That is why the tasks on this topic are separated into two classes: a) calculating parameters of random values; b) calculating distributions and parameters of functions of random values. Analysis of the students’ successes in each class of tasks separately was performed. It turned out that the tasks of the topic b were not solved satisfactorily (see Table 2). The results achieved in the topics A and B are satisfactory for learning the subsequent modules of the course (60% of the students have fulfilled these topics), nevertheless, further improvement of education methods in order to obtain higher results is necessary. In the topic С, the situation is worse – only 50% of the students have solved the task. Therefore, it is necessary to analyze the causes of bad mastering of this topic. Table 2 shows that the task on the topic C.a has been done by 60% (27) students vs. 33% (9) on the topic C.b. Therefore, the topic C.b was done twice worse, than all the other topics.
Table 2. Numbers of the students of Group I, having successfully solved the tasks on each topic.
Topic A B C C.a C.b
Number of students having successfully solved the task on the topic 43 43 36 27 9 Total number of students doing the task 72 72 72 45 27
Vol. 76, No. 5, 2018 683
Results of Research
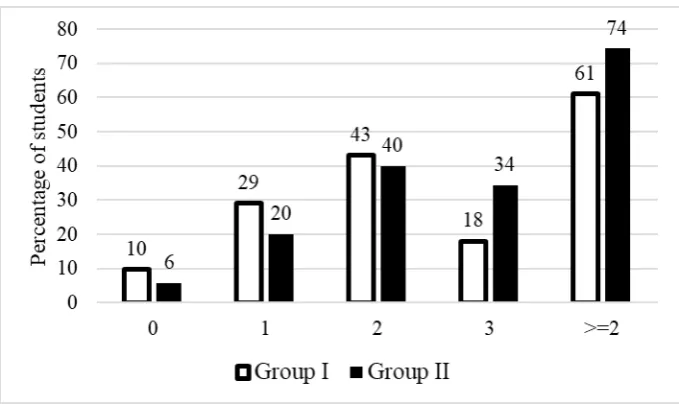
Figure 1 presents the results of the control work achieved by the students of both groups. Figure 2 shows the percentages of tasks solved in each topic.
Figure 1. Distributions of points for control work in each group.
Figure 2. Percentages of task A, B, C, and separately С.a, С.b, solved in each group.
Vol. 76, No. 5, 2018
684 better results (as compared to Group I) in all topics (Figure 2), especially on the topic С.b (33% vs. 59%).
Table 3 presents all results obtained by the students of both groups without grouping them. Possible differences of marks of successful and failed works in both groups, as well as the differences in distribution of marks in the whole sample, should be found.
First, using the Chi-square test, analyze the numbers of students who have won not less than 2 points (satisfactory), and the others (with 0 or 1 point) in the two groups (Table 3). The difference between the data presented in Table 3 turned out significant at the level 10% (the value of Chi-square statistic = 2.813; df = 1; p-value = .094). In the analysis, the students with 0 and 1 point were grouped, in order to use the asymptotic distribution of Chi-square statistic. In addition, there is established difference (significant at the level 10%) in the results of the two groups (Chi-square statistic = 5.570; df = 2; p-value = .062).
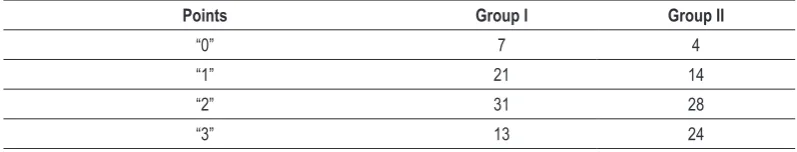
Table 3. Numbers of students having 0, 1, 2, or 3 points in the two groups (without grouping).
Points Group I Group II
“0” 7 4
“1” 21 14
“2” 31 28
“3” 13 24
The results presented here make it possible to draw a conclusion that the usage of new CAS-based teaching techniques, such as interactive presentations and computer modeling, improves results of teaching probability theory among students of engineering specializations.
A statistically significant (at 10% level) difference between the percentages of students in two groups with successful control work in module “Probability Theory” was established.
Discussion
The present research has examined using the CAS-based education techniques including interactive presentations and patterns for computer modeling, and an improved set of home tasks, in teaching Probability Theory for students of engineering specialization, and their impact on the education outcome achieved by students. Statistically significant differences between the two groups taught with and without usage of these techniques were detected. The produced samples are representative for students of engineering specializations. The share of male students in STEM fields is higher since men are more inclined to choose scientific-quantitative occupations (Del Pero & Bychkova, 2013).
Begin with the analysis of low results of the students of Group I (taught without usage of CAS-based technologies). Side by side with the obvious cause (insufficient working at certain topics), note the following causes of bad progress detected by qualitative analysis of students’ answers:
1) Insufficient motivation to prepare to the control work;
2) Incorrect interpretation of task statements or questions (e.g., they often confuse “one” and “at least one” etc.).
Vol. 76, No. 5, 2018 685
and seeking extra help. The structure of motivation and a suitable model of relationship between various components of motivation (gender, education program, and preliminary successes) in a heterogeneous group of students, studying the course of data analysis with computer technologies integrated into the education process, are presented in (Ivaniushina et al., 2016). It turned out that motivation is one of the most important factors influencing the education outcomes. The purpose of every education technology is to increase motivation by raising the interest of students to involve in the process of education. The present research shows that CAS-based technologies can also serve as such tools.
Possible incorrect interpretation of terms in complicated STEM-subjects is well known. E.g., it was established in (Özcan, 2017) that high school teachers as well as university instructors should take special care with terms and definitions they give, explain them in more details, and establish significant connections between them. A special role of mathematical language in study of mathematics is noted, and integrative theoretical framework for the study of the mathematical language is suggested (Kvasz, 2018).
Moreover, a hypothesis that gender differences influence students’ perception of using tablets in education is posed and partially proved (Davidovitch & Yavich, 2018). Thus, while females would attribute more weight to the affective dimension, males would attribute more weight to the cognitive dimension than females. A further research of influence of gender differences on education outcomes in Probability Theory with usage of CAS-based technologies is necessary.
There exist other possible causes of low education outcomes, e.g., fear before difficult courses such as calculus and statistics (Griffith et al., 2012; Peng, Hong, & Mason, 2014).
Although the mentioned possible causes of bad education outcomes are not different for the students of Group I and Group II, the research of these causes and taking them in account are necessary for future improvement of education methods, including interactive ones.
In (Geiger at al., 2018) an analysis of usage of information technologies in teaching mathematical subjects was undertaken, and it was found that these methods can be effective, e.g., in using online learning systems. In (Vlasova et al, 2017b) advantages of using CAS in teaching probabilistic subjects in technical universities are described, the main directions of penetration and preparation of materials are analyzed, their possible advantages are discussed, but the research has not proved positive impact of the considered methods on education outcomes.
The current research has shown that usage of the presented CAS-based education methods (interactive presentations and patterns for computer modeling, and an improved set of home tasks) makes it possible to achieve higher education outcomes in the first teaching module “Probability Theory”. The basic principles and methods of education with these techniques were discussed in (Garner, 2004; Kramarski & Hirsch, 2003). The experiences in using CAS in senior mathematics classroom and delineate changes in education methods are explored in (Garner, 2004). In addition, its advantages such as handheld CAS calculators that are able to perform algebraic, graphic and numeric calculations are shown. In addition, the paper (Kramarski & Hirsch, 2003) is devoted to research of didactic aspects and advantages of usage of CAS in teaching, especially the usage of integrating Self-Regulated Learning (SRL) within the CAS. It revealed that CAS+SRL students outperformed CAS students on algebraic thinking and that (CAS+SRL) students regulated their learning more effectively. The present paper demonstrates a positive effect of usage of interactive CAS-based education methods overall process of education and its outcomes, as well.
Vol. 76, No. 5, 2018
686 increase motivation of students and, consequently, their education outcomes. The course “Data Analysis” is closely connected with Probability Theory and Mathematical Statistics, as well. The results of the research (Emmioğlu & Capa-Aydin, 2012) deal with education outcomes of students in the course of Statistics, positive impact of usage of interactive education technologies on their education outcomes is proved. Moreover, the new information technologies individualize the process of education and more strongly involve students in it (Barba et al., 2016; Emmioğlu & Capa-Aydin, 2012; Ivaniushina et al., 2016). The results of the present research make it possible to draw analogous conclusions on positive effect of the described above interactive CAS-based education methods on education outcomes in one more subject of mathematical circle – Probability Theory.
The samples presented in the current research are of small volume, so it is necessary to continue the research. It would be interesting as well, to undertake a research of such kind on the results of teaching Module 2 (Mathematical Statistics), as well as to analyze residual knowledge of this subject. Moreover, according to (Korres, 2018) it is necessary to explore the attitude of the students to the suggested methods and forms of presentation of the matter, for the sake of further refinement of these methods. It would be important as well; to clarify how does the usage of CAS (Mathematica, MATLAB, MathCad, and others) increase the capability of students to solve problems of probability theory analytically.
Conclusions
Nowadays, the entire education process is moving towards computer-based education. It is increasingly important to use digital resources for higher standard and better learning, as well as to evaluate the impact of new education methods on the education outcomes. In the case of improper usage, their disadvantages may overcome their advantages and lead to losing the methods and quality of traditional learning. The current research shows the advantages of new CAS-based methods of teaching probability theory with using interactive supplementary materials (presentations, computer-modelling patterns, which examples are given in Appendix). For these purposes, education outcomes in 2 groups of 72 and 70 students of the same engineering specialization, learning the module “Probability Theory” within 7 weeks, and performing a control work on the 8-th week, in the years 2016-17 and 2017-18, were analyzed. The difference between the two groups was the following: the students in 2017-18 were taught with support by described CAS-based methods. The education outcomes in Probability Theory in the group of the 2017-18 year under consideration have proved to be significantly higher due to these education methods, as compared to the group of the 2016-17 year.
Acknowledgements
The authors would like to thank the anonymous referee for comments and suggestions that have significantly improved the text of this work. The authors are very grateful to their colleagues from Bauman Moscow State Technical University, who have supported them in gathering the field data for this research, and the students for participating in this research.
References
Abell, M. L., & Braselton, J. P. (2009). Mathematica by example. Amsterdam: Elsevier Academic Press. Barba, P. G., Kennedy, G. E., & Ainley, M. D. (2016). The role of students’ motivation and participation
in predicting performance in a MOOC. Journal of Computer Assisted Learning, 32 (3), 218-231. doi: 10.1111/ jcal.12130.
Vol. 76, No. 5, 2018 687
Broley, L., Caron, F., & Saint-Aubin, Y. (2018). Levels of programming in mathematical research and university mathematics education. International Journal of Research in Undergraduate Mathematics Education, 4 (1), 38-55. doi: 10.1007/s40753-017-0066-1.
Calder, N. (2012). The layering of mathematical interpretations through digital media. Educational Studies in Mathematics, 80 (1/2), 269-285. doi: 10.1007/s10649-011-9365-7.
Davidovitch, N., & Yavich, R. (2018). The impact of mobile tablet use on students’ perception of learning processes. Problems of Education in the 21st Century,76 (1), 29-42.
Del Pero, A. S., & Bychkova, A. (2013). A bird’s eye view of gender differences in education in OECD
countries. OECD Social, Employment and Migration Working Papers, No. 149, OECD Publishing. doi: 10.1787/5k40k706tmtb-en.
Emmioğlu, E., & Capa-Aydin, Y. (2012). Attitudes and achievement in Statistics: A meta-analysis study. Statistics Education Research Journal, 11 (2), 95-102.
Fisher, C. R. (2014). A pedagogic demonstration of attenuation of correlation due to measurement error.
Spreadsheets in Education (eJSiE), 7 (1), article four. Retrieved from http://epublications.bond. edu.au/ejsie/vol7/iss1/4.
Garner, S. (2004). The CAS classroom. Australian Senior Mathematics Journal, 18 (2), 28-42.
Geiger, V., Mulligan, J., Date-Huxtable, L., Ahlip, R., Jones, D. H., May, E.J., Rylands, L., & Wright,
I. (2018). An interdisciplinary approach to designing online learning: fostering pre-service mathematics teachers’ capabilities in mathematical modelling. ZDM Mathematics Education,50
(1-2), 217-232. doi: 10.1007/s11858-018-0920-x.
Griffith, J. D., Adams, L. T., Gu, L. L., Hart, C. L., & Nichols-Whitehead, P. (2012). Students’ attitudes
toward Statistics across the disciplines: A mixed-methods approach. Statistics Education Research Journal, 11 (2), 45-56.
Harrison, T. R., & Lee, H. S. (2018). iPads in the mathematics classroom: Developing criteria for selecting appropriate learning apps. International Journal of Education in Mathematics, Science and Technology (IJEMST), 6 (2), 155-172. doi:10.18404/ijemst.408939.
Holmes, P. (2003). 50 years of statistics teaching in English schools: some milestones. Journal of the Royal Statistical Society: Series D (The Statistician), 52 (4), 439-474. doi: 10.1046/j.1467-9884.2003.372_1.x.
Ivaniushina, V. A., Alexandrov, D. A., & Musabirov, I. L. (2016). The structure of students’ motivation: Expectancies and values in taking data science course. Educational Studies Moscow, 4, 229–250.
doi: 10.17323/1814-9545-2016-4-229-250.
Ivanov, O. A., Ivanova, V. V., & Saltan, A. A. (2017). Discrete mathematics course supported by CAS MATHEMATICA. International Journal of Mathematical Education in Science and Technology, 48 (6), 953-963. doi: 10.1080/0020739X.2017.1319979.
Kendal, M., & Stacey, K. (2002). Teachers in transition: Moving towards CAS-supported classrooms.
Zentralblatt für Didaktik der Mathematik, 34 (5), 196-203. doi: 10.1007/BF02655822.
Kramarski, B., & Hirsch, C. (2003). Using computer algebra systems in mathematical classrooms. Journal of Computer Assisted Learning, 19, 35-45. doi: 10.1046/j.0266-4909.2003.00004.x.
Korres, K. (2018). Students’ attitudes towards discovery learning / Constructivistic approach using computers as cognitive tools in higher mathematics education. European Journal of Engineering Research and Science, (CIE 2017), 44-49. doi: 10.24018/ejers.2018.0.cie.643
Kvasz, L. (2018). On the roles of language in mathematics education. In P. Ernest, The Philosophy of Mathematics Education Today (pp. 229-240). Springer: Cham. doi: 10.1007/978-3-319-77760-3_14.
Lai, A., & Savage, P. (2013). Learning management systems and principles of good teaching: instructor and student perspectives. Canadian Journal of Learning and Technology, 39 (3), 1-21.
Mendoza, J. L., & Stafford, K. L. (2001). Confidence intervals, power calculation, and sample size estimation for the squared multiple correlation coefficient under the fixed and random regression
Vol. 76, No. 5, 2018
688 Morán-Soto, G., & Benson, L. (2018). Relationship of mathematics self-efficacy and competence with
behaviors and attitudes of engineering students with poor mathematics preparation. International Journal of Education in Mathematics, Science and Technology (IJEMST), 6 (3), 200-220. doi: 10.18404/ijemst.428165
Nuriakhmetov, R. R. (2012). Perspective approaches to teaching of statistics for nonmathematical students. Novosibirsk State Pedagogical University Bulletin, 3, 57-64.
Özcan, Ö. (2017). Examining the students’ understanding level towards the concepts of Special Theory of Relativity. Problems of Education in the 21st Century, 75 (3), 263-269.
Peng, Y., Hong, E., & Mason, E. (2014). Motivational and cognitive test-taking strategies and their
influence on test performance in mathematics. Educational Research and Evaluation, 20 (5), 366-385. doi: 10.1080/13803611.2014.966115.
Rose, C., & Smith, M. D. (2000). Symbolic maximum likelihood estimation with Mathematica. Journal of the Royal Statistical Society. Series D (The Statistician), 49 (2), 229-240. doi: 10.1111/1467-9884.00233.
Sezonova, O. N., Galchenko, S. A., & Khodirevskaya, V. N. (2016). The efficiency of higher education
institutions as a basis for forming competent personnel for region economy. European Journal of Contemporary Education, 18 (4), 464-471. doi: 0.13187/ejced.2016.18.464.
Soper, J. B., & Lee, M. P. (1985). Spreadsheets in teaching statistics. Journal of the Royal Statistical Society. Series D (The Statistician), 34 (3), 317-321. doi: 10.2307/2987658.
Thomas, M. O. J. (2006). Teachers using computers in the mathematics classroom: A longitudinal study.
New Zealand Mathematics Magazine, 43 (3), 6-16.
Vlasova, E. A., Mezhennaya, N. M., Popov, V. S., & Pugachev, O. V. (2017a). Methodological aspects of
the discipline “Probability theory” in a technical university. Modern High Technologies, 17 (11), 96-103. doi: 10.17513/snt.36852.
Vlasova, E. A., Mezhennaya, N. M., Popov, V. S., & Pugachev, O. V. (2017b). The use of mathematical packages in the framework of methodological support of probabilistic disciplines in a technical university. Bulletin of Moscow Region State University. Series: Physics and Mathematics, 4, 114-128. doi: 10.18384/2310-7251-2017-4-114-114-128.
Wiest, L. R. (2008). The role of computers in mathematics teaching and learning. Computers in the Schools, 17 (1-2), 41-55. doi: 10.1300/J025v17n01_05.
Appendix. Examples of CAS-based teaching materials used Example of a variant of the supplementary home task
Task Statement. The random vector (X, Y) is distributed uniformly in the domain D. Find the probability density function of the random value Z = f(X,Y); calculate its expectation and dispersion. The domain D and the function f(X,Y) are presented in Table 4.
Table 4 presents several domains and functions determining the task statements. Obviously, it is possible to get many variants of equal difficulty by varying these parameters.
Table 4. Examples of variants of the supplementary home task.
Var.
No. D f(X,Y)
1 Triangle with vertexes (0; –1); (3;0); (1;1) X+Y
Vol. 76, No. 5, 2018 689
Table 5 presents Mathematica template (in the left-hand part) and the results of its running (right-hand part). The plots generated in Table 5 are presented in Figures 3-4.
Table 5. Solving supplementary task using CAS Mathematica (Variant 1 from Table 4).
Mathematica Code Result
Dom=Polygon[{{0,-1},{3,0},{1,1}}]; f[x_,y_]:=x+y;
Show [RegionPlot[Dom, BoundaryStyle-> {Black, Thick, Dashed}, PlotStyle->White], RegionPlot[{x,y}\[Element]Dom &&
f[x,y]<1, {x,0,3}, {y,-1,1}, BoundaryStyle-> {Black,Thick}, PlotStyle->White, Mesh->20, MeshStyle->{Thick,Black}, PlotPoints->40]]
(*The value of the cumulative distribution function is equal to the ratio of the area of shaded part of the region to the area of the entire region S*)
Figure 3
S=Integrate [Boole[{x,y}\[Element]Dom],
{y,-\[Infinity],\[Infinity]}, {x,-\[Infinity],\[Infinity]}];
FZ=Integrate [Boole[{x,y}\[Element]Dom && f[x,y]<z], {y,-\ [Infinity],\[Infinity]},
{x,-\[Infinity],\[Infinity]}]/S; fZ=Simplify[D[FZ,z]]
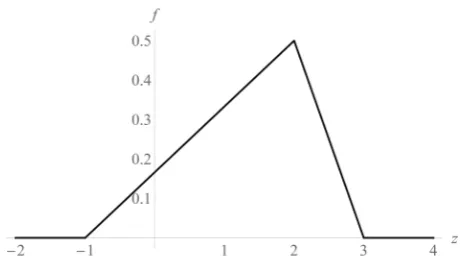
(3-z)/2, 2<=z<3 (1+z)/6 , 1<z<2
0, True
Plot[fZ,{z,-2,4},PlotStyle->Black, AxesLabel-> {“z”,”f”}] Figure 4
m=Integrate [z fZ,{z,-1,3}]
d=Integrate [(z -m)^2 fZ,{z,-1,3}] 4/313/18
Vol. 76, No. 5, 2018 690
Figure 4. Probability density function of the random value Z.
The Mathematica code presented in Table 5 can be used to generate answer for a huge amount of similar variants (for example from Table 4).
Example of the supplementary interactive presentation
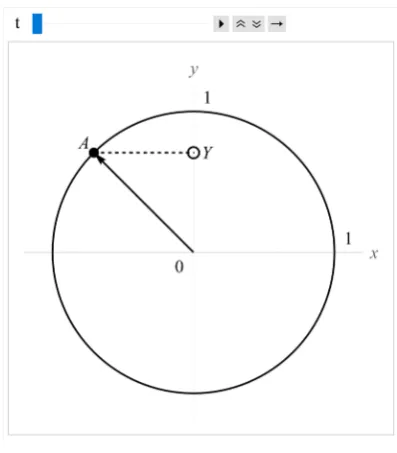
Let A be a random point distributed uniformly on the unit circle, Y be its y-coordinate. That random point can be modeled using the CAS Mathematica. The program code is in the left-hand part of the first row of Table 6; Figure 5 shows the result of its running.
Table 6. Generating supplementary interactive presentation using CAS Mathematica.
No Mathematica Code
1
Animate[Graphics[{Text[1,{1.1,0.1}], Text[1,{0.1,1.1}], Text[0,{-0.1,-0.1}], Thick, Circle[], PointSize[0.03], Point[{Cos[t],Sin[t]}], Text[“A”,{1.1Cos[t],1.1Sin[t]}],
Arrow[{{0,0},{Cos[t],Sin[t]}}], Thick, Circle[{0,Sin[t]},0.04], Text[“Y”,{0.1,Sin[t]}], Dashed, Li ne[{{Cos[t],Sin[t]},{0,Sin[t]}}]}, PlotRange->{{-1.2,1.2},
{-1.2,1.2}}, Axes->True, Ticks->None, AxesLabel->{“x”,”y”}], {t,0,2\[Pi]}]
2
Animate[Column[{Show[Plot[PDF[UniformDistribution[ {-\[Pi],\[Pi]}], x], {x,-\[Pi],\[Pi]}, Ticks->{{-\[Pi],0,\[Pi]},None},
AxesLabel->{“a”,”Subscript[f, A](a)”}, PlotStyle->{Thick,Black}], Graphics[{PointSize[0.03], Point[{t,0}], Text[1/(2\[Pi]),
{-0.15,0.18}]}]], Show[Plot[1/(\[Pi] Sqrt[1-y^2]), {y,-1,1}, PlotRange-> {-0.1,1}, Ticks->{{-1,0,1},{0,0.4,0.8}},
AxesLabel->{“y”,”Subscript[f, Y](y)”}, PlotStyle->{Thick,Black}], Graphics[{PointSize[0.03], Thick, Circle[{Sin[t],0},0.03]}]]}],
{t,-\[Pi],\[Pi]}]
3
Column[{Graphics[{PointSize[0.03], {Black, Point[Transpose[ {sample, Table[0,10]}]]}}, Axes->{True,False}, AxesLabel->
{“a”,None}, Ticks->{{-\[Pi],0,\[Pi]}, None}, PlotRange->
{{-3.5,3.5},{-1,1}}], Graphics[{PointSize[0.03], {Thick, Table[Circle[{sample1[[j]],0}, 0.1], {j,1,10}]}}, Axes->
Vol. 76, No. 5, 2018 691
Figure 5. Presenting the dependence between the coordinate of a point on the circle and the y-coordinate of the point.
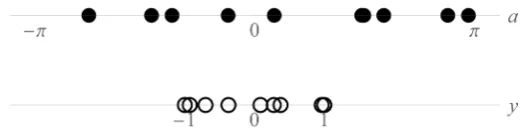
The Mathematica code for the comparison of probability densities of A and Y is presented in the second row of Table 6; its result is shown below (Figure 6). Next, samples of A and Y can be compared. The code is presented in the third row of Table 6 and the result is shown in Figure 7.
Vol. 76, No. 5, 2018 692
Figure 7. Random samples of a coordinate of a point on the circle and its y-coordinate.
The given examples allow making a notion about used supplementary teaching materials. Basing on them, one can elaborate new materials adapted to certain problems and purposes of education.
Received: June 28, 2018 Accepted: September 28, 2018
Natalia M. Mezhennaya Candidate of Physics and Mathematics, Associate Professor, Department
of Applied Mathematics, Bauman Moscow State Technical University, 2-nd Baumanskaya Street, 5, Moscow 105005, Russian Federation.
E-mail: [email protected] Website: http://hoster.bmstu.ru/~fn2/index
Oleg V. Pugachev Doctor of Physics and Mathematics, Professor, Department of Applied
Math-ematics, Bauman Moscow State Technical University, 2-nd Baumanskaya st., 5, Moscow 105005, Russian Federation.
E-mail: [email protected]
![>White, Mesh->20, MeshStyle->{Thick,Black}, PlotPoints->40]]f[x,y]<1, {x,0,3}, {y,-1,1}, BoundaryStyle-> {Black,Thick}, PlotStyle-Figure 3](https://thumb-us.123doks.com/thumbv2/123dok_us/8385058.1680114/12.595.59.453.222.611/white-meshstyle-thick-black-plotpoints-boundarystyle-plotstyle-figure.webp)