EDI T O RI A L
Open Access
Testing the assumptions of parametric
linear models: the need for biological data
mining in disciplines such as human
genetics
Jason H. Moore
1*, Trudy F. C. Mackay
2and Scott M. Williams
3* Correspondence:jhmoore@upenn. edu
1Department of Biostatistics and
Epidemiology, Institute for Biomedical Informatics, Perelman School of Medicine, University of Pennsylvania, Philadelphia, PA 19104-6021, USA
Full list of author information is available at the end of the article
All data science methods have specific assumptions that are made in order for their inferences to be valid. Some assumptions impact statistical significance test-ing and some influence the models themselves. For example, a fundamental assumption of linear regression is that the relationship between the independent and dependent variables is additive such that a unit increase in one leads to a unit increase in the other with some error that can be modeled using a normal distribution. The presence of a nonlinear relationship between the variables vio-lates this assumption and can lead to inaccurate inferences. We demonstrate this here using a simple example from human genetics and then end with some thoughts about the role of biological data mining in revealing nonlinear relation-ships between variables.
One of the central questions of human genetics is the extent to which variation in a quantitative trait such as cholesterol levels or blood pressure is due to variations in the DNA sequence. Heritability is one measure that is used to assess the relative contributions of genetic and non-genetic (environmental) variation to trait variation. Heritability ranges from zero to one with a value of one indicating that all variation in the trait is attributable to genetic variation. In reality, we never see heritability this high because nearly all biological traits have one or more environmental components and are generally measured with some error. Heritability estimates that take into account all of the different types of genetic effects are referred to as broad-sense her-itability (BSH). Additive genetic effects have historically received the most attention because they are useful for animal breeding and can be estimated from the correl-ation of the trait between pairs of relatives. An example of an additive genetic model would be a quantitative trait that has means of 10, 10.5, and 11 for genotypes AA, AG, and GG, respectively, at a single point in the DNA sequence. In this example, the Gallele increases the mean by one half unit for each inherited copy. Twice the trait correlation among sibling pairs is an estimate of heritability due to additive genetic effects and is referred to as narrow-sense heritability (NSH). Twice the cor-relation is used here because siblings only share, on average, half their genes. Cousins share, on average, 12.5% of their genes and thus NSH is estimated from the trait correlation multiplied by eight.
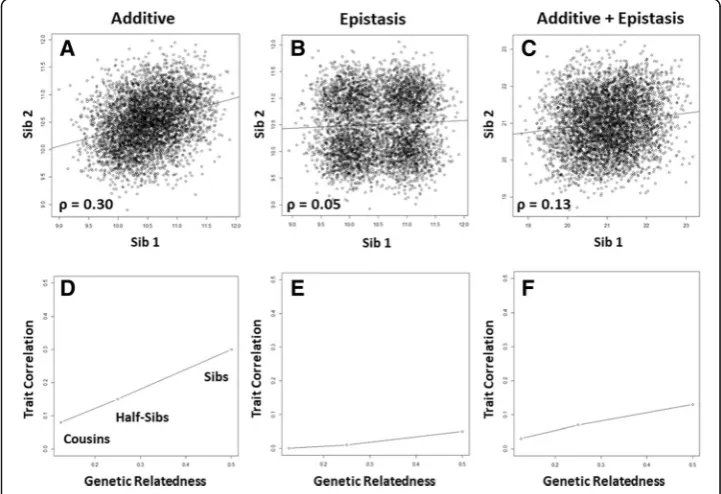
To illustrate NSH we present the following simulation results using the genetic model presented above. Here, the genotypic means are 10, 10.5, and 11. We assume a total trait variance of 0.3. We assume the alleles (A and G) have equal frequencies of 0.5 in the population and assume genotype frequencies of 0.25 (AA), 0.5 (AG), and 0.25 (GG) that are consistent with Hardy-Weinberg expectations. We first simulated a single DNA sequence variation in 5000 unrelated parents using these genotype frequencies. We then simulated two children by drawing from the two alleles from each parent with 0.5 probability. We then simulated phenotypes for each parent and each sibling from a normal distribution with means and variance as described above for the additive genetic model. Figure1a shows a scatterplot of the relationship of the trait between for each of the sibling pairs. Also shown is a least squares fit regression line with a slope and correlation of approximately 0.30. Using this correlation, we can estimate the NSH of this trait as 0.60. As validation, we can also use a linear model to estimate the variance component for the DNA sequence variation in the unrelated parents. Here, we coded genotypes AA, AG, andGG as 0, 1, and 2 so we can estimate the additive genetic variance component. The ratio of the additive variance over the total trait vari-ance is an estimate of NSH. Here, this is equal to 0.60 which is exactly the heritability estimated from the trait correlation in the sib pairs. We confirmed this by estimating NSH from simulated half-sibs and cousins. We showed that the NSH for this additive genetic model drops in half and then in half again as the genetic relatedness of the relative pairs drops in half (Fig. 1d). The linear relationship between trait correlation
and genetic relatedness of the relative pairs used for each estimate is considered by many to be a hallmark of an additive genetic model for the trait.
Publisher’s Note
Springer Nature remains neutral with regard to jurisdictional claims in published maps and institutional affiliations.
Author details
1Department of Biostatistics and Epidemiology, Institute for Biomedical Informatics, Perelman School of Medicine,
University of Pennsylvania, Philadelphia, PA 19104-6021, USA.2Center for Human Genetics and Department of Genetics and Biochemistry, Clemson University, 114 Gregor Mendel Circle, Greenwood, SC 29646, USA.3Department of Epidemiology and Biostatistics, Case-Western Reserve University, 10900 Euclid Avenue, Cleveland, OH 44106, USA.
Received: 11 January 2019 Accepted: 3 February 2019
References
1. Huang W, Richards S, Carbone MA, Zhu D, Anholt RR, Ayroles JF, Duncan L, Jordan KW, Lawrence F, Magwire MM, Warner CB, Blankenburg K, Han Y, Javaid M, Jayaseelan J, Jhangiani SN, Muzny D, Ongeri F, Perales L, Wu YQ, Zhang Y, Zou X, Stone EA, Gibbs RA, Mackay TF. Epistasis dominates the genetic architecture of Drosophila quantitative traits. Proc Natl Acad Sci U S A. 2012;109:15553–9.
2. van Dongen J, Willemsen G, Chen WM, de Geus EJ, Boomsma DI. Heritability of metabolic syndrome traits in a large population. J Lipid Res. 2013;54:2914–23.
3. Bennett BJ, Davis RC, Civelek M, Orozco L, Wu J, Qi H, Pan C, Packard RR, Eskin E, Yan M, Kirchgessner T, Wang Z, Li X, Gregory JC, Hazen SL, Gargalovic PS, Lusis AJ. Genetic architecture of atherosclerosis in mice: a systems genetics analysis of common inbred strains. PLoS Genet. 2015;11:e1005711.