STUDY THE EFFECT OF GRAPHENE ON POLYMER (PAPA) COMPONENT 1Ayad Shatti, 1Kanaan K.Ahmed , 2Osamah Adnan, 2Ihab Aljanabi,
1Ministry of Education, Salah Alden, Iraq, 2Ministry of Education, Alkarh Second, Iraq E. mail: [email protected], [email protected]
Article received Article received 28.9.2018, Revised 24.01.2019, Accepted 30.01.2019
[
ABSTRACT
In this study graphene was prepared from the reaction of the graphene oxide by hummer methods. The prepared nanoparticles were characterized by infrared spectra, X-ray diffraction (XRD), atomic force microscope (AFM), and scanning electronic microscope (SEM). Two types of polymers were prepared (PAPA) , Were diagnosed by FT_IR. The polymeric chips were maxed with vinyl alcohol polymer (PVA)(it's physical and chemical properties was known). The physical and electronic properties of these polymers were studied after deflection with nanoparticles. Electrophysiological measurements showed that the PAPA with graphene nanoparticles has shown a higher conductivity than the (PAPA) polymers. and the real dielectric moment constant of (PAPA +Graphene). Whereas the electrostatic moment constant showed a significant in PAPA. The study showed that these latter particles have a higher electric capacity of store energy than the polymer and are suitable for many applications ranging from the manufacture capacity to batteries.
Key word: Graphene, nanoparticles, polymer PAPA, conductivity, Dielectric constant, Nanocomposites.
INTRODUCTION
Materials that are added to nanoparticles, during the synthesis of these materials, nanoparti-cles will significantly improve of material proper-ties for example; the addition of carbon nanotubes to material changes the electric and thermal of this material. And the addition of other types of nano-particles may improve the optical properties (such as strength and hardness). The volume percentage of added nanoparticles should be very low (within 0.5 - 5%), because the ratio between interface area and size of nanoparticles should be high. The paper reports the synthesis and characterization of nanoparticles containing nanographene and poly-mer and study the electric properties of these com-pounds before and after adding nanographene, and investigate their effect on properties [Vicki Bolam et al., 2008]. The modern society is observing an increase in renewable energy productions, such as the sun, wind, water...Etc. Hence, interest has been generated in the development of electrical
vehicles and hybrid vehicles with low CO2 emissi-
ons. Energy storage systems are starting to play a major role in modern lives since many limitations mainly related to reliability and sustainability for these renewable energy productions [Yan Wang, et al., 2009].
Therefore, many studies have focused on the development of new electrical energy storage system to meet higher demands for future syst-ems, ranging from portable electronics to hybrid electric vehicles and large industrial equipment [Yan Wang, et al., 2009, Ibrahim, 2008]. Electro-chemical supercapacitors¸ with nano particles are one of the new technologies currently under
development for advanced energy storage systems.
Composite materials are compound of two or more distinct materials and are expected to dis-play extensive features emerging from the combi-nation of properties of each component. The pro-perty of composite is superior to those of indivi-dual components. They have high specific modu-lus and high strength comparing to individual traditional materials and these properties can be tailored for specific application [Ahmad Varvani-Farhani 2010].
Compared to conventional composites, nano-composites are defined as multi-phase solid mate-rials where one of the phases is a nanomaterial whose size is between 1-100nm and in at least one dimension [Bandy Opadhyay]. Due to the nano-meter size of the materials, nanocomposites poss-ess unique size dependent properties, which are not typically shared by their conventional micro composite counterparts. Nanocomposites with their outstanding properties are finding applicat-ions in numerous fields. It has been estimated that there is a great increase in the trend of global consumption of composites in the next few years [Ajayan and Schadler 2003].
2. MATERIALS AND METHODS
graphite by hammer method, which is reduced to graphene as in the following steps:
Step one: The preparation of graphene oxide by hummer method [William and Richard, 1958] A 23ml of the con. H2so4 was put an Acebath 0.5 g of NaNO3 was added Slowly and add of NaNO3 0.5g to a 23ml of con. H2SO4 on Ace bath with stirring at 0 °C for 15min, and 0.2g of graphite powder was added slowly to the mixture for 10 min. This is followed by the slow addition of KMnO4 3 g for 15min. The mixture was left at Acebath for 5min and left to stirrer for only 1.0 hr. After, that add 46ml of distill water; very slowly drop by drop. The addition lasts for more than 20 min and raise the temperature to 98 c0 for 20 min. Then add 140ml of distilled water and the mixture was left to stir for 10 min and add 9ml of H2O2 30% with stirring for 30min. The mixture was cooled at room temperature and filtered off by special filter paper. The pot. was washed several times with distilled water and dried in oven at 60-70°C for 4hr.
Step two: Reduction of graphene oxide.
A 50ml of distilled water was added to 0.1g of graphene oxide in round flask 250ml with stirring, and a suspension of graphene oxide and water was
formed. The mixture was taken to ultrasound and left to become clear solution, and 1.0 ml of hydri- sine hydrate was added and heated to 100°C for 24hr.
The solid ppt. was filtered off, washed with distilled water (approximately 5 times *100ml) followed by Etoh (approximately 5 times * 100 ml) and dried in oven.
2.3. Preparation of polymers:
1. poly [2,2bis ((4-acety benzoyl oxy) methyl)) propane - 1,3-diylbis (4-acetyl benzoate) PAPA: A solution containing( 1.36 g , 10 m mole) of pentaerythritol (PER) in pyridine 5ml and DMF 2ml and cooled at - 5°C and added to it a Terephthalyolchlorid TPC (4.06g, 20m mol) in pyridine 7ml under an inter atmosphere of nit-rogen gas with stirring, The mixture was stir-red at room temperature for 24 min. The poly-mer was receipted by adding the reaction mix-ture to three times its volume of Methanol (CH3OH). The ppt. was filtered off and washed with distilled water and Methanol (CH3OH), and dried in oven under vacuum at (60°C) as in the following equation:
PAPA → TPC + PER
2.4. Methods of preparing the polymeric sheets (or Films): The polymeric films were prepared with different concentrations in order to get the best sample that could be considered as standard to prepare the polymeric Films containing nanoparticles in preparation. We tested many weights to prepare the polymeric films from the mixture PVA with 40% of any polymers prepared (PAPA). The best combination through the strong, transparent and reliable homogeneous films can be obtained in the preparation of nanoparticles. 2.5. The preparation of composite polymer films: Graphene Films was prepared with PAPA to obtain good films so that they are thin, strong and homogeneous to do the electric measurements. It should be of one type: PVA 60% + polymer PAPA 40%.
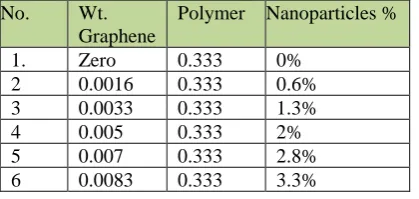
The different concentrations of nanoscale films were prepared as shown in table 1. The nanoparticles were used with two types of composite polymer Films as shown in table 1.
Table 1: PAPA concentration, graphene weight and (%) of nanoparticles.
No. Wt. Graphene
Polymer Nanoparticles %
1. Zero 0.333 0%
2 0.0016 0.333 0.6%
1. 3 0.0033 0.333 1.3%
2. 4 0.005 0.333 2%
3. 5 0.007 0.333 2.8%
4. 6 0.0083 0.333 3.3%
3. RESULTS AND DISCUSSION
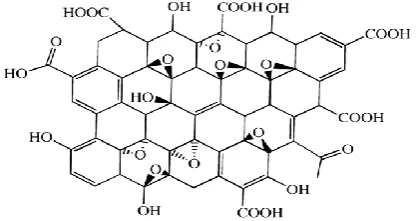
oxide (fig. 1) and Graphene (fig. 2) shows that the ɤ (OH) was stretching at (3200-3400) cm-1, and ɤ(C=O) at 1726 cm-1 where-as the ɤ(C=C) appeared at 1627 cm-1, and hetero cycle for the epoxy group (OH) at (1396_1425 ) cm-1 and ɤ(C-OH) at 1032 cm-1.
Fig 1: FT_IR spectrum of graphene oxide.
After the reaction the ɤ (C=O) group disappeared, and ɤ (C=C) was shown at 1577cm-1, where-as, the band was at 1060 cm-1 in spectra of graphene and graphene oxide due to the ɤ (C-C) group, which was the stand and bond in the structure of the graphene and graphene oxide.
Fig. 2: FT_IR spectrum of the nanographene Films.
The forms show clearly that the reaction
results have formed a bond of type (sp2) in carbon structures. Based on these results, it can be concluded that the graphene Films are formed (see fig.3).
Fig.3: Hydribziation of carbon orbitals for sp2 bond.
These results were supported by the XRD tests for graphene and graphene oxide (figs. 4 and 5)
Fig.4: XRD of nanographene oxide particles.
Fig.5: XRD of nanographene pelts.
These results correspond to references [Sun-gjin Park et al., 2011, Nethravathi et al., 2010]. In fig. 4, a strong peak at 2Ө =11.7 represents the internal distance, and equals 7.6 A0, while in fig 5, a broad peak in the XRD spectrum of graphene, at (2Ө=22.3, 25.68, 26.83), and due to the interstitial intervals between the nanoparticles were equal to (A0 4. 91 ,3.72, 3.39) respectively. These results resulted from the exfoelletion, reduction process of graphene oxide, and removing the water mole-cules between the nanoplates that were associated with hydrogen bonding between the oxygen atoms of oxide groups (see fig.6)
Fig. 6: Suggested structure of graphene oxide Films.
over-lapping despite their separation from each other. This is confirmed by the AFM (fig. 7), and the scanning electronic microscope (SEM) (fig. 8)
Fig7: Image in AFM
Fig. 8: Image in SEM (10mm) showing the overlapping of graphene plates.
Although the SEM image was measured by the micrometer, it showed that the graphene plates overlapped each other. This was confirmed by AFM, and the results were supported by many references [Subrahmanyam et al., 2008, Ma et al., 2009, Stankovich et al., 2007]. Moreover, the nanoparticles overlapped each other as a result of the oxidation - reaction process, and this also sup-ported by references such as [Subrahmanyam et al., 2008, Stankovich et al., 2007, Ma et al., 2009]. The diffusion of graphene plates was measured in various solvent, and their effect on the nanopar-ticles is shown in fig. 9 A-c.
Fig. 9A: Graphene in various solvents after 3hr form mixing.
Fig. 9 B: Suspension graphene nanoparticles in various solvents after 48 hr from mixing.
Fig.9 c: Small concentration of nanoparticles in various solvents.
The used solvents: Distilled water, Methanol, Eth-anol, Dimethyl formide, Acetone, Benzene, Chlo-roform, Acetic acid, Aniline and Conc. Hydro-chloric acid
Figures 9A and B show that the graphene was diffused in various solvent, and does not ppt, whereas fig. 9c shows that the graphene was ppt. in small amounts in solvents 5 to 10 but diffused in various solvents 1 to 4.
3.2. Characterization of polymers
1. Poly[-2, 2-bis ((4-acetylbenzoyloxy) methyl) propane-1,3-diylbis(4-acetylbenzoate)](PAPA): The PAPA polymer was characterized by FT_IR, and the fig. 10 shows the spectrum of it.
Fig. 10: (FT_IR) spectrum of PAPA polymer.
if k = 1.57*10-4, a = 0.79
using the (mark-hunk) equation [Shen, 1971], the M.w is equal to 45687.
3.3- Electric properties of graphene pure. 3.3.1-A.C Electric conductivity: The electric measuring of graphene was studied by using HPL-CR apparatus. It was observed that the electric measuring of the nanoparticles at the frequency (100-4000Hz. sec) is low to stable at low freque-ncy, and beings to rise slightly to (1000Hz.sec) After that it will be clearly and forcefully high (see fig. 11).
Fig 11:AC electric conductivity with Change of pure graphene frequency.
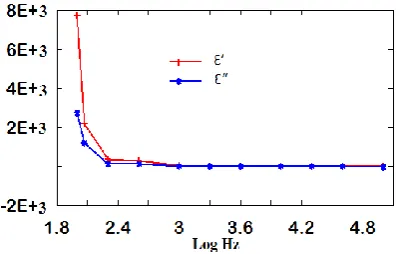
3.3.2- Dielectric constant: The measurement of real and imaginary constant (ϵ", ϵ') respectively, are shown in fig 12. The values increased in the low frequency zone at (100_200 Hz.sec). On the other hand, it began to decrease and became stable at (200_100.000 Hz. sec) frequencies zone.
Fig. 12: change of dielectric constant with the change of pure graphene frequency.
The factor of the real and imaginary dielectric constant is M' and M" respectively. We show a clear atrophy of its values in the low frequency zone (about 100_200 Hz), The values are noticed to raise at the high frequency zone (2000_4000 Hz), which is unexpected after 4000Hz. After that, they started to fall again. The frequency value of the peak is the relaxation time frequency at (40000Hz) (see fig.13)
Fig.13: change of the values of factor of real and imag-inary dielectric constant with the frequency change of graphene pure.
3.4. Electric properties of pure PAPA polymer: Poly[2,2-bis-((4-acetylbenzoyloxy) methyl)-pro-pane-1, 3-diylbis-(4- acetylbenzoate)]( PAPA). 3.4.1_Ac electricconductivity:The present study of conductivity values of pure PAPA polymer in alternative current by using different frequencies showed that the conductivity values in low fre-quency zone are (limit 100_120Hz) between (2.9 E-6 _ 3.7 E_6) (S.cm-1), but with the increase of frequency to (200_2000Hz.sec), the conductivity becomes at the lowest value. After that, there is a sudden increase in conductivity values after (40000Hz.sec) see (fig. 14).
Fig.14: Ac electric conductivity values with change of pure PAPA polymer frequency.
Fig. 15: change of real and imaginary dielectric constant values in pure PAPA polymer.
The factor values of real and imaginary diele-ctric constant (M', M") respectively (fig. 16) are stabilized at 100_200Hz.sec frequencies and start to increase at 4000Hz.sec to its highest peak with the increase of frequency at (100.000Hz.sec).
Fig 16: values of real and imaginary dielectric constant of pure PAPA polymer.
3.5. Electric properties (graphene + PAPA polymer)
3.5.1. Actual electric conductivity: The electric conductivity values of polymeric nanoparticles were studied with the change in the graphene concentration and percentage in Ac with different frequencies (see fig. 17)
Fig. 17: Ac electric conductivity values with the cha-nge of frequency of composite (Graphene + polymer PAPA).
The film 1 does not have a clear effect at low frequency (100_4000Hz.sec), but a slight change is observed after frequency 10000_100000 Hz. sec. While the films containing low concentration
of graphene, which can be seen in table 1 (in experimental section) (film 2_4) are equal to or less than (0.15%) and have very low electric con-ductivity values especially at (100_2000 Hz. sec). They start to increase with the frequency increase to be more than (2000_100.000Hz.sec).
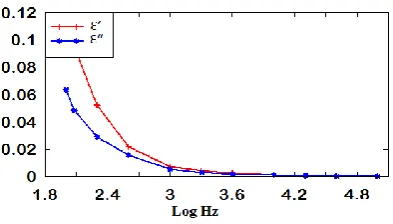
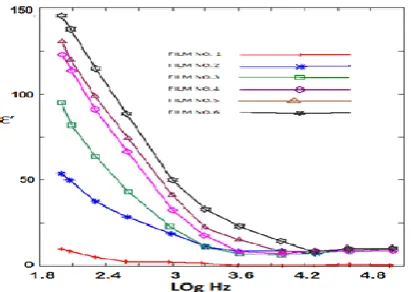
The electric conductivity of film (5) (concen-tration equal to 0.20, fig. 21) shows a specific value of electric conductivity between (0.015_ 0.02 S.m-1). It behaves differently from other con-centrations. particularly, in low frequencies beca-use as conductor materials (semiconductor mate-rials). As for the concentration (0.25%) we see that this-films has a good electric conductivity. It is noticeable that the graphene concentrations have an important role in the composite conduc- tivity. Note that when the increase of concen-tration of graphene, especially at low frequencies which are less than (2000Hz.sec), a sudden rise in electric conductance nature is seen, and the trans-formation of the composite from insulation mate-rials to semi conductance matemate-rials and to conduc-tance materials this is called accompanying to beginning of the nomination [Yu Chao Li et al., 2010], can explain the change in the electric con-ductivity depend on the graphene amount in the composite. As for the concentration (0.2%) in film 5 (see fig 17), these amounts of graphene will form, may interfaces between the nanoparticles and the polymer. This will increase the number of nanoparticles and (π) orbitals of graphene. The polarization between the interfaces will be regula-ted and the electrons in the present the electric current will be rearranged. Furthermore, increas-ing the conductivity will increase graphene con-centration. This is called accompanying the begin-ing of the nomination, and in this case the real dielectric constant will be decreased (see fig. 18). 3.5.2. Dielectric constant: Figure 18 shows that the real dielectric constant values (ϵ') are changed with composite frequencies in 24°C. Hence, the composite which has high (ϵ') values will be dec-reased with the rise of frequencies; especially at (1000_2000Hz.sec).
Fig. 18: change of € values with the change of (graph- ene + polymer PAPA) frequency.
In the composite (2-6), the increase in dielectric constant value can be explained by the increase of polarization, which makes the value of (ϵ') the highest at low frequencies, and due to the pres-ence of the interfaces between the nanoparticles and the polymer, in addition to polarity of the poles and this depends on the properties and com-position of the samples [Tsangaris et al., 1998, Gatos et al., 2007, Psarras et al., 2007].
It is observed in fig. 17 that there is a constant increase in the electric conductivity with the inc-rease of graphene concentrations. This is reflected in the values of (ϵ'), so that the increase of € is a homogeneous increase with the concentration. This indicates that the polar value and the stored energy are proportional with graphene concentra- tion.
Fig. 19 shows that the ε values decrease with increased frequency values; especially at (1000 Hz.sec). The clear difference between ϵ' and ϵ" means that these composites have excellent power in the manufacture of the electric capacities or electric loses [Psarras et al., 2007].
Fig. 19: change of ϵ'' values with the change of frequency of (Graphene + polymer PAPA).
Fig.20 and 21 show the change of M' and M" values with the change of nanoparticles.
Fig. 20: change of M' values with the change of (graphene + polymer PAPA) frequency.
Fig. 21: change of M'' values with the change of (Graphene + Polymer PAPA) frequency.
The M' value suddenly increase at (4000Hz. sec), while M" value increase is proportional to the concentration of nanoparticles, and the peaks are shown in fig. 25i.e the W' value is the rela-xation time for each sample.
REFERENCE
Ahmad Varvani-Farhani, Composite Materials: Characterization, Fabrication and Application-Research Challenges and Directions. Appl. Compos. Mater. 17: 63-67 (2010).
DOI10,1007/s10443-009-9107-5.
Ajayan, P.M. and L.S Schadler, Nanocomposite Science and Technology, Copyright 2003, WILEY-VCH Verlag GMBH Co. KGaA, Weiheim, and ISBN: 3-527-30359-6 (2003).
Bandy, A.K., Opadhyay, Nano materials P.2. New Age International publisher
Gatos K.G., Martínez Alcázar J.G., Psarras G.C., Thomann R., Karger-Kocsis J., Polyurethane latex/ water dispersible boehmite alumina nanocomposites: Thermal, mechanical and dielectrical properties. Composite Science and Technology 67: 157–167 (2007).
DOI: 10.1016/j.compscitech. 2006.07.025. Ibrahim, H. and J. Perron, Energy storage systems
Ma L.P., Wu Z.S., Li J., Wu E.D., Ren W.C., Cheng H.M., Hydrogen adsorption behavior of graphene above critical temperature. Int. J. Hydrogen Energy 34: 2329–32 (2009).
Nethravathi A., Michael Rajamathi, N. Ravi-shankar, Lubna Basit, Claudia Felser, Synthe-sis of graphene oxide-intercalated a-hydroxi-des by metathesis and their decomposition to graphene/metal oxide composites. Carbon 48: 4343- 4350C (2010).
Psarras G.C., Gatos K.G., Karahaliou P.K., Georga S.N., Krontiras C.A., Karger-Kocsis J., Relaxation phenomena in rubber/layered silicate nanocomposites. Express Polymer Letters 1: 837–845 (2007).
DOl:10.3144/ expesspolymett.2007.116. Shen M., "Hand book of Polymer chemistry"
Viscoelastic relaxation in polymers, Wiley – Inter science, New York Pp. Vi+269 (1971). Stankovich S., Dikin D.A., Piner R.D., Kohlhaas
K.A., Kleinhammes A., Jia Y. et al. Synthesis of graphene-basenanosheets via chemical red-uction of exfoliated graphite oxide. Carbon 45: 1558–65 (2007).
Subrahmanyam K.S., Vivekchand S.R.C., Govindaraj A., Rao C.N.R., A study of grap-henes prepared by different methods charac-terization, properties and solubilisation. J. Mater. Chem. 18: 1517–23 (2008)
Sungjin Park, Jinho An, Jeffrey R. Potts, Aruna Velamakanni, Shanthi Murali, Rodney S. Ruoff, Hydrazine-reduction of graphite- and graphene oxide. Carbon 49: 3019-3023 (2011) Tsangaris G.M., Psarras G.C., Kouloumbi N., Electric modulus and interfacial polarization in composite polymeric systems. Journal of Materials Science 33: 2027–2037 (1998). Vicki Bolam, Sheila Davis, Amanda Davison,
Lauren Ornelas, Esperanza Sanz, Michael Starkey, and Meredith Williams. The Silicon Valley Toxics Coalition, Regulating Emer-ging Technologies in Silicon Valley and Beyond. (2008)
William S. Hummers Jr., and E. Richard, Offeman preparation of Graphene Oxide. Journal of the American Chemical Society 80: 1339-1339 (1958).
Yan Wang, Z.S., Yi Huang, Yanfeng Ma,
Cheng-yangWang,MingmingChen, Yongsheng Chen,
Supercapacitor Devices Based on Graphene Materials. The Journal of Physical Chemistry C. 113: 13103-13107 (2009).