Ware Pundlik et al., J. Sci. Res. Phar. 2013, 2(2), 1 -5
Journal of Scientific Research in Pharmacy 2013, 2(2)
1-5
J
ournal of
S
cientific
R
esearch in
P
harmacy
Research Article
Available online thr oug h
ISSN: 2277-9469
www.jsrponline.com
Removal of Dye Effluent by Different Aquatic Plant in Kadodara (Dist. Surat) Region by
Rhizofiltration Technique
Ware Pundlik*, R Krishnamurthy, Milin Varsadia
Department of Chemistry, C.G. Bhakta Institute of Biotechnology, Gopal Vidyanagar, Maliba Campus, Uka Tarsadia University, Bardoli, Gujarat-394350, India.
Received on: 01-06-2013; Revised and Accepted on: 16-06-2013
ABSTRACT
Synthetic dyes are extensively used in various branches of the textile industry, leather industries, paper production, food technology& agriculture research. The effluents of these industries produces verity of pollution in in nearby sewers & rivers. The remediation of dye effluent after twenty days under the influence of Eichhornia & Pistia species shows the significant change in the concentration of impurities. The change is observed by the analysis of Physico-chemical parameters, Nutrients, Microbial Factors & Solid parameters of treated & untreated dye effluents with different interval of days. The concentration of sodium gives amazing results in both plants for dye effluents. The plants are analyzed for percentage of NPK, whi ch shows significant results for Eichhornia species. The percentage of nutrients absorbed by Eichhornia species shows better results than Pistia species. The degradation of dye effluents by using two ways affects on the concentration of all impurities.
Key words: industry, pollution, remediation, effluent, chemical, degradation.
INTRODUCTION
Fresh water is one of the necessi ties for nutrition of life, but the human competition for many years going to destroy these valuable things. The year 2010 report shows that Indians consume 470 cubic meters of water per person per annum.In the textile industry (Gupta GS, Shukla MVB, Prasad G, Singh VN. 1992), leather-tanning industry in paper production (Ivanov K, Gruber E, Schempp W, Kirov D 1996), in food technology (Bhat and Mathur, 1998), in agricultural research (Cook and Linden, 1997) in light harvesting arrays, in photo electro-chemical cells and in hair colorings, synthetic dye plays an important role. The textile industry is one of the greatest generators of liquid effluent due to the high quantities of water that are used in the dyeing processes. The effluents from these industries are complex, containing a wide variety of dyes and other products, such as dispersants, acids, bases, salts, detergents, oxidants, and high TDS, sodium, chloride, sulfate, hardness, and carcinogenic dye ingredients. More than 7000 different compounds and additives are used for the preparation of textile materials, and up to 1 kg of these substances is used for each kilogram of fabric (Hessel, C.C., Allegre, M., Maisseu, F., and Charbit, P.2007). More than 80,000 tons of reactive dyes are produced and consumed every year. An estimate shows that textiles account for 14% of India’s industrial production and around 27% of its export earnings. There are about 10,000 garment manufacturers and 2100 bleaching and dyeing industries in India. The majority is concentrated in the states of Tamil Nadu, Punjab and Gujarat. According to the central pollution-control board (CPCB), in India, chemicals that are likely to be from the Red List Group, which is said to be harmful, and unhealthy (Ravikumar & Dutta, 1996).The Dyes may affect the photosynthetic activity in aquatic life due to reduced light penetration and may be toxic to some aquatic life due to the presence of an aromatic, metals, etc. in them.
Water-soluble reactive and acid dyes are problemati c as they pass through the conventional treatment system and hence, their removal is important (Rouf Ahmad et al. 2010).
*Corresponding author:
Ware Pundlik
Department of Chemistry,
C.G. Bhakta Institute of Biotechnology, Gopal Vidyanagar, Maliba Campus, Uka Tarsadia University, Bardoli, Gujarat-394350, India.*E-Mail: [email protected]
Several physical and chemical methods have been suggested for the treatment of dye-contaminated wastewater but are not widely used because of the high cost and secondary pollution that can be generated by excessive use of chemicals. The Bioremediation technologies, which focus on living organisms as cleanup agents, are seen as an alternative with great potential for the affordable remediation of polluted sites (Khandare RV, Kabra AN, Tamboli DP, Govindwar SP. (2012)). However, biologists have now recognized that plants also have qualities that can make them great remediation agents and a new field called phytoremediation is receiving more attention from both academia and industry.
MATERIALS AND METHODS
1. Sampling:
Dye effluent samples are collected in plastic containers previously cleaned by washing with non-ionic detergent, rinsed with tap water, later soaked in 10% HNO3 for 24 hours, and finally rinsed with deionised water prior to use.
The dye effluent sample is collected from Kadodara (Dist. Surat) dyeing industries.
Date of sampling:
1) Dye effluent : 20th Jan, 2012
2) Dye effluent : 24th Feb., 2012
2. Plant Material:
The following plants are used to study
1. Eichhornia Crassipes (water hyacinth plant)
Family- Pontederiaceae,
2. Pistia Stratiotes (water Lettuce)
Family-Araceae. Plant samples are collected from the Dholikue village near Mahuva, Bardoli (Dist. Surat) and wash with double distilled water and store it at 4oC until analysis.
3. Experimental Design:
content of the plant is dried up & analyzed the dried sample for nutrient value (% N, P, K analysis).
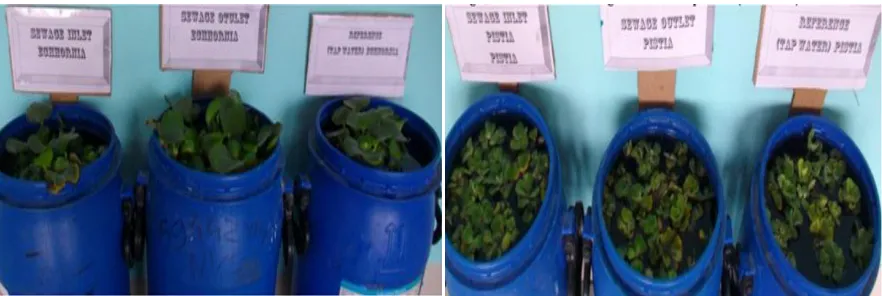
Fig. 1: Eichhornia and Pistia Plant in Dye effluent and Tap water (Reference) before the treatment
After Primary Treatment on Dye Effluent:
In freshly collected the Dye effluent and first filter with muslin cloth or wattmen filter paper no.4. After the filtrati on, addition 10g of activated carbon and stirring continuously and stay
at for 1hr. In above filtrate alum added up to 15g in each container and wait for 1hr. After complete settlement of impurity filter it and used for the primary analysis as shown in Fig. 2.
Fig. 2: Eichhornia and Pistia Plant in Dye effluent after the treatment.
4. Analysis:
A. Physico-Chemical Parameter: pH & Conductivity: This is measured according to APHA-2010 method.
B. Nutrients:
i. Sodium by a flame photometer: Sodium was detected by using the Systronics flame photometer [model no. 128] (Nabil Ramadan Bader, Vol.4, No.1 (2011)).
ii. Potassium by a flame photometer: Potassium was detected by using the Systronics flame photometer [model no. 128].
iii. Phosphorus: By Vanadomolybdophosphoric Acid
Colorimetric Method: Inorganic phosphorous in sewer water was measured by using Visible Spectrophotometer [Elopson Helious Thermoelectron Corporation] absorbance method.
iv. Chlorine (Residual): By Iodometric Electrode Technique: Chlorine was measured by a digital potentiometer [CL-525 Chemline].
v. Nitrate-nitrogen: By Ultraviolet Spectrophotometric Screening Method: Nitrate has measured by Double Beam UV Spectrophotometer [Helious Alpha Thermoelectron Corporation] absorbance method.
C. Microbial Factor:
i. Biochemical Oxygen Demand (BOD): By Five Day BOD Test Method:
Calculation:
BOD = [DO before incubation – DO after incubation] х no. of volume diluted
No. of volume diluted = 1
ii. Chemical Oxygen Demand (Cod): By Open Reflux Method. iii. Dissolved Oxygen [DO]: By Winkler Method.
iv. Coliform count: (Dr. Chandrakant R. Kokare; Dr. R.S. Gaud and G. D. Gupta)
Madhuri Sadu et al., J. Sci. Res. Phar. 2013, 2(3), 1-3
Journal of Scientific Research in Pharmacy 2013, 2(3)
1-3
RESULTS AND DISCUSSION
Table No. 1: The mean of all 20 days reading before pretreatment of dye effluent
Sr. No.
Parameters
Dye Effluent Eichhornia
Dye Effluent Pistia
Tap Water Eichhornia
Tap Water Pistia 1 pH 7.81 7.54 8.12 8.01
2 Conductance (mmho) 3011.29 2791.18 1934.15 1911.75
3 TS (mg/l) 3.9 3.32 1.66 1.32
4 TDS (mg/l) 3.11 2.6 1.23 1.19
5 DO (mg/l) 2.28 1.38 1.72 1.3
6 BOD (mg/l) 2.28 1.38 1.72 1.3
7 COD (mg/l) 1396.20 1411.56 138.22 156.65
8 Chlorine (ppm) 4.56 3.8 2.16 2.12
9 Total Coliform 1100 64 1100 1100
10 P (ppm) 3.99 4.59 1.31 1.50
11 NO3- (ppm) 1.73 1.95 0.65 0.71
12 K (μg/l) 21.69 20.86 17.45 17.55
13 Na (μg/l) 52.74 54.12 50.78 50.55
Table No. 2: The mean of all 20 days reading after pretreatment of dye effluent
Sr. No. Parameters Dye Effluent
Eichhornia Dye Effluent Pistia Tap Water Eichhornia Tap Water Pistia 1 pH 4.66 4.76 8.12 8.01
2 Conductance (mmho) 5357.80 5274.65 1904.13 1881.05
3 TS ( mg/l) 4.04 4.08 1.66 1.32
4 TDS (mg/l) 3.68 3.72 1.23 1.19
5 DO (mg/l) 3.04 3.42 1.72 1.3
6 BOD (mg/l) 3.04 3.42 1.72 1.3
7 COD (mg/l) 835.58 863.23 14.72 14.36
8 Chlorine (volt) 5.12 4.78 2.16 2.12
9 Total Coliform 75 39 1100 1100
10 P (ppm) 2.006 2.39 1.31 1.50
11 NO3- (ppm) 0.96 1.11 0.65 0.71
12 K (μg/l) 13.1 14.2 17.45 17.55
13 Na (μg/l) 43.01 45.61 50.78 50.55
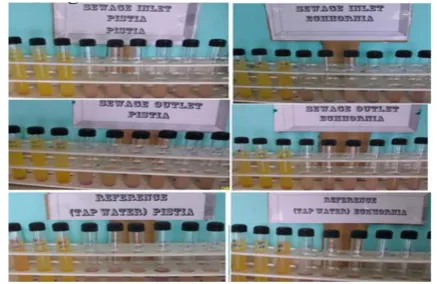
The mean of all twenty days results obtained from before & after pre-treatment dye effluents are shown in Table 1 & 2. The coliform test before pre treatment of dye effluent is shown in Fig. 3.
Fig. 3: Coliform test (MPN/100ml) before the treatment
Therefore, the Total Coliform count = 1100 MPN/100ml
Table No. 3: Amount of nutrients from the Dye effluent (Before the treatment)
Nutrient Dye Effluent Eichhornia1
In ppm Dye Effluent Pistia1 In ppm
0 day 20 day 0 day 20day
Phosphate 7.42 1.57 7.42 1.85
Nitrate 2.24 1.24 2.24 1.58
Sodium 65.03 41.22 65.03 44.07
Table No. 4: Amount of nutrient from the Dye effluent (After the treatment)
Nutrient Dye Effluent Eichhornia2
In ppm
Dye Effluent Pistia2 In ppm
0 day 20 day 0 day 20day
Phosphate 4.85 0.68 4.85 0.99
Nitrate 1.7 0.3 1.7 0.5
Sodium 50.12 32.15 50.12 34.07
In addition, nutrient analyses in plant before and after treatment are shown in Table 5 & 6.
Table No. 5: Nutrient analyses in plant (Before treatment)
Plants Nutrients
Nitrogen (N)% Phosphorus(P)% Potassium (K)%
Eichhornia1 2.24 0.19 1.90
Pistia1 1.30 0.11 1.32
Table No. 6: Nutrient analyses in plant (After treatment)
Plants Nutrients
Nitrogen (N)% Phosphorus(P)% Potassium (K)%
Eichhornia2 2.10 0.15 1.47
Pistia2 1.37 0.09 0.60
Physical parameters: pH was continuously increased to be alkaline for both cases before and after the treatment. After the sedimentation and the adsorption, pH decrease to considered level, but it again increases to be alkaline. Higher pH ceases the growth of the plant.
Nutrient parameter in water:
Fig. 4: Plot of nutrient concentration after 20 days versus different species from table 3 & 4.
From Fig. 4, sodium content is high in each dye sample & very small decrease in its amount after rhizofiltration technique. Plants absorb most of the phosphate & nitrate. The graph & result Table 3 &4
indicates amount of each nutrient absorbed by Eichhornia is higher than Pistia.
Microbial parameter: From Table 1 & 2, the level of BOD & DO is continuously decreasing due to depletion of organic matter in water. The ratio of BOD and COD decreases in Eichhornia plant was higher than the Pistia. The coliform test indicates water was not portable for human consumption but after the treatment, PNP number decreased in significant number.
Solid parameter: Total solid and total dissolved solid are in the permissible range.
Nutrients in a plant sample:
Fig. 5: Plot of nutrient concentration versus different species from table 5 & 6.
From Fig. 5, there is notable change observed in NPK in Eichhornia than Pistia plants. Before the treatment, the % of NPK in Eichhornia is a more than Pistia while after the treatment nutrient level reduces.
SUMMARY AND CONCLUSION
In the present study of Dye effluent disposal from the Kadodara dyeing industry shows an addition of various pollutants that result in the physico-chemical and biological characteristics. From the comparative study of dye effluents indicates that Eichhornia is highly efficient in absorbing the nutrients in the water but to a certain extent. Moreover, high biomass containing Eichhornia plant could be considered as organic fertilizer.
ACKNOWLEDGEMENT:
Madhuri Sadu et al., J. Sci. Res. Phar. 2013, 2(3), 1-3
Journal of Scientific Research in Pharmacy 2013, 2(3)
1-3
REFERENCES:
1. Bhat RV, Mathur P. “Changing scenario of food colors in India”. Journal of Current Sciences, 1998; 74: pp 198-202.
2. Cook SMF, Linden DR. “Use of Rhoda mine WT to facilitate dilution and analysis of atrazine samples in short-term transport studies”. Journal of Environmental Quality, 1997; 26: pp 1438-1441.
3. Daniel, G.P., Wenhao, H.S., Chung-Shih, T., and Qing, X.L. A phytoremediation study: Selection of tropical and other vascular plants for decolorization of Poly R-478 dye. Remedi. J., 2006; 16: 97-107.
4. Dar S.H., Kumawat D.M., Singh N. and Wani K. A. “Sewage Treatment Potential of Water Hyacinth (Eichhornia crassipes)”. Ecological Engineering, 2010; 36: 1299-1306.
5. Edwards, N.T. Uptake, translocation and metabolism of anthracene in bush bean (Phaseolus vulgaris L.). Environ. Toxicol. Chem., 1986; 5: 659-665.
6. Gajanan S. Ghodake , Amar A. Talke , Jyoti P. Jadhav & Sanjay P. Govindwar. “Potential of brassica juncea in order to treat textile-effluent-contaminated sites”. International Journal of phytoremediation, 2009; 11: 297-312.
7. Gupta GS, Shukla MVB, Prasad G, Singh VN. “China clay as an adsorbent for dye house wastewaters”. Journal of Environmental Technology, 1992; 13: pp 925-936.
8. Gupta, M., Sinha, S. and Chandra, P. “Uptake and toxicity of metals in Scirpus lacustris L. and Bacopa monnieri L”. Journal of Environment Science and Health, 1994; A29(10): pp. 2185-2202.
9. Hegazy A.K, Abdel-Ghani N.T, El-Chaghaby G.A. “Phytoremediation of industrial wastewater potentiality by
Typha domingensis”. Int. J. Environ. Sci. Tech., 2009; 8(3): 639-648.
10. Hessel, C.C., Allegre, M., Maisseu, F., and Charbit, P. Moulin guidelines and legislation for dye house effluents review. J. Env. Mana., 2007; 83: 171-180.
11. Ivanov K, Gruber E, Schempp W, Kirov D. “Possibilities of using zeolite as filler and carrier for dyestuffs in paper”. Das Papier,
1996; 50: pp 456-460.
12. Kabra AN, Khandare RV, Waghmode TR, Govindwar SP. “Phytoremediation of textile effluent and mixture of structurally different dyes by Glandularia pulchella (Sweet) Tronc”. Epub,
2012; 1751-41.
13. Kagalkar AN, Jagtap UB, Jadhav JP, Govindwar SP, Bapat VA. “Studies on phytoremediation potentiality of Typhonium flagelliforme for the degradation of Brilliant Blue R”. Epub,
2010; 271-85.
14. Khandare RV, Kabra AN, Tamboli DP, Govindwar SP. “The role of
Aster amellus Linn. in the degradation of a sulfonated azo dye Remazol Red: a phytoremediation strategy”. Epub, 2012; 1147-54.
15. Kulkarni B.V, Dr. Ranade S.V and Dr. Wasif A.I. “Phytoremediation of textile process effluent by using water hyacinth - A polishing treatment”. Indian J. Environ. Prot. 2008; 16(7): 329-401.
16. Macek T, Mackova M, Kas J. “Exploitation of plants for the removal of organics in environmental remediation”. Biotechnology Advances., 2000; 18: pp 23-34.
17. Ministry of Textiles (2004). Government of India. Annual Report, 2003-2004; 21-22.
18. Nabil Ramadan Bader. Sample Preparation For Flame Atomic Absorption Spectroscopy: An Overview, 2011; 4(1)
19. Chandrakant R. Kokare. (2008) Pharmaceutical microbiology, Experiment and techniques, Career publication, 6th edition, 63,
140, 220.
20. Dr. R. S. Gaud, Dr. G. D. Gupta. (2006) Practical microbiology, Nirali prakashan, Pune, 4th edition,72, 73.
21. P. Chakraborthy. (2005) A text book of microbiology, New central book agency (p) Ltd., Kolkata, 2nd edition, 93-96.
22. Rahul V. Khandare, Akhil N. Kabra, Mayur B. Kurade, Sanjay P. Govindwar. “Phytoremediation potential of Portulaca grandiflora Hook. (Moss-Rose) in degrading a sulfonated diazo reactive dye Navy Blue HE2R (Reactive Blue 172)” Epub, 2011; 6774-7.
23. Raskin I, Ensley BD. (2000) Phytoremediation of Toxic Metals: Using Plants to Clean Up the Environment. John Wiley & Sons, Inc., New York.
24. Ravikumar and Dutta PK. Are Textiles Finishing The Environment?. Indian J. Environ. Prot., 1996; 16(7): 499-501. 25. Rouf Ahmad Shah, D.M. Kumawat, Nihal Singh And Khursheeed
Ahmad Wani. “Water Hyacinth (Eichhornia Crassipes) As a Remediation Tool for Dye-Effluent Pollution” International Journal of Science and Nature, 2010; 1(2): 172-178.
26. Roy R., Fakhruddin A. N. M., Khatun R. and Islam M.S. “Reduction of COD and pH of textile industrial effluents by aquatic macrophytes and algae”. Journal of Bangladesh Academy of Sciences, 2010; 34(1): 9-14.
27. Scarpi C, Ninci F, Centini M, Anselmi C. “High-performance liquid chromatography determination of direct and temporary dyes in natural hair colorings”. Journal of Chromatography A., 1998; 796: pp 319-325.
28. Schnoor, J.L., Licht, L.A., McCutcheon, S.C.,Wolfe, N., and Carreira, L.H. Phytoremediation of organic and nutrient contaminant. Environ. Sci. Technol., 1995; 29: 318-323.
29. Schnoor JL, Licht L.A, McCutcheon SC, Wolfe NL, Carreira L.H. “Phytoremediation of organic and nutrient contaminants”. Journal of Environmental Science and Technology, 1995; 29: pp 318A-323A.
30. Schnoor JL. Phytoremediation. University of Lowa, Department of Civil and Engineering, 1997; 1: 62.
Conflict of interest: The authors have declared that no conflict of interest exists.