[
Original article
Relationship between Duke Treadmill Score and platelet volume indices in predicting coronary artery
disease
Rasim Kutlu
1, Mehmet Erdem Memetoğlu
2, Tolkun Muratalievic Murataliev
3, Kadir Gökhan Saçkan
2,
Hasan Yaşar
21
Denizli State Hospital, Denizli, Turkey
2
Dr.Siyami Ersek Cardiovascular and Thoracic Surgery Hospital, İstanbul, Turkey
3
National Cardiology and Internal Medicine Institude, Bishkek, Kyrgyzstan
Received 11 June 2015, Revised 1 July 2015, Accepted 1 August 2015
© 2015, Kutlu R., Memetoğlu M.E., Murataliev T.M., Saçkan K.G., Yaşar H. © 2015, Russian Open Medical Journal
Abstract: Purpose — Platelet volume indices are associated with poor cardiovascular outcomes. The Duke Treadmill Score (DTS) is a composite index that is based on the results from the exercise test. The purpose of this study was to investigate the relationship between the DTS and platelet volume indices in patients with suspected coronary artery disease (CAD).
Methods — A total of 1205 participants were enrolled in the study. Complete blood counts were obtained. All participants underwent an exercise test. The DTS were calculated after exercise. Demographic, clinical and echocardiographic characteristics of the patients were recorded.
Results — Platelet distribution width (PDW) and especially mean platelet volume (MPV) values increase with higher DTS risk group irrespective of CAD and risk groups which is also found to be statistically significant (P<0.001). The power of the relation was powerful (r=0.911). A powerful positive relation was found between risk level and PDW (P<0.001, r=0.319). Paralleled with DTS, MPV and PDW values of the patients with CAD, hypertension, diabetes mellitus, smoking and hyperlipidemia were higher compared to those without, while MPV and PDW values were lower for the patients taking beta-blockers, angiotensin-converting-enzyme inhibitors or angiotensin receptor blockers, diuretics, aspirin and statins. When MPV (f1) and PDW (%) values were compared between groups, there was a high statistical significance between most groups.
Conclusion — We found an independent association between MPV, PDW and DTS.
Keywords: coronary artery disease, mean platelet volume, platelets
Cite as Kutlu R, Memetoğlu ME, Murataliev TM, Saçkan KG, Yaşar H. Relationship between Duke Treadmill Score and platelet volume indices in predicting coronary artery disease. Russian Open Medical Journal 2015; 4: e0402.
Correspondence to Rasim Kutlu. Address: Denizli state hospital, Denizli/Turkey. Phone: +90 541 3534097. Fax: +90 (258) 241 28 53. E-mail: [email protected]
Introduction
Predicting coronary artery disease (CAD) in growing number of patients at risk for the disease using economical non-invasive techniques is crucial and can provide significant clinical and economic benefits.
Exercise stress testing is a commonly used and inexpensive method for an initial evaluation of patients with suspected CAD. The Duke Treadmill Score (DTS) is a composite index that is based on the results from the exercise test, including ST-segment depression on electrocardiogram (ECG), chest pain and exercise duration, and provides more accurate diagnostic and prognostic information for the evaluation of patients with clinically-suspected ischemic heart disease. The DTS has showed a great value in prioritizing patients for coronary angiography in a typical transitional clinical setting [1].
A large population study reported that DTS combined with exercise stress testing seeks to assess in a simple manner and to express numerically: the patients risk of a coronary event [2].
Automated cell counters have made the platelet count (PC) and the platelet volume indices (PVI) – mean platelet volume (MPV), platelet distribution width (PDW) routinely available in laboratories.
PDW directly measures the variability in platelet size. It has been postulated that large platelets may be an indicator of platelet activation, and thus be related to the extent of CAD. Increased MPV indicates large-sized hyperaggregable platelets, which are metabolically and enzymatically more active than normal-sized platelets, and accepted as an independent cardiovascular risk factor [3]. It is well-established that elevated MPV is associated with acute micardial infarction (MI), mortality following MI, and restenosis following coronary angioplasty [4, 5].
[
Table 1. Demographic clinical and echocardiographic characteristics of the study population
Parameters Total (n=1205) Group 1 (n=373) Group 2 (n=460) Group 3 (n=372) P-value
Age, years, mean±SD 57±7.2 56±5.9 57±8.9 57±8.3 >0.005
Gender Male, % 47±4.1 46±5.3 46±7.1 47±4.2 >0.005
Female, % 58±7.5 59±5.7 58±4.4 57±2.2 >0.005
CAD, no. (%) 961 (79.75) 351 (29.13) 340 (28.22) 270 (22.41) >0.005
Hypertension, no. (%) 827 (68.63) 245 (20.33) 332 (27.55) 250 (20.75) >0.005
Diabetes mellitus, no. (%) 386 (32.03) 128 (10.62) 131 (10.87) 127 (10.54) >0.005
Hyperlipidemia, no. (%) 495 (41.08) 111 (9.21) 202 (16.76) 182 (15.10) >0.005
Smoking, no. (%) 520 (43.15) 212 (17.59) 198 (16.43) 110 (9.13) >0.005
Aspirin, no. (%) 1001 (83.07) 334 (27.71) 401 (33.28) 266 (22.07) >0.005
Klopidogrel, no. (%) 701 (58.17) 201 (16.68) 298 (24.73) 202 (16.76) >0.005
Beta bloker, no. (%) 1110 (92.12) 341 (28.30) 367 (30.46) 402 (33.36) >0.005
ACEi or ARB, no. (%) 850 (70.54) 247 (20.50) 337 (27.97) 266 (22.07) >0.005
CCB, no. (%) 121 (10.04) 39 (3.24) 44 (3.65) 38 (3.15) >0.005
Diuretic, no. (%) 421 (34.94) 110 (9.13) 167 (13.86) 44 (3.65) >0.005
Statin, no. (%) 494 (41.00) 111 (9.21) 201 (16.68) 182 (15.10) >0.005
LVEF, % 49±7.1 51±2.4 50±7.9 48±8.2 >0.005
SD, standart deviation; CAD, coronary artery disease; ACEi, angiotensin coverting enzyme inhibitor; ARB, angiotensin II receptor blocker; CCB, calcium channel blocker; LVEF, left ventricle ejection fraction. P-value between Group 1 and 2 and difference lies between Group 3 and 1/2.
Table 2. The laboratory findings of the study population
Parameters Group 1 Group 2 Group 3 P-value
Overall Group 1-3 Group 2-3 Group 1-2
Haemoglobin, g/dl 12.0 (11.1-16.7) 12.0 (11.3-16.1) 12.0 (11.7-16.4) - - - -
WBC, x103/µ1 7.32 (3.97-11.4) 7.37 (3.90-11.3) 7.33 (4.31-11.1) - - - -
Platelet, x103/µ1 233 (119-432) 219 (144-480) 238 (167-431) - - - -
MPV, f1 8.31± 0.41 8.72±0.45 8.91±0.48 <0.001 <0.001 <0.001 <0.001
PCT, % 0.173 (0.077–0.276) 0.204 (0.105–0.301) 0.172 (0.099–0.204) <0.001 <0.433 <0.001 <0.001
PDW, % 12.47±0.73 14.70±1.03 15.33±0.99 <0.001 <0.001 <0.563 <0.001
WBC, white blood cell; MPV, mean platelet volume; PCT, plateletcrit; PDW, platelet distribution width. Data presented as mean ± standard error.
PDW, platelet distribution width; MPV, mean platelet volume.
Figure 1. Figure shows the relationship between mean platelet volume, platelet distribution width, and Duke Treadmill Score according to risk scale.
Material and Methods
Patient population and study protocol
A total of 1205 patients followed up by the Cardiology Department of Gümüşhane State Hospital between March 2012 and 2013 were included in the study, all of whom have undergone effort test. The local research ethics committee approved the study.
While 709 (58.84%) patients were female and 496 (41.16%) were male, the mean age was 57±7.2 years. The present
diagnoses, risk factors, treatments, clinical values and findings of the patients as well as distribution of these parameters among
groups are given in detail in Table 1.
DTS were measured for patients undergoing effort test. DTS formula is as follows: (duration of exercise (minutes) – 15 x ST deviation) – (4 x angina index (angina index: 0: no angina; 1: limiting angina; 2: angina interrupting the test)). Reference values: -11 is considered as high risk, -10 and +4 intermediate risk, +5 and higher as low risk.
The patients were investigated in three goups (signed as 1, 2, and 3): DTS was >+5 in Group 1 in which 373 (30.95%) patients were included and categorized as low risk group. DTS was -10 and +4 in Group 2 where 460 (38.17%) patients were included and categorized as moderate risk group. DTS was <-11 in Group 3 where 372 (30.87%) patients were included and categorized as high risk group.
Complete blood count, aspartate aminotransferases (AST), alanine aminotransferases (ALT), lipid values and fasting blood glucose values were investigated in the control examinations of all patients. Tests: 12-derivation standard electrocardiograms were all reflecting sinus rhythm. Transthoracic echocardiography (ECHO) and ejection fraction (EF) were measured using Simpson’s method (EF = left ventricular diastolic caliber – left ventricular end-systolic caliber / left ventricular end-diastolic caliber x 100%).
Transthoracic echocardiography (ECHO) was performed using Philips HD11XE (Philips Medical Systems, Bothell, WA, USA) device and Effort test was performed using Tepa Tm-Pro-2000 (TM-PRO 2000, Tepa, Turkey) device.
[
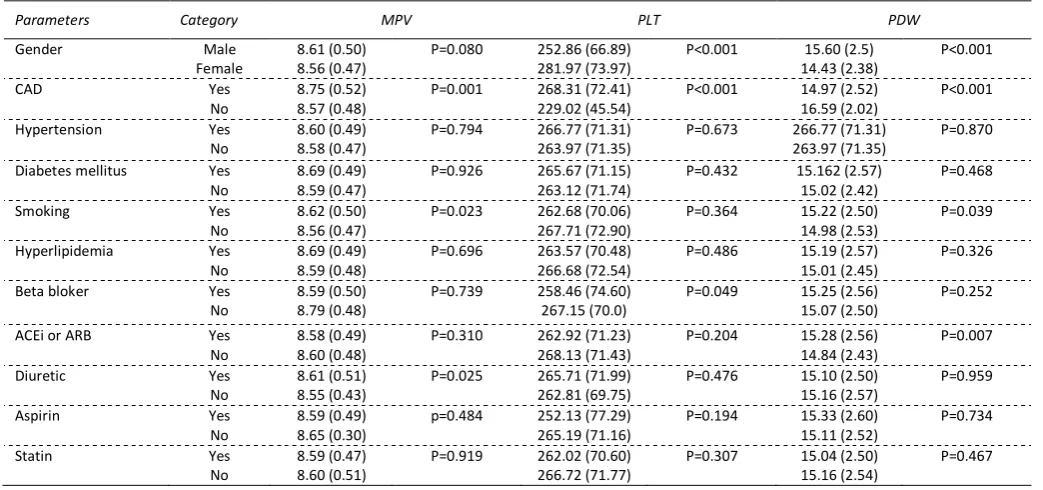
Table 3. Laboratuary parameters according to demographical, clinical, and medical features
Parameters Category MPV PLT PDW
Gender Male
Female
8.61 (0.50) 8.56 (0.47)
P=0.080 252.86 (66.89) 281.97 (73.97)
P<0.001 15.60 (2.5) 14.43 (2.38)
P<0.001
CAD Yes
No
8.75 (0.52) 8.57 (0.48)
P=0.001 268.31 (72.41) 229.02 (45.54)
P<0.001 14.97 (2.52) 16.59 (2.02)
P<0.001
Hypertension Yes
No
8.60 (0.49) 8.58 (0.47)
P=0.794 266.77 (71.31) 263.97 (71.35)
P=0.673 266.77 (71.31) 263.97 (71.35)
P=0.870
Diabetes mellitus Yes No
8.69 (0.49) 8.59 (0.47)
P=0.926 265.67 (71.15) 263.12 (71.74)
P=0.432 15.162 (2.57) 15.02 (2.42)
P=0.468
Smoking Yes
No
8.62 (0.50) 8.56 (0.47)
P=0.023 262.68 (70.06) 267.71 (72.90)
P=0.364 15.22 (2.50) 14.98 (2.53)
P=0.039
Hyperlipidemia Yes
No
8.69 (0.49) 8.59 (0.48)
P=0.696 263.57 (70.48) 266.68 (72.54)
P=0.486 15.19 (2.57) 15.01 (2.45)
P=0.326
Beta bloker Yes
No
8.59 (0.50) 8.79 (0.48)
P=0.739 258.46 (74.60) 267.15 (70.0)
P=0.049 15.25 (2.56) 15.07 (2.50)
P=0.252
ACEi or ARB Yes
No
8.58 (0.49) 8.60 (0.48)
P=0.310 262.92 (71.23) 268.13 (71.43)
P=0.204 15.28 (2.56) 14.84 (2.43)
P=0.007
Diuretic Yes
No
8.61 (0.51) 8.55 (0.43)
P=0.025 265.71 (71.99) 262.81 (69.75)
P=0.476 15.10 (2.50) 15.16 (2.57)
P=0.959
Aspirin Yes
No
8.59 (0.49) 8.65 (0.30)
p=0.484 252.13 (77.29) 265.19 (71.16)
P=0.194 15.33 (2.60) 15.11 (2.52)
P=0.734
Statin Yes
No
8.59 (0.47) 8.60 (0.51)
P=0.919 262.02 (70.60) 266.72 (71.77)
P=0.307 15.04 (2.50) 15.16 (2.54)
P=0.467
PDW, platelet distribution width; MPV, mean platelet volume; PLT, platelet. Data presented as mean ± standard error.
Blood samples were drawn from the antecubital vein with a 20-Gauge needle, and whole blood counts counts were measured in blood samples, which were collected to dipotassium EDTA tubes before treatment. The following hematological parameters were recorded in all blood samples: platelet count (PLT), and MPV. Complete blood counts including MPV were determined using an autoanalyzer (Beckman Coulter LH 750). Whole blood cell counting was routinely performed by the following parameters:
haemoglobin (g/dl), PLT (109/L), white blood cell count (WBC)
(x103/µ1), platelet distribution width (PDW) (%), plateletcrit (PCT)
(%) and mean platelet volume (MPV) (fl). We recorded the age, gender, systolic blood pressure (SBP), diastolic blood pressure (DBP), medical agents, and left ventricular EFs of our patients.
Statistical analysis
SPSS 18.0 package software was used for statistical evaluations. Parameters assessed in our study were presented as frequency, percentage, mean and standard deviation. Mann-Whitney U test was used in the analysis of differences between independent measurements of two groups according to the results of normality test. The differences between the measurements of DTS groups were analysed first by using Kruskal-Wallis test and then by Bonferroni corrected Mann-Whitney U test (α=0.017). Spearman correlation test was performed for relations between measurements while controlling the normality of data distributions. P values were compared with 0.05 where >0.05 was considered as insignificant, <0.05 as significant and <0.01 as very significant.
Results
As shown in Table 1, the differences between all the
parameters of distribution among groups were equal and also statistically insignificant.
Table 2 examines the differences in MPV and PDW for the three risk groups. A difference is seen in PDW values between mild and moderate group and between mild and high group while there was no difference between the PDW values of moderate and high risk groups. Considering MPV values, an increase was observed paralleled by an increase in DTS which also was statistically significant. MPV and PDW values increased with higher DTS risk group irrespective of CAD and risk groups which was also found to be statistically significant. Based on the correlation analysis, MPV
increases by increasing DTS risk level as seen in Figure 1 (P<0.001).
The power of the relation was powerful (r=0.911). A powerful positive relation was found between risk level and PDW (P<0.001, r=0.319).
The differences between groups were analyzed using parameters including gender, CAD, hypertension, diabetes mellitus, smoking, hyperlipidemia and beta blocker, angiotensin-converting-enzyme inhibitor (ACEi) or angiotensin receptor blocker
(ARB), diuretic, aspirin, statin use are seen in Table 3. Despite not
[
hypertension, diabetes mellitus, smoking, hyperlipidemia, beta blockers, ACEi or ARBs, diuretics, aspirin, statin).
Discussion
In this study, PDW and notably MPV values increase with higher DTS risk group irrespective of CAD and risk groups which is also found to be statistically significant.
Despite not being statistically significant (P=0.005), mean MPV value was found to be higher in patients with diabetes mellitus, hypertension and hypercholesterolemia compared to those without such risk factors irrespective of CAD and DTS in this study. Examples of such studies are found in the literature: Furthermore, higher MPV is observed in patients with diabetes mellitus [6], hypertension [7], hypercholesterolemia [8], smoking [9] suggesting a common mechanism by which these factors may increase the risk of cardiovascular disease.
Our study also supports those exemplified above.
It is thought that high MPV levels may be an effective marker in determining the severity of CAD, and the high MPV level may be related with CAD pathophysiology [10]. Cetin et al. [11] reported that patients with acute st-elevation myocardial infarction (STEMI) had higher PDW than patients with stable CAD, and mean platelet volume and PDW were independent predictors of thrombolysis failure. A recent study reported that PDW is associated with the extent of CAD and coronary total occlusions [12].
The exercise treadmill test (ETT) has been a very useful tool in detecting or determining the degree of coronary artery disease, and the maximization of the test diagnostic value with the addition of clinical information is encouraged [13]. Vacanti and et al. [14], reported that the ETT is superior to the myocardial perfusion scintigraphy to predict cardiovascular risk in the elderly.
Youn et al. [15] suggests that DTS reflects coronary flow reserve and the severity of ischemia in patients with microvascular angina. Shaw et al. [16] demonstrated that DTS was effective at diagnosing significant and severe CAD. They regarded CAD severity as number of diseased artery rather than morphological and structural properties of coronary arteries.
We did not encounter in the literature any study comparing MPV, PLT and PDW values between patients under low, moderate or high risk groups as classified by DTS. In this regard, our study is among the first ones in its category.
Conclusion
This study’s findings suggest that MPV and PDW may improve the prognostic information in the prediction of prevalence and extent of CAD. According to significant association between DTS and platelet volume indices, we think that MPV and PDW are simple, easily obtainable, and potentially useful prognostic biomarkers that can contribute to cost reductions in the detection of coronary artery disease and stratification of pathology.
Conflict of interest: none declared.
References
1. Shaw LJ, Peterson ED, Shaw LK, Kesler KL, DeLong ER, Harrell FE Jr, et al. Use of a prognostic treadmill score in identifying diagnostic coronary disease subgroups. Circulation 1998; 98(16): 1622-1630. (PMID: 9778327) (doi: 10.1161/01.CIR.98.16.1622)
2. Balady GJ, Larson MG, Vasan RS, Leip EP, O'Donnell CJ, Levy D. Usefulness of exercise testing in the prediction of coronary disease risk among asymptomatic persons as a function of the Framingham risk score. Circulation 2004; 110(14): 1920-1925. (PMID: 15451778) (doi: 10.1161/01.CIR.0000143226.40607.71)
3. Martin JF, Bath PM, Burr ML. Influence of platelet size on outcome after myocardial infarction. Lancet 1991; 338(8780): 1409-1411. (PMID: 1683417) (doi: 10.1016/0140-6736(91)92719-I)
4. Trip MD, Cats VM, van Capelle FJ, Vreeken J. Platelet hyperreactivity and prognosis in survivors of myocardial infarction. N Engl J Med 1990; 322(22): 1549-1554. (doi: 10.1056/NEJM199005313222201) (PMID: 2336086)
5. Yang A, Pizzulli L, Lüderitz B. Mean platelet volume as marker of restenosis after percutaneous transluminal coronary angioplasty in patients with stable and unstable angina pectoris. Thromb Res 2006; 117(4): 371-377. (doi: 10.1016/j.thromres.2005.04.004) (PMID: 15935453)
6. Papanas N, Symeonidis G, Maltezos E, Mavridis G, Karavageli E, Vosnakidis T, Lakasas G. Mean platelet volume in patients with type 2 diabetes mellitus. Platelets 2004; 15(8): 475-478. (PMID: 15763888) (doi: 10.1080/0953710042000267707)
7. Nadar S, Blann AD, Lip GY. Platelet morphology and plasma indices of platelet activation in essential hypertension: effects of amlodipine-based antihypertensive therapy. Ann Med 2004; 36(7): 552-557. (PMID: 15513305) (doi: 10.1080/07853890410017386)
8. Pathansali R, Smith N, Bath P. Altered megakaryocyte-platelet haemostatic axis in hypercholesterolaemia. Platelets 2001, (12): 292-297. (PMID: 11487381) (doi: 10.1080/09537100120058810)
9. Kario K, Matsuo T, Nakao K. Cigarette smoking increases the mean platelet volume in elderly patients with risk factors for atherosclerosis.
Clin Lab Haematol 1992, (14): 281-287. (PMID: 1478007)
10. Abalı G, Akpınar O, Söylemez N. Correlation of the coronary severity scores and mean platelet volume in diabetes mellitus. Adv Ther 2014; 31(1): 140-148. (PMID: 24318519) (doi: 10.1007/s12325-013-0081-9) 11. Cetin M, Bakirci EM, Baysal E, Tasolar H, Balli M, Cakici M, et al.
Increased platelet distribution width is associated with ST-segment elevation myocardial infarction and thrombolysis failure. Angiology
2014, 65(8): 737-743. (doi: 10.1177/0003319713520068) (PMID: 24526792)
12. Vatankulu MA, Sonmez O, Ertas G, Bacaksiz A, Turfan M, Erdogan E, et al A new parameter predicting chronic total occlusion of coronary arteries: platelet distribution width. Angiology 2014, 65(1): 60-64. (doi: 10.1177/0003319713486339) (PMID: 23636855)
13. Johnson GG, Decker WW, Lob JK, Laudon DA, Hess JJ, Lohse CM, et al. Risk stratification of patients in an emergency department chest pain unit: prognostic value of exercise treadmill testing using the Duke score. Int J Emerg Med 2008, (1): 91-95. (PMID: 19384658) (doi: 10.1007/s12245-008-0031-5)
14. Vacanti LJ, Sespedes LB, Sarpi Mde O. Exercise stress testing is useful, safe, and efficient even in patients aged 75 years or older. Arq Bras Cardiol 2004; 82(2): 151-154, 147-150. (PMID: 15042251) (doi: 10.1590/S0066-782X2004000200006)
15. Youn HJ, Park CS, Moon KW, Oh YS, Chung WS, Kim JH, et al. Relation between Duke treadmill score and coronary flow reserve using transesophageal Doppler echocardiography in patients with microvascular angina. Int J Cardiol 2005; 98(3): 403-408. (PMID: 15708171) (doi: 10.1016/j.ijcard.2003.11.045)
16. Shaw LJ, Peterson ED, Shaw LK, Kesler KL, DeLong ER, Harrell FE Jr, et al. Use of a prognostic treadmill score in identifying diagnostic coronary disease subgroups. Circulation 1998; 98(16): 1622-1630. (PMID: 9778327) (doi: 10.1161/01.CIR.98.16.1622)
Authors:
Rasim Kutlu – Associate Professor, Department of Cardiology, Denizli State
[
Mehmet Erdem Memetoğlu – MD, Cardiovascular Surgeon, Department of
Cardiovascular Surgery, Dr.Siyami Ersek Cardiovascular and Thoracic Surgery Hospital, İstanbul, Turkey.
Murataliev Tolkun Muratalievic – MD, Professor, Department of
Cardiology, National Cardiology and Internal Medicine Institude, Bishkek, Kyrgyzstan.
Kadir Gökhan Saçkan – MD, Cardiovascular Surgeon, Department of
Cardiovascular Surgery, Denizli State Hospital, Denizli, Turkey.
Hasan Yaşar – MD, Department of Neurology, Denizli State Hospital,