Approximate performance analysis of generalized join the
shortest queue routing
Jori Selen
Eindhoven University of Technology, Netherlands[email protected]
Ivo Adan
Eindhoven University of Technology, Netherlands[email protected]
Stella Kapodistria
Eindhoven University of Technology, Netherlands[email protected]
ABSTRACT
In this paper we propose a highly accurate approximate per-formance analysis of a heterogeneous server system with a processor sharing (PS) service discipline and a general job-size distribution under a generalized join the shortest queue (GJSQ) routing protocol. The GJSQ routing proto-col is a natural extension of the well-known join the short-est queue (JSQ) routing policy that takes into account the non-identical service rates in addition to the number of jobs at each server. The performance metrics that are of inter-est here are the equilibrium distribution and the mean and standard deviation of the number of jobs at each server. We show that the latter metrics are near-insensitive to the job-size distribution using simulation experiments. By applying asingle queue approximation (SQA) we model each server as a single server queue with a state-dependent arrival pro-cess, independent of other servers in the system, and derive the distribution of the number of jobs at the server. These state-dependent arrival rates are intended to capture the in-herent correlation between servers in the original system and behave in a rather atypical way.
CCS Concepts
•Mathematics of computing→Queueing theory; Markov processes;•General and reference→ Perfor-mance;
Keywords
Heterogeneous servers; routing policy; approximations
1.
INTRODUCTION
1.1
Motivation
This work is motivated by web server farms. Server farms have gained popularity for providing scalable and reliable
computing and web services. Most commonly the objec-tive in analyzing such a system lies in the determination of an optimal or near-optimal load balancing routing proto-col so as to maximize the performance of the system, see, e.g., [1, 6, 8], where the performance of interest is usually the mean response time for an arbitrary job. In this paper the objective is to report some interesting properties of the arrival flow to each server and suggest an approximation ap-proach for the GJSQ routing protocol. We consider farms with heterogeneous servers, which is motivated by the differ-ent hardware and the wide variety of computing capacities regarding processing power and memory access performance seen in practice in server farms [13]. We assume that ser-vice requests arrive to the system according to a Poisson process. Upon arrival, a front-end dispatcher routes the re-quest to one of the servers. After the rere-quest has been routed to the server, we assume that it cannot balk or jokey. All requests routed to a server are sharing the provided service (think of bandwidth, CPU, or RAM). We assume a PS ser-vice discipline at each server since it closely approximates the scheduling policies [7, 10] employed by most commodity operating systems (e.g., Linux CPU time-sharing) and is a popular policy in computing centers (e.g., Cisco Local Di-rector, IBM Network Dispatcher and Microsoft Sharepoint, see [3] for a survey).
In [5] the authors consider a server farm consisting of ho-mogeneous servers, where upon arrival jobs are routed ac-cording to the JSQ routing protocol. This protocol in case of homogeneous servers, due to the PS service discipline, is performing near-optimal in terms of the mean response time. However, as indicated by Whitt in [15], the JSQ pol-icy is far from optimal in case of heterogeneous servers. In [2] the authors comment on the performance of various sys-tems under different routing protocols and conclude that the shortest expected delay (SED) routing protocol is near-optimal in terms of mean response time. The SED policy is a policy that routes jobs upon arrival to the queue promis-ing the minimum expected delay (which also includes the processing time). In case of exponential job-size distribu-tions, the GJSQ and SED routing protocols are identical and in case of homogeneous servers GJSQ and JSQ are the same. However, in case of general job-size distributions and heterogeneous servers we assume that the only available in-formation are the service rates and the number of jobs at each server, i.e. we do not keep track of residual processing times.
Due to the complexity and the various challenges that the model at hand presents, we restrict our analysis to the case
VALUETOOLS 2015, December 14-16, Berlin, Germany Copyright © 2016 ICST
of two heterogeneous servers with a general job-size distribu-tion under the GJSQ routing protocol. From here onwards we refer to this model as theM/G(1, s)/2/GJSQ/P S sys-tem, abbreviated as the GJSQ model, whereGis the job-size distribution and 1 andsare the service rates at servers 1 and 2, respectively. The approach described in this paper can be seen as a first stepping stone towards the analysis of hetero-geneous server farms with PS servers; a very broad area, full of interesting problems. Moreover, the ideas presented here extend the work of Gupta et al. [5] on the analysis of the JSQ routing for homogeneous web server farms.
1.2
Related work
To the best of our knowledge there is no previous math-ematical analysis of the GJSQ system. In [14], Selen et al. derive the joint equilibrium distribution of the num-ber of jobs at each server in theM/M(1, s)/2/SED/F CF S model. They prove that this distribution can be expressed as an infinite series of product forms using the compensation approach. The benefit of that approach is that it produces, by truncating the series expression, numerical results with an a priori set accuracy level. Unfortunately, the compen-sation approach is not appropriate (in its current setting) for multiple servers, nor for general job-size distributions. Before [14], very little was known regarding the mathemat-ical analysis of the SED policy. In [11], the authors suggest two models that act as upper and lower bounds to the SED system. However, they do not provide closed form expres-sions for the equilibrium distribution of these two bounding models, but only an algorithmic approach based on matrix analytic methods. Furthermore, in [4, 9], the authors show that the SED routing policy is asymptotically optimal in terms of the mean response time and results in complete resource pooling in the heavy traffic limit. This heavy traf-fic limit result may be used in a similar manner as in [12]. However, after a few numerical experiments, we concluded that this approximation in our case results in poor estimates and for this reason we did not proceed in this direction. On the contrary, the approach developed by Gupta et al. [5] on approximating the distribution of the number of jobs at each server, as we show in this paper, is appropriate for the GJSQ setting with heterogeneous servers. More concretely, in [5], the authors develop the SQA method that accurately determines the distribution of the number of jobs at each server by modeling each queue as anMn/M/1/P S system with state-dependent arrival rates. These state-dependent arrival rates are referred to as theconditional arrival rates and are constructed in such a way that they capture the inherent correlated behavior of the complete server farm.
1.3
Contributions
We believe that we provide the first approximate analysis of the equilibrium distribution and moments of the number of jobs at each server in the GJSQ system (and by Little’s law also the mean response time for an arbitrary job). More-over, the approximation is highly accurate: we encounter a maximum relative difference between the approximation and simulations of 2.2%. In deriving these approximations, we provide three key contributions:
1. The mean and standard deviation of the number of jobs at each server and the conditional arrival rates are near-insensitive to the job-size distribution. This allows us to study the more tractable model with an
exponential job-size distribution.
2. In case of an exponential job-size distribution, the SQA method yields the same equilibrium distribution for the number of jobs at each server as in the original GJSQ model.
3. For the application of the SQA method we present an approach for the derivation of the conditional arrival rates. In particular, we show that the conditional ar-rival rates, say λi(n), i = 1,2, n ∈ N0, to server 1
satisfy
λ1(n)→ρ1+sasn→ ∞, (1)
whereρis the load on the system, see Section 2, and the conditional rates to server 2 for largen oscillate betweens different points. Note that the former re-sult is similar to the rere-sult obtained in [5] for the case s= 1, however the latter result is very atypical and is discussed in greater detail in Section 2.3.
1.4
Outline
The rest of the paper is organized as follows. In Section 2 we give a detailed model description and formally define and investigate the time-average and conditional arrival rates. Section 3 is devoted to showing that the performance metrics of interest are near-insensitive to the job-size distribution. We describe the SQA and determine the conditional arrival rates in Section 4. The approximations are evaluated in Section 5. In Section 6 we present some conclusions.
2.
MODEL DESCRIPTION
2.1
Heterogeneous servers
We consider a system of two heterogeneous servers and a single dispatcher. The servers employ a PS service discipline and can have different service rates, i.e. server 1 has service rate 1 and server 2 has service rate s. Jobs arrive to the dispatcher according to a Poisson process with rate λ and are routed immediately to one of the servers. Jobs cannot switch servers after being routed. We detail the routing policy in Section 2.2. The size of a job is drawn from a general distributionG. Without loss of generality we assume that the mean job size is 1. Note that, for example, the (residual) processing time of a (residual) size G job that runs on server 2 that is currently servingq2jobs is given by
Gq2/s.
In what follows we assume that s is a positive integer number. In the general cases∈R+ we can bound the
cor-responding system by two systems with service rates given by the closest two integers tos.
2.2
Routing policy
The routing policy employed by the dispatcher is a state-aware policy, i.e. the dispatcher is state-aware of the number of jobs at each server just before an arrival instant,q1 andq2,
0.8 1
Server 2
s
1+s
0 0.2 0.4 0.6 0.8 1
0 0.2
Server 1
1 1+s
ρ
Figure 1: Simulated long-term fraction of jobs routed to serverias a function of the loadρ, where
s = 4 and the job-size distribution is exponential. Dashed lines represent expected behavior.
processing times of the jobs currently in service, and fur-thermore ignores future arrivals.
Under this routing policy, we define the load on this sys-tem as
ρ:=λ/(1 +s). (2) Throughout the rest of this paper we assume thatρ <1.
Although not necessarily optimal, GJSQ routing outper-forms JSQ routing when servers are non-identical. GJSQ routing attempts to balance the load on the servers by tak-ing into account the different service rates in addition to the information on the current number of jobs at each server. In Figure 1 we show that the long-term fraction of jobs routed to the two servers is a function of the loadρ. In light traffic GJSQ assigns all jobs to the fast server and in heavy traffic the load is divided proportionally according to the service rates. This is in contrast with JSQ routing, which assigns a long-term fraction of the jobs to server 1 that decreases from 1/2 to 1/(1 +s) for increasing loadρ(verified through simulation).
2.3
Arrival rates
We briefly introduce two important concepts related to the (time-average) arrival rates to each server. These concepts will be used throughout the paper.
Definition 1. In the GJSQ model, the time-average ar-rival rateto serveriis defined as
λi:= lim t→∞
Ai(t)
t , (3)
whereAi(t) is the number of arrivals at serveriduring the time interval [0, t].
Definition 2. In the GJSQ model, theconditional arrival rateto serveri, given that serverihasnjobs, is defined as
λi(n) := lim t→∞
Ai,n(t) Ti,n(t)
, (4)
where Ai,n(t) is the number of arrivals at server i during the time interval [0, t] that seenjobs at serverion arrival (excluding themselves), andTi,n(t) is the total time spent by serveriwithnjobs during the time interval [0, t].
The two definitions above are related. Assuming it exists, letπi(n) be the equilibrium probability that there arenjobs at serveri, thenλi=P∞n=0λi(n)πi(n).
0 3 6 9 12
2 2.5
n
λ2
(
n
)
(a)s= 3, ρ= 0.7, λ= 2.8
0 4 8 12 16
2.5 3 3.5
n
λ2
(
n
)
(b)s= 4, ρ= 0.7, λ= 3.5
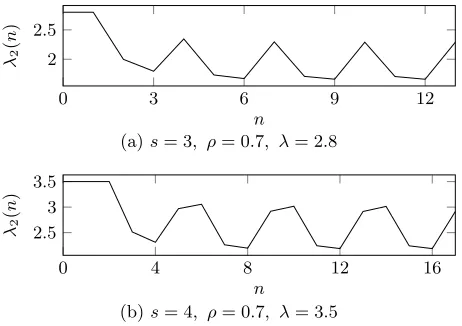
Figure 2: The conditional arrival rates to server 2 oscillate betweens points.
Figure 2 depicts the conditional arrival rates to server 2 for varyings. Intuitively it makes sense that if a server has many jobs, the other server will probably have few jobs and thus it is less likely that the dispatcher routes the job to that server. However, what we see here is a peculiar repeating pattern that hass different points and does not align with this intuition. We see that if server 2 has a multiple of s jobs (or one less), fewer jobs are routed to server 2. This pattern is difficult to explain, but it is definitely related to the probability that server 1 has a lower index than server 2, given that server 2 currently has njobs. We expect and indeed verify that this probability also follows such a repeat-ing pattern. Additionally, states in server 2 are somewhat similar if they differ by a multiple ofs jobs, which can be derived from the equilibrium distribution in [14].
3.
NEAR-INSENSITIVITY
In [5] the authors establish a near-sensitivity property in the setting of a homogeneous server farm with JSQ rout-ing. In particular, the first and second moment of the num-ber of jobs at serveri,Qi, and the conditional arrival rates are insensitive to the job-size distribution. The near-insensitivity of these two metrics seems related to the insen-sitivity of the equilibrium distribution to the job-size distri-bution in PS servers, see, e.g., Theorem 4.2 in [5]; and the fact that the routing policy only uses the number of jobs at each server when making a decision, as opposed to, e.g., us-ing residual processus-ing times. The GJSQ routus-ing decisions are based on the dynamically changing number of jobs at each server as well as the service rates. Indeed, one expects the near-insensitivity properties to extend also to the case of heterogeneous servers and GJSQ routing. Establishing this near-insensitivity property is important, since it allows us to limit our attention to the more tractable GJSQ system with an exponential job-size distribution.
3.1
Simulation settings
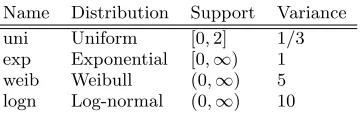
To support our claims, we simulate the GJSQ model. A simulation consists of 2·106 job departures and each
Name Distribution Support Variance
uni Uniform [0,2] 1/3
exp Exponential [0,∞) 1
weib Weibull (0,∞) 5
logn Log-normal (0,∞) 10
Table 1: Job-size distributions used in simulations.
3.2
Near-insensitivity results
In Table 2 we show simulated statistics on the mean and standard deviationσ(·) ofQifor the GJSQ model with var-ious job-size distributions. For the settings considered in Table 2, the mean number of jobs at serverideviates by no more than 3.6% from the exponential case, while the stan-dard deviation deviates by at most 4.4%. The largest de-viations from the exponential case occur for the log-normal job-size distribution. This is as expected, since this job-size distribution has a variance that is 10 times higher than the variance of the exponential job-size distribution. Although the results are not as strong as those shown in Figure 3 of [5], we conclude that the more volatile environment of heterogeneous servers and GJSQ routing also has the near-insensitivity property forE[Qi] and σ(Qi). Moreover, the performance in terms of the mean response time is also near-insensitive to the job-size distributions by Little’s law.
Concerning the conditional arrival rates, we see in Fig-ure 3 that the simulated values for the job-size distributions of Table 1 match the results of the algorithm for the ex-ponential case [14]. Simulated values for states where the sample standard deviation is not too high differ by at most 5% from the results for the exponential case. So, also the conditional arrival rates are near-insensitive to the job-size distribution.
4.
SINGLE QUEUE APPROXIMATION
We have established near-insensitivity ofE[Qi],σ(Qi) and the conditional arrival rates to the job-size distributions. Thus, we may limit our attention to systems with an ex-ponential job-size distribution. In this section we derive an approximation for the distribution of the number of jobs at each server using the SQA, which models server i as anMn/Mi/1/P S queue with state-dependent arrival rates λi(n), see also Section 3 in [5]. SQA is exact when the job-size distribution is exponential and the routing belongs to a specific class of routing policies; the following theorem is a version of Theorem 3.1 in [5] that is applicable to the GJSQ model.
Definition 3. A stationary state-aware routing policy is a time-stationary routing policy that only uses information about the number of jobs at the servers and the service rates at the instant of an arrival. The decisions may be made probabilistically, possibly biased in favor of certain servers.
Theorem 1. Consider the M/M(1, s)/2/R/S queueing model, whereRis any stationary state-aware routing policy, e.g. GJSQ, andSis any stationary, size-independent, work-conserving service discipline, e.g. PS. Consider serveriin this model. Then SQA with the exact conditional arrival rates λi(·) yields the same equilibrium distribution for the number of jobs at each server as in the original model.
It remains to specify the conditional arrival ratesλi(n) for both servers. We combine exact limiting results forn≥Ni
0 4 8 12 16 20
0 2 4
Server 2
Server 1
n
uni weib logn
(a)ρ= 0.7, s= 4, λ= 3.5
0 4 8 12 16 20
0 2 4
Server 2
Server 1
n
uni weib logn
(b)ρ= 0.9, s= 4, λ= 4.5
Figure 3: Simulated conditional arrival rates in the GJSQ system with various job-size distributions. The dotted curves represent values determined by the algorithm in [14] for the exponential job-size dis-tribution.
and approximation results for n < Ni, where N1 = 3 and
N2 = 2s. These choices for Ni result in accurate approxi-mations.
We note that Theorem 1 implies that in order to determine the conditional arrival rates, we may assume a FCFS service discipline.
In Figure 2 we have seen that the conditional arrival rates λi(n) exhibit a repeating pattern from somenand onwards. We rigorously characterize this limiting repeating pattern in the next theorem.
Theorem 2. For theM/M(1, s)/2/GJSQ/P S queueing
model withs∈N,
lim
n→∞λ1(n) =ρ
1+s, (5)
lim
n→∞λ2(sn+r) =
(
sAA(r(+1)r) , r= 0,1, . . . , s−2, sρ1+s A(0)
A(s−1), r=s−1,
(6)
where
A(r) = s
X
i=1
ηi βi ρ1+s−βii+(ρ
1+s, β
i, r) +h(r)
+ βs+1 1−βs+1
i−(ρ
1+s
, βs+1, r), (7)
and the variablesβ1, . . . , βs+1,η1, . . . , ηs, and the functions h(·),i+(·),i−(·)are defined in Lemma 5.11 in [14].
Proof. See Appendix A.
For the ratesλ1(n), n <3 andλ2(n), n <2swe provide
Job-size distribution SQA
s ρ Metric uni exp weib logn Value Diff.
2 0.7 E[Q1] 0.9139 (0.0030) 0.9232 (0.0030) 0.9223 (0.0029) 0.9361 (0.0038) 0.9077 1.7%
σ(Q1) 1.0404 (0.0049) 1.0505 (0.0050) 1.0560 (0.0056) 1.0704 (0.0067) 1.0462 0.4%
E[Q2] 2.0111 (0.0059) 2.0289 (0.0061) 2.0222 (0.0057) 2.0519 (0.0074) 2.0329 −0.2%
σ(Q2) 2.0302 (0.0099) 2.0465 (0.0106) 2.0506 (0.0114) 2.0813 (0.0141) 2.0484 −0.1%
0.9 E[Q1] 3.2244 (0.0336) 3.2797 (0.0336) 3.2316 (0.0298) 3.2396 (0.0266) 3.2188 1.9%
σ(Q1) 3.2208 (0.0590) 3.2716 (0.0723) 3.2186 (0.0575) 3.2002 (0.0505) 3.2161 1.7%
E[Q2] 6.6841 (0.0676) 6.7915 (0.0674) 6.6834 (0.0587) 6.6988 (0.0524) 6.6424 2.2%
σ(Q2) 6.4289 (0.1185) 6.5288 (0.1453) 6.4186 (0.1141) 6.3828 (0.1016) 6.4091 1.9%
4 0.7 E[Q1] 0.4688 (0.0016) 0.4747 (0.0017) 0.4705 (0.0017) 0.4667 (0.0022) 0.4741 0.1%
σ(Q1) 0.6685 (0.0024) 0.6730 (0.0026) 0.6700 (0.0029) 0.6652 (0.0031) 0.6655 1.1%
E[Q2] 2.5386 (0.0063) 2.5507 (0.0069) 2.5177 (0.0070) 2.4997 (0.0067) 2.5866 −1.4%
σ(Q2) 2.5082 (0.0102) 2.5179 (0.0115) 2.4936 (0.0133) 2.4744 (0.0122) 2.5457 −1.1%
0.9 E[Q1] 1.8662 (0.0191) 1.8793 (0.0145) 1.8830 (0.0196) 1.9400 (0.0223) 1.8813 −0.1%
σ(Q1) 1.9404 (0.0338) 1.9539 (0.0314) 1.9801 (0.0444) 2.0394 (0.0408) 1.9566 −0.1%
E[Q2] 8.2405 (0.0769) 8.2773 (0.0597) 8.2631 (0.0783) 8.4863 (0.0861) 8.3642 −1.0%
σ(Q2) 7.6982 (0.1374) 7.7507 (0.1264) 7.8485 (0.1815) 8.0912 (0.1652) 7.7692 −0.2%
Table 2: Simulated mean and standard deviation ofQi, for the GJSQ system with various s, ρ and job-size
distributions. Sample standard deviation is shown in parentheses. Last two columns show the value obtained by the SQA and the relative difference with respect to the exponential case.
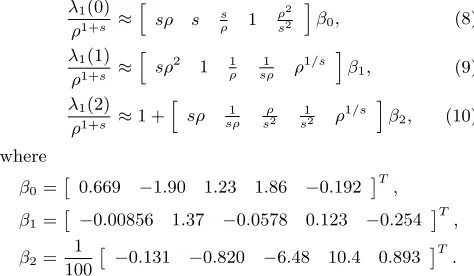
1 we use a multiple linear regression model to fit an ap-proximate function for the conditional arrival rates on data obtained from the algorithm in [14] fors= 1,2,3,4 andρ from 0.3 to 0.99. Obviously, one can also use conditional arrival rates obtained by simulation for these fitting pur-poses. We carefully select a set of 5 independent variables for each conditional arrival rate. This leads to the following approximate conditional arrival rates for server 1:
λ1(0)
ρ1+s ≈
h
sρ s s
ρ 1
ρ2
s2 i
β0, (8)
λ1(1)
ρ1+s ≈
h
sρ2 1 1
ρ
1
sρ ρ
1/s iβ
1, (9)
λ1(2)
ρ1+s ≈1 +
h
sρ sρ1 sρ2
1
s2 ρ
1/s i
β2, (10)
where
β0= 0.669 −1.90 1.23 1.86 −0.192 T,
β1= −0.00856 1.37 −0.0578 0.123 −0.254 T,
β2=
1 100
−0.131 −0.820 −6.48 10.4 0.893 T
.
For s = 1, one should consider λ1(·) = λ2(·) and use the
approximations presented in (8)-(10).
For server 2, let us note thatλ2(n) =λ, n= 0, . . . , s−2
due to the GJSQ routing. Using a multiple regression model in this case is more difficult, since the number of states for which we need to obtain a fit increases withs. To circum-vent a possibly complex fitting procedure, we establish a relation between the conditional arrival rates for the states n=s−1, s, . . . ,2s−1 and the limiting conditional arrival rates determined in Theorem 2. Namely,
λ2(n)≈
1 + 1 s −
ρ 2s−1
1
2n−(s−1)
λlim2 (n−s), (11)
where for convenienceλlim
2 (r) is defined as the right-hand
side of (6) andλlim
2 (−1) =λlim2 (s−1). The approximations
(8)-(11) behave in various limiting regimes as expected:
Proposition 3.
1. For s → ∞, we have that λ1(n) ↓ 0 and λ2(n) = λ
for all n ∈ N0. No job will join server 1, since the
processing times in server 2 are instantaneous.
2. In the light-traffic regime, i.e. ρ ↓ 0, we find that λ1(n)↓0, n∈N0 andλ2(n)↓0, n≥s−1.
3. In the heavy-traffic regime, i.e.ρ↑1, we establish that λ1/λ= 1/(1 +s)andλ2/λ=s/(1 +s)which is
con-sistent with the findings in Figure 1.
Proof. 1. Follows straightforwardly by taking the limit
s→ ∞in (8)-(10) while taking into account thatρ=λ/(1+ s). Furthermore, observe thatλ2(n) =λ, n= 0, . . . , s−2,
so that lims→∞λ2(n) =λ, n∈N0.
2. See Appendix B.
3. From the approximate conditional arrival rates λ1(·)
one can derive (approximate) equilibrium probabilitiesπ1(·).
Then,λ1=P∞n=0λ1(n)π1(n) =P∞n=0π1(n+ 1) = 1−π1(0)
by exploiting the balance equations. Forρ↑1 it can be ver-ified that π1(0)↓0, so that limρ↑1λ1/λ= 1/(1 +s). The
result for server 2 follows analogously.
5.
EVALUATING THE APPROXIMATION
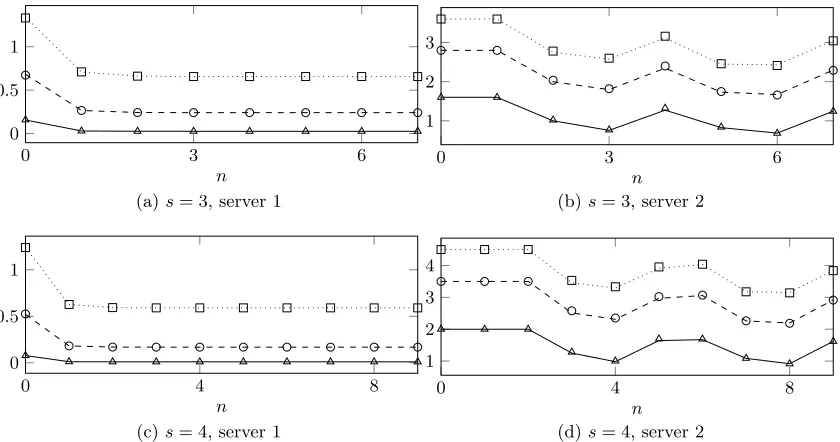
We are now in a position to evaluate the proposed ap-proximations. First, we show that the approximations for the conditional arrival rates follow closely the exact values, which were determined using the algorithm in [14]. Second, we establish that the mean and standard deviation of the number of jobs at each server is also well approximated.
Figure 4 compares the conditional arrival rates obtained from the algorithm in [14] and the approximations derived in the previous section. For the cases considered in the fig-ure, the maximum relative difference of the approximation with respect to the values determined by the algorithm is 1.5% forλ1(·) and 4.1% forλ2(·). Since both methods
0 3 6 0
0.5 1
n (a)s= 3, server 1
0 3 6
1 2 3
n (b)s= 3, server 2
0 4 8
0 0.5 1
n (c)s= 4, server 1
0 4 8
1 2 3 4
n (d)s= 4, server 2
Figure 4: Comparison of conditional arrival rates determined by the algorithm in [14] (lines) and our approx-imations (marks) forρ= 0.4( , ),ρ= 0.7( , ), andρ= 0.9( , ).
error has been chosen to be of the order 10−5, it has little
influence.
In the two rightmost columns of Table 2 we provide the mean and standard deviation of the number of jobs at both servers determined using the SQA. We report highly accu-rate approximations that deviate less than 2.2% from the case with an exponential job-size distribution for the listed values of s and ρ. Although our approximations are not aimed at the cases= 1, we report accurate approximations also in this setting with maximum relative differences of the same order as in Section 6.1 of [5].
6.
CONCLUSION
In this paper, we provide an approximate performance analysis of a queueing system consisting of two heteroge-neous PS servers with service rates 1 ands∈N, respectively,
a general job-size distribution and GJSQ routing. More con-cretely, we derived the approximate equilibrium distribution of the number of jobs at each server using the SQA method. In order to apply SQA, we established that the GJSQ system is near-insensitive to the job-size distribution and thus we approximated the system at hand with exponentially dis-tributed job-sizes. We then approximated the conditional arrival rates for the exponential case, by combining exact limiting results for large number of jobs and approxima-tion results, which were obtained using a multiple linear regression model, for small number of jobs. Ultimately, the aforementioned approach resulted in approximations that are highly accurate; we reported a maximum relative dif-ference with respect to exact or simulation results of 4.1% for the conditional arrival rates and 2.2% for the mean and standard deviation of the number of jobs at each server.
In this paper we set the groundwork for the analysis of server farms with heterogeneous servers under the GJSQ routing policy by analyzing the case of two servers. Of course, server farms consist of multiple servers so it is in
0 5 10 15
0 1 2 3
n
Figure 5: Simulated conditional arrival rates for a system with three servers with service rates 1 ( ), 2 ( ), and 5 ( ), withρ= 0.7.
our future plans to extend the analysis presented in this pa-per to more than two servers. The most difficult aspect of this task would be the derivation of the conditional arrival rates, which possibly has to rely on simulation data, since the approach in [14] is in its current setting restricted to two servers. In Figure 5 we present an example of the simulated conditional arrival rates in case of three servers with service rates 1, 2 and 5. Note that the structure of the conditional arrival rates is as expected, i.e. the number of points in the repeating pattern is directly related to the rate of service, but the exact values of these points differ from the values obtained by formulas (5) and (6).
7.
ACKNOWLEDGMENTS
This work was supported by an NWO free competition grant and the NWO Gravitation Project NETWORKS.
8.
REFERENCES
[2] S.A. Banawan and J. Zahorjan. Load sharing in heterogeneous queueing systems. InIEEE INFOCOM ’89, pages 731–739, 1989.
[3] V. Cardellini, E. Casalicchio, M. Colajanni, and P.S. Yu. The state of the art in locally distributed web-server systems.ACM Computing Surveys, 34(2):263–311, 2002.
[4] G.J. Foschini and J. Salz. A basic dynamic routing problem and diffusion.IEEE Transactions on Communications, 26(3):320–327, 1978. [5] V. Gupta, M. Harchol-Balter, K. Sigman, and
W. Whitt. Analysis of join-the-shortest-queue routing for web server farms.Performance Evaluation, 64(9):1062–1081, 2007.
[6] M. Harchol-Balter.Performance Modeling and Design of Computer Systems: Queueing Theory in Action. Cambridge University Press, 2013.
[7] M. Harchol-Balter, B. Schroeder, N. Bansal, and M. Agrawal. Size-based scheduling to improve web performance.ACM Transactions on Computer Systems, 21(2):207–233, 2003.
[8] E. Hyyti¨a, A. Penttinen, and S. Aalto. Size- and state-aware dispatching problem with queue-specific job sizes.European Journal of Operational Research, 217(2):357–370, 2012.
[9] C.N. Laws. Resource pooling in queueing networks with dynamic routing.Advances in Applied Probability, 24(3):699–726, 1992.
[10] Z. Liu, M.S. Squillante, and J.L. Wolf. On maximizing service-level-agreement profits. InACM conference on Electronic Commerce, pages 213–223. ACM, 2001. [11] J.C.S. Lui, R.R. Muntz, and D. Towsley. Bounding
the mean response time of the minimum expected delay routing policy: An algorithmic approach.IEEE Transactions on Computers, 44(12):1371–1382, 1995. [12] R.D. Nelson and T.K. Philips. An approximation to
the response time for shortest queue routing. In SIGMETRICS ’89, pages 181–189, 1989.
[13] M.C. Ortiz. Building the dynamic data center.Dell Power Solutions, 03:50–53, 2010.
[14] J. Selen, I.J.B.F. Adan, S. Kapodistria, and J.S.H. van Leeuwaarden. Steady-state analysis of shortest expected delay routing. arXiv:1509.03535v2, 2015. [15] W. Whitt. Deciding which queue to join: Some
counterexamples.Operations Research, 34(1):55–62, 1986.
APPENDIX
A.
PROOF OF THEOREM 2
The proof is based on the exact results of the related M/M(1, s)/2/SED/F CF S system, withs ∈ N, presented
in [14]. Although we obtain similar results for the limiting conditional arrival rates for server 1 as in [5], we use here a completely different approach in deriving the limits.
In [14], the state space {(q1, q2) | (q1, q2) ∈ N20} of the
Markov process is transformed to the state space{(m, n, r)|
m∈N0, n∈Z, r= 0,1, . . . , s−1}wherem= min(q1,bqs2c),
n=bq2
sc −q1andr= mod(q2, s). Let us denote the equilib-rium probabilities for the three-dimensional state space as p(m, n, r). The equilibrium probability p(m, n, r) has a se-ries expression, i.e. p(m, n, r) = P∞
l=0x(l, m, n, r), namely,
form≥0, n≥1,
p(m, n, r) =C ∞
X
l=0 (s+1)l
X
i=1
s
X
j=1
βl,dn(i)+j ηl,d(i)+jαml,i
+νl+1,d(i)+jαml+1,d(i)+j
i+(αl,i, βl,d(i)+j, r). (12) Form≥0,
p(m,0, r) =C ∞
X
l=0 (s+1)l
X
i=1
αml,ihl,i(r). (13)
Form≥0, n≤ −1, p(m, n, r) =
C ∞
X
l=0 (s+1)l
X
i=1
ηl,i(s+1)αml,iβ
−n
l,i(s+1)i−(αl,i, βl,i(s+1), r)
+C ∞
X
l=0 (s+1)l
X
i=1
νl+1,i(s+1)αml+1,i(s+1)β
−n l,i(s+1)×
i−(αl+1,i(s+1), βl,i(s+1), r). (14)
For the exact interpretation of each variable we refer the reader to [14]. In [14] the authors establish the following properties:
1. There exists a positive integer N such that p(m, n, r) converges absolutely for allm≥0, |n| ≥1 withm+
|n|> N.
2. For m+|n| > N, we have |x(l, m, n, r)| < u(l) and
P∞
l=0u(l)<∞.
3. The seriesP
m+|n|>Np(m, n, r), r= 0,1, . . . , s−1 con-verges absolutely.
4. |αl,i| > |βl,d(i)+j| and |βl,i| > |αl+1,i| with α0,1 =
ρ1+s<1.
In this proof we make use of the dominated convergence theorem for complex-valued functions.
A.1
Server 1
The limiting conditional arrival rate to server 1 can be determined from
lim
n→∞λ1(n) = limn→∞
π1(n+ 1)/αn0,+11
π1(n)/αn0,1
α0,1. (15)
The marginal distribution for server 1 is given by, where m=bq2
scandr= mod(q2, s),
π1(n) =
∞
X
m=0
s−1
X
r=0
p(min(n, m), m−n, r)
= n−1
X
m=0
s−1
X
r=0
p(m, m−n, r) + s−1
X
r=0
p(n,0, r)
+ ∞
X
m=1
s−1
X
r=0
p(n, m, r). (16)
Furthermore,
lim n→∞
π1(n)
αn
0,1
= lim n→∞
n−1
X
m=0
s−1
X
r=0
p(m, m−n, r) αn
+ s−1
X
r=0
lim n→∞
p(n,0, r) αn
0,1
+ ∞
X
m=1
s−1
X
r=0
lim n→∞
p(n, m, r) αn
0,1
, (17)
where the interchange of the limit and the series for the third term on the right-hand side of (17) is allowed by the dominated convergence theorem, because one can bound p(n, m, r) from above by p(0, m, r) and P∞
m=0p(0, m, r) <
∞since it is a subseries ofP
m+|n|>Np(m, n, r), which con-verges absolutely by property 3. Furthermore, we know that limm→∞p(m, n, r) = limm→∞P∞l=0x(l, m, n, r) which is equal toP∞
l=0limm→∞x(l, m, n, r) by the dominated con-vergence theorem for complex-valued functions in combina-tion with property 2. This allows us to compute the second and third term on the right-hand side of (17). The first term on the right-hand side of (17) can be determined as follows
lim n→∞
n−1
X
m=0
s−1
X
r=0
p(m, m−n, r) αn
0,1
=Clim n→∞
∞
X
l=0 (s+1)l
X
i=1
ηl,i(s+1)
α
l,i α0,1
n
−βl,i(s+1)
α0,1 n
αl,i βl,i(s+1) −1
×
s−1
X
r=0
i−(αl,i, βl,i(s+1), r)
+ lim n→∞
∞
X
l=0 (s+1)l
X
i=1
νl+1,i(s+1)
β
l,i(s+1)
α0,1 n
−αl+1,i(s+1)
α0,1 n
1−αl+1,i(s+1)
βl,i(s+1)
×
s−1
X
r=0
i−(αl+1,i(s+1), βl,i(s+1), r)
=C αη00,1,s+1
β0,s+1 −1
s−1
X
r=0
i−(α0,1, β0,s+1, r). (18)
Interchange of the limit and series is again allowed here since one can bound the absolute value of the summands from above by v(l) for sufficiently largen and P∞
l=0v(l) < ∞.
One can finally establish that
lim n→∞
π1(n)
αn
0,1
=C αη00,1,s+1
β0,s+1−1
s−1
X
r=0
i−(α0,1, β0,s+1, r)
+ s−1
X
r=0
h0,1(r) +
s
X
j=1
η0,jβ0,j 1−β0,j
s−1
X
r=0
i+(α0,1, β0,j, r)
. (19)
Thus, by (15) and (19), limn→∞λ1(n) =α0,1=ρ1+s.
A.2
Server 2
The limiting conditional arrival rate to server 2 can be de-termined from limn→∞λ2(sn+r), where, forr= 0,1, . . . , s−
2,
lim
n→∞λ2(sn+r) = limn→∞s
π2(sn+r+ 1)/αn0,1
π2(sn+r)/αn0,1
(20)
and forr=s−1,
lim
n→∞λ2(sn+r) = limn→∞s
π2(sn+r+ 1)/αn0,+11
π2(sn+r)/αn0,1
α0,1. (21)
The marginal distribution for server 2 is given by, for r =
0,1, . . . , s−1,
π2(sn+r) =
∞
X
q1=0
p(min(q1, n), n−q1, r)
= n−1
X
q1=0
p(q1, n−q1, r) +p(n,0, r) +
∞
X
q1=1
p(n,−q1, r). (22)
Forπ2(sn+r+ 1), r=s−1 we should replacenbyn+ 1
andrby 0 in (22). Furthermore, forr= 0,1, . . . , s−1,
lim n→∞
π2(sn+r)
αn
0,1
= lim n→∞
n−1
X
q1=0
p(q1, n−q1, r)
αn
0,1
+ lim n→∞
p(n,0, r) αn
0,1
+ lim n→∞
∞
X
q1=1
p(n,−q1, r)
αn
0,1
. (23)
Using identical arguments as for the limiting conditional ar-rival rate for server 1, we establish forr= 0,1, . . . , s−1,
lim n→∞
π2(sn+r)
αn
0,1
=A(r), (24)
whereA(r) is given in (7). Finally, combining (20)-(21) and (24) proves (6).
B.
PROOF OF PROPOSITION 3, POINT 2
By lettingρ↓0 in (8)-(10) andλ1(n)≈ρ1+s, n≥3 we
immediately find thatλ1(n)↓0, n∈N0.
We note that in (11) the factors on the right-hand side in front ofλlim
2 (n−s) go to a constant forρ↓0. So, what
remains is that we establish that limρ↓0λlim2 (r) = 0, r =
0,1, . . . , s−1. This part of the proof relies heavily on the asymptotic results of [14]. We denoteα=ρ1+s and investi-gate forr= 0,1, . . . , s−1,
A(α, r) αr/s =
s
X
i=1
ηi βi/α 1−βi/α
ui βi α
r/s
+α1/s h(r) α(r+1)/s
+α1−r/s βs+1/α 1−βs+1
i−(α, βs+1, r), (25)
where we used that i+(α, βi, r) = uiβr/si with ui the i-th unit root of us = 1, which is established in Lemma 5.6 of [14]. Now,
lim α↓0
A(α, r)
αr/s =c(r), (26) where c(r) is some constant. In the following we denoteci as some constant that can be a function ofr. Equation (26) follows from the fact that forα ↓0 we have that βi/α→ c1<1, i= 1,2, . . . , s,βs+1/α→c2 (Lemma 5.15(i)(a) and
(i)(c) of [14]);h(r)/α(r+1)/s→c3(r) (Appendix B, part (c)
of [14]); i−(α, βs+1, r) →c4(r) (Lemma 5.15(i)(d) of [14]);
βs+1→0 (Corollary 5.14 in [14]); andPsi=1ηiui→c5(α↓0
in (5.46) of [14]).
Finally, forr= 0,1, . . . , s−2,
lim α↓0
A(α, r+ 1) A(α, r) = limα↓0
α(r+1)/s αr/s
A(α, r+ 1)/α(r+1)/s A(α, r)/αr/s
= lim α↓0α
1/sc(r+ 1)
c(r) = 0 (27)
and forr=s−1, lim α↓0α
A(α,0)
A(α, s−1) = limα↓0α
1/s c(0)