© 2018 IJSRSET | Volume 4 | Issue 1 | Print ISSN: 2395-1990 | Online ISSN : 2394-4099 Themed Section : Engineering and Technology
Enhancing of DBSCAN by Using Optics Algorithm in Data
Mining
1Y. Vijay Bhaskar Reddy, 2 Dr. L. S. S. Reddy
1
Research Scholar, Rayalaseema University, Kurnool, Andhra Pradesh, India 2
Vice Chancellor, KL University, Vaddeswaram. Guntur, Andhra Pradesh, India
ABSTRACT
DBSCAN is Partitional type clustering method. Here, more dense regions are considered as clusters and remaining area is called noise. The cluster is defined on some components like noise, core region and border. DBSCAN is resistant to noise. It can handle different clusters with various sizes and shapes. There are a lot of clusters that DBSCAN can discover which are unable to find by using K- Means clustering algorithm. But, DBSCAN does not work well when we deal with clusters of „varying densities‟ and „high dimensional data‟. It is sensitive to clustering parameters like MinPts and Eps values. To overcome this we are using OPTICS technique. DBSCAN technique takes high time for formation of clustering. To enhancing this; we are discussing about OPTICS clustering algorithms.
Keywords : Density based clustering, DBSCAN, OPTICS, Connectivity, Datasets.
I. INTRODUCTION
DM is the technique of extracting data from Huge amount of data. In this process we have so many methods to extract various types‟ of data. So, under sufficient computational adequacy obstructions, convey a particular distinguishing proof of cases over the data[1]. Getting the articles or information from different data bases into critical sub-classes is called clustering. This method is one of the best genuine data mining techniques. Cluster examination separates data from social gatherings (Groups) is very important. In the event that important gatherings are objectives, at that point group should catch the normal structure of the information. In a few cases, in any case, group investigation is just valuable as beginning point for the other reason, for example, information outline. So, the meaning of grouping is defined as "the way towards sorting out of objects into clusters where individuals are comparable". Along these lines a
group can be an accumulation of items which are comparative amongst them and disparate with different groups. Clustering algorithm need to fulfil following necessity: Scalability, distinctive sorts of trait, discovering groups with discretionary shape, space learning to decide input parameter, capacity to deal with clamour and ease of use. Group investigation is not a particular calculation but rather includes general errand to be settled what's more, it is iterative procedure of information revelation that includes trial and disappointment.
Clustering Algorithm can be arranged in light of their cluster show, which depends on how they shape clusters or gatherings. This instructional exercise just features a portion of the unmistakable clustering algorithm.
information focuses more distant away[2]. The groups are framed by interfacing information indicates agreeing their separation. At various separations, diverse groups will frame and can be spoken to utilizing a dendrogram, which gives away why they are likewise usually called "progressive clustering". These techniques don't deliver a one of a kind dividing of the dataset, rather an order from which the client still needs to pick proper groups by picking the level where they need to cluster. They are likewise not exceptionally powerful towards anomalies, which may appear as extra clusters or even reason different groups to combine.
Centroid-based clustering: In this kind of clustering, groups are spoken to by a focal vector or a centroid[3]. This centroid may not really be an individual from the dataset. This is an iterative clustering algorithm in which the idea of closeness is inferred by how shut an information point is to the centroid of the group. K-means is a centroid based grouping, and will you see this theme more in detail later on in the instructional exercise.
Distribution based clustering: This grouping is firmly identified with measurements called distributional demonstrating. Clustering depends on the idea of how likely is it for an information point to have a place with a specific dispersion, for example, the Gaussian appropriation, for instance. Information indicates in a group have a place a similar dissemination. These models have a solid theoretical establishment; be that as it may they regularly experience the ill effects of over fitting. Gaussian blend models, utilizing the desire amplification algorithm is an acclaimed appropriation based clustering technique.
Density based clustering: It search the information space for regions of changed density of information focuses. Clusters are characterized as regions of higher density inside the information space contrasted with different areas. Information focuses in the scanty territories are
typically thought to be commotion or potentially fringe focuses. DBSCAN and OPTICS are some unmistakable density based clustering.
II. Related Work
DBSCAN and OPTICS are two of the most understood density based clustering algorithms. An intriguing property of density based clustering is that these algorithms don't accept groups to have a specific shape[4]. Moreover, the calculations permit "noise" questions that don't have a place with any of the groups. K-means for illustrations parcels the information space in Voronoi cells (a few people assert it produces circular groups - that is off base). For the genuine state of K-means clusters and an illustration that cannot be grouped by K-means. Inside measures for group assessment likewise generally expect the clusters to be all around isolated circles (and don't permit noise/outlier v questions) - of course, as we tend to try different things with manufactured information produced by various Gaussian disseminations.
The key parameter to DBSCAN and OPTICS is the "minPts" parameter. It generally controls the base size of a bunch. In the event that you set it too low, everything will progress toward becoming bunches (OPTICS with minPts=2 savages to a sort of single connection grouping). On the off chance that we set it too high, sooner or later there won't be any bunches any longer, just clamour. Be that as it may, the parameter ordinarily isn't difficult to pick. On the off chance that we for instance anticipate that groups will normally have some articles.
evident, or we may require various esteems. That is when OPTICS becomes an integral factor.
OPTICS depends on an exceptionally shrewd thought; rather than settling MinPts and the Radius, we just fix minPts, and plot the range at which a protest would be viewed as thick by DBSCAN. Keeping in mind the end goal to sort the articles on this plot, we process them in a need pile, with the goal that close-by objects are close-by in the plot. This picture on Wikipedia demonstrates a case for such a plot.
OPTICS includes some significant downfalls contrasted with DBSCAN. To a great extent on account of the need pile, yet in addition as the closest neighbour inquiries are more muddled than the range questions of DBSCAN. So it will be slower, however you never again need to set the parameter epsilon. Be that as it may, OPTICS won't create a strict apportioning[5]. Basically it delivers different plots, and much of the time we will really need to outwardly assess the plots. There are a few techniques to separate a various levelled dividing out of these plots, in light of distinguishing "soak" regions.
Algorithm of OPTICS:
OPTICS creates an ordering of different objects in various databases and stores them for different places. This considers mainly for 2 components. They are
a) Different core distances. b) Reachability distances.
From the closest core object Eps; where objects have been directly connected with density- reached point[6]. This data is sufficient for the extraction of all density-primarily based clustering with admire to any distance ε. This value is smaller than ε used in producing the order.
Function optics (Eps, MinPts, D)
-->it shown for different not-processed points like p of D
N=getNeighbours (p, G, Eps) -->display p as processed one
p.reachability - distance= UNDEFINED -->Set core-distance of p
-->output p to the ordered list If (p.core-distance! =UNDEFINED) Seeds=empty priority queue Update (N, p, Seeds, Eps, MinPts) -->for each next q in Seeds
N'=getNeighbours (G, q, Eps) -->mark q as processed -->Set core-distance of q
-->output q finally to the ordered list If (q. core-distance! =UNDEFINED) Update (q, N', Seeds, Eps, MinPts)
Where D-Dataset
Eps-radius for neighbouring points
MinPts-minimum points within Eps distance.
In the below figure we can understand that different clusters with varying density sizes. Out of the clusters can be defined as noise and outliers.
Fig 1: Cluster with different density parameters
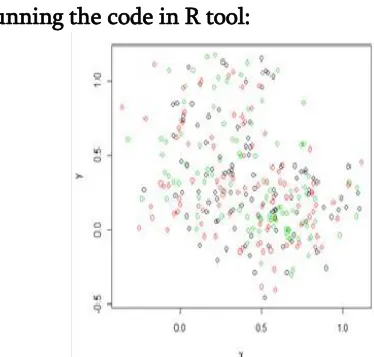
Running the code in R tool:
Fig3: Produces a reachability plot
Fig4: Plot the order of points in reachability plot
Fig5: Extract a DBSCAN clustering by cutting the reachability plot at eps_cl
Fig6: Convex Cluster Hulls
Fig7: Reachability Point at eps_cl value
Fig9: OPTICS on a pre-computed distance matrix
III. CONCLUSIONS
In a wide range of utilization zones, density based clustering is a successful approach for mining complex information. Shockingly, the runtime of these information mining calculations is exceptionally high, as the separation capacities between complex question portrayals are regularly extremely costly. In this paper, we appeared instructions to coordinate the notable multi-step inquiry preparing worldview specifically into OPTICS. So to overcome the problem of high time taking for formation of clustering; we are using OPTICS algorithm by assigning numbering order to the clusters. We will work in few components for future research work. It is for fast formation of the clustering depends on various objects in data bases.
IV. REFERENCES
[1]. KarypisG, HanEH, Kumar (1999). “Chameleon: Hierarchical clustering using DM”Computer,
32(8), 68–75.
[2]. HuangZ. Extensions to the k-means algorithm for clustering large datasets with categorical values. DMKD2 (3) (1998) 283–304
[3]. VivekSWare, Bharathi HN, “Study of Density
based Algorithms”, IJCA 0975 – 8887) Volume
69– No.26, May 2013
[4]. MihaelAnkerst, MarkusM.Breunig, Hans-
PeterKriegel,JörgSander“OPTICS: Ordering
Points To Identify the Clustering Structure”,
Proc.ACM SIGMOD‟99 Int. Conf. on Management of Data, Philadelphia PA, 1999. [5]. MihaelAnkerst,M. Breunig, Hans-Peter Kriegel,
JörgSander, “OPTICS: Ordering Points To Identify the Clustering Structure”, Proc. ACM
SIGMOD‟99 Int. Conf. on Management of Data, Philadelphia PA, 1999.