635
Effect of foliar application of 24-epibrassinolide and
salicylic acid on common bean plants grown under
drought stress
Lucas Santos Lopes, Danúbia Aparecida Costa Nobre, Willian Rodrigues Macedo*
Crop Physiology and Metabolism Lab, Universidade Federal de Viçosa - Campus de Rio Paranaíba, Institute of Agricultural Sciences, Rod. MG-230, Km 08, Zona Rural, CEP 38810-000, Rio Paranaíba, MG, Brasil
*Corresponding author:
Willian Rodrigues Macedo, Crop Physiology and Metabolism Lab, Universidade Federal de Viçosa - Campus de Rio Paranaíba, Institute of Agricultural Sciences, Rod. MG-230, Km 08, Zona Rural, CEP 38810-000, Rio Paranaíba, MG, Brasil. Phone: +55 (34) 3855-9364. E-mail: [email protected]
Received: 02 February 2019; Accepted: 11 July 2019
INTRODUCTION
Drought stress occurs frequently in major agricultural areas (Muñoz-Perea et al., 2006), and has adverse effects on photosynthesis, plant growth and productivity (Zlatev and Lidon, 2012). However, plants have developed sophisticated mechanisms to tolerate abiotic stress, such as plant hormones: these are small organic molecules that act as signals to the plant in its growth, differentiation and development (Davies, 2010). Recently there has been emphasis on new hormonal classes, such as brassinosteroids and SA, both of which have already been explored as potential bioregulators for the attenuation of plant stress by activating protective responses in plants submitted to different abiotic stresses, such as: soil salinity (Misra and Saxena, 2009; Javid et al., 2011), drought (Arivalagan and Somasundaram, 2016; Jangid and Dwivedi, 2017) and temperature (Martel and Qaderi, 2016).
Significant progress has been made in our knowledge of the biosynthesis, metabolism and signalling of these
compounds (Peleg and Blumwald, 2011). Brassinosteroids have been shown to have beneficial physiological effects on stem elongation, root growth, nutrient absorption, differentiation of xylem vessels, germination, fruit abortion, senescence induction, ethylene synthesis and resistance to the stresses of cold, salinity, diseases and herbicides (Ashraf et al.,2010). While SA alter ethylene synthesis, seed germination and leaf transpiration (Davies, 2010), change the photosynthetic pigments and plant dry mass (Kaydan et al., 2007), and stimulates the accumulation of proline and glycine (Misra and Saxena, 2009).
The common bean (Phaseolus vulgaris L.) has great nutritional, economic and social importance, mainly in the poor regions of Africa and Latin America (Broughton et al., 2003); however it is considered to be a crop that is sensitive to environmental stresses such as drought or flooding (Souza and Lima, 2012). Therefore, it is essential to find simple, low cost agronomic technologies for application to common bean crops that improve crop quality and quantity. In other
The aim of this study was to evaluate the potential use of two bioregulators, 24-epibrassinolide (BR) and salicylic acid (SA), as attenuators of drought stress on common bean plants (Phaseolus vulgaris L.). This was done by subjecting the plants to three different soil moisture levels, and then analyzing: gas exchange by the leaves, enzymes of antioxidant metabolism (superoxide dismutase, catalase and ascorbate peroxidase), total soluble protein content, photosynthetic pigments, relative leaf water content, and biometric parameters. Neither SA
nor BR had significant effects on the parameters of gas exchange and photosynthetic pigments, but they helped to regulate the levels of
hydrogen peroxide in the plants, by adjusting both ascorbate peroxidase activity and catalase activity. Therefore, SA and BR are considered to be useful treatments for increasing tolerance to water stress in common bean plants, because their use caused improvements in the plants’ protective mechanisms against drought stress, without any detrimental side effects.
Keywords: Antioxidants; Bioregulators; Drought stress; Photosynthesis; Plant metabolism
A B S T R A C T
http://www.ejfa.me/
words, bioregulators are needed that are able to mitigate abiotic stresses in this crop. Thus, common bean plants exposed to water scarcity or excess may have their growth and development modulated by the use of bioregulators.
That being the case, this research aims to characterize the effect of BR and SA on common bean plants that are submitted to different levels of soil moisture.
MATERIAL AND METHODS
Experimental and plant growth conditions
The experiment was carried in a greenhouse, located at coordinates: 19°12’49.5”S 46°13’57.8”W, between February and April 2017. The air temperature was kept between 21 °C and 38 °C to avoid potential photochemical damage (Ribeiro et al., 2015). The commom bean seeds were sown in plastic pots (5 dm³) containing a clayey oxisol that had the following chemical characteristics: Organic Matter: 22 g dm-³; P: 11.0 mg dm-³; K: 1.2 mmol dm-³; Ca: 18 mmol dm-³; Mg: 5.3 mmolc dm-³; pH 5.3. Fertilizer of analysis 4-14-8, respectively: nitrogen, phosphorus and potassium, was applied to the pots according to the recommendations of Ribeiro et al. (1999), and then 6 common bean seeds (Phaseolus vulgaris L. cv. Carioca) were planted per pot, with thinning 14 days after planting (DAP) to two homogenous seedlings per pot.
Imposition of the treatments
For the first 50 DAP the soil moisture levels was maintained at 90% of field capacity (FC). Then, when the plants were at the phenological stage R5, prefloration of development (Fernandez et al., 1982), the soil moisture content was adjusted to three levels: 100%, 80% and 60% of FC, as determined by the methodology of Fernandes and Syke (1968). Soil moisture levels was controlled daily during stress imposition, quantifying water loss by weighing each pot and adding the amount of water lost, with water stress being maintained for 8 days, during which time the foliar application of the bioregulators took place.
The foliar application consisted of the following treatments: water (control treatment), 0.10 μM BR, and 1.0 mM SA, all associated with 0.1% Break-Thru®, an adhesive spreader (Evonik Goldschmidt Chemical Corp., Hopewell, VA). The treatments were applied by a hand sprayer, with 1.0 L of capacity and 300 KPa working pressure, during the first and third days of water stress.
Analysis of leaf pigments
During the collection of material for the biochemical analyses, samples were also collected to evaluate the pigment content, which was done by using the solvent
extraction methodology (80% acetone), modified according to Macedo et al. (2013), without macerating the plant tissue. The readings were taken in a spectrophotometer at wavelengths of 645, 652 and 663 nm for chlorophyll a, b and total (Witham et al., 1971), and 470 nm for carotenoids (Lichtenthaler and Wellburn, 1983). The results were reported as milligrams of the pigment per gram of fresh weight of leaf tissue (mg g-1).
Determination of gas exchange
Gas exchange readings of the plants took place between 9:00 and 11:30 am, 24 hours after the second bioregulator application, on the fifth day after stress imposition. Measurements were taken by an infrared gas analyzer (LI-6400XT; LI-COR Inc., Lincoln, NE, USA) equipped with a modular fluorometer (LCF-40 LI-COR Inc.) under PPFD 1200 μmol m-2 s-1, and a CO
2 ambient concentration of 400 μmol mol-1. By this means, the variables: net assimilation rate of CO2 (A), stomatal conductance (gs), leaf transpiration (E) and intercellular pressure of CO2 (CI) were quantified.
Analysis of the relative water content of leaves
Leaves were collected from the middle of the plant, at 58 DAP, to analyze the relative water content (RWC), after which the samples were weighed individually to obtain fresh weight (FW).The samples were then placed in Falcon® tubes with 50 mL of water for 24 hours, and weighed again to obtain the turgid weight (TW). Finally, the samples were placed in a forced-circulation air oven for 72 hours at 70 °C, and again weighed to obtain the dry weight (DW) (Yamasaki and Dillenburg, 1999).
The RWC (%) was calculated by the following formula:
- 10 0
-FW D W
R W C x
T W D W =
Where: FW (Fresh Weight); DW (Dry Weight) and TW (Turgid Weight).
Biochemical analysis
Leaves were collected from each treatment, to perform the biochemical analysis, on the seventh day after the imposition of water stress. In the laboratory, the leaves were macerated in liquid nitrogen with a porcelain mortar to obtain the protein extract. Total soluble protein (TSP), superoxide dismutase activity (SOD), ascorbate peroxidase activity (APX) and catalase activity (CAT) were determined.
For CAT determination, a 12.5 μL aliquot of the enzyme extract was added to 500 μl 200 mM potassium phosphate buffer, pH 7.0 and 400 μl H2O Milli-Q at 27 °C and 50 μl 250 mM and 37.5 μL H2O. The enzyme activity was determined by measuring the absorbance reduction of the samples at 240 nm, due to H2O2 consumption (Havir and McHale, 1987; Anderson et al., 1995).
The APX was determined according to the method described by Nakano and Asada (1981), by the reaction consisting of 80 mM potassium phosphate buffer pH 7.0;
ascorbate (5 mM); EDTA (1mM); H2O2 (1mM) and
vegetable extract. The activity was determined by the degradation of the hydrogen peroxide during one minute, and consequent modification in the absorbance at 290 nm, the results were expressed in µmol min-1 mg protein-1.
Shoot dry mass, number of shoot nodes and flower bud
These variables were analyzed on the sixth day after the imposition of soil moisture levels. The plant shoot was dried in an oven for 72 h at 60 °C to obtain the shoot dry matter (g). The total number of flower buds and the nodes in the main stem, were measured from two plants of each pot, and the mean values of each pot were used for subsequent analysis.
Statistical analysis
The experimental design was completely randomized, in a 3x3 factorial scheme, respectively, three applications of plant regulators (BR, SA and water as a control) and three soil moisture levels (100%, 80% and 60% FC). The factorial scheme was adopted to analyze the interaction between plant growth regulators and soil moisture levels.
The means were submitted to an analysis of variance (ANOVA), to prove, or not, the validity of the hypotheses (Zimmermann, 2014). After analysis of variance were performed the regression analysis to evaluate the qualitative variables, in the other hands, to evaluate the soil moisture level, and the LSD test (at 5% of significance) was done to verify the effect among different bioregulators. Each treatment had 4 replications (n=4). The analyses were conducted using Sisvar Software (Ferreira, 2011).
RESULTS
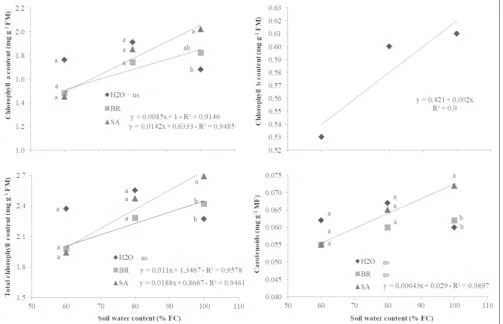
The majority physiological and biochemical responses were observed, in common bean plants subjected to soil moisture levels or the interaction between soil moisture levels and exogenous application of bioregulators, Table S1 and Table S2. However, when plants were cultivated in 100% of soil moisture saturation, and the SA treatment was applied, we observed an increase in synthesis of chlorophyll a, with gains of 20% over the control treatment (Table 1). An analysis of the water levels regressions for each bioregulator showed that the increase in water status led to a linear increase in chlorophyll a content, and that the plants under maximum soil moisture conditions (100% FC) (Table 1). Similar result occurred for total chlorophyll content, in which plants treated with BR and SA showed gains in this variable, when the water content in the soil gradually increased (Table 1). After analysis of f test, we do not observe significant interaction for chlorophyll b, however, the analysis of variance (ANOVA) showed only effect for soil moisture levels for chlorophyll b content (Table 2). For carotenoids content was found a significant interaction between soil moisture levels and the leaf bioregulators application (Table S1), in which plants at
Table 1: Means of chlorophyll a, total chlorophyll and carotenoids, 7 days after soil moisture levels imposition, associate, or not, to foliar application of 24-epibrasinolide or salicylic acid
Variables Treatment 60 80 100 Regression R²
Chlorophyll a H2O 1.76a 1.91a 1.68b -
-BR 1.48a 1.74a 1.82ab L* 0.91
SA 1.45a 1.85a 2.02a L¥ 0.94
Mean 1.56 1.83 1.84 -
-Total
Chlorophyll H2O 2.37
a 2.55a 2.27a -
-BR 1.98ab 2.28a 2.42a L+ 0.95
SA 1.94b 2.47a 2.69a L# 0.94
Mean 2.09 2.43 2.46 -
-Carotenoids H2O 0.062a 0.067a 0.060b -
-BR 0.055a 0.060a 0.062b -
-SA 0.055a 0.065a 0.072a L∞ 0.99
Mean 0.057 0.064 0.064 -
100% FC that received SA had 20% more carotenoids when compared to plants treated with BR and H2O (Table 1).
The bioregulators had no effect on the gas exchange parameters, either acting in isolation or interacting with the soil moisture levels (Table S1), however, the increased availability of water in soil have a significant effect on these parameters: the higher water content in the soil, the higher the net assimilation rate of CO2 (A), stomatal conductance (gs) and leaf transpiration (E) (Table 3), surprisingly, the high levels of water in soil did not negatively affect gas exchange (Table 3). The internal concentration of CO2 (Ci) was unaffected by different soil moisture levels or the application of bioregulators (Table S1).
Regarding the relative water content of the leaf tissue, there was no significant interaction of water content and bioregulators (Table S1). Yet, there was an increase in leaf water content following the gradual increase of water in the substrate: the treatment of 80% of FC resulted in the
highest leaf water status, possibly by maintaining a more satisfactory transpiration (Table 3).
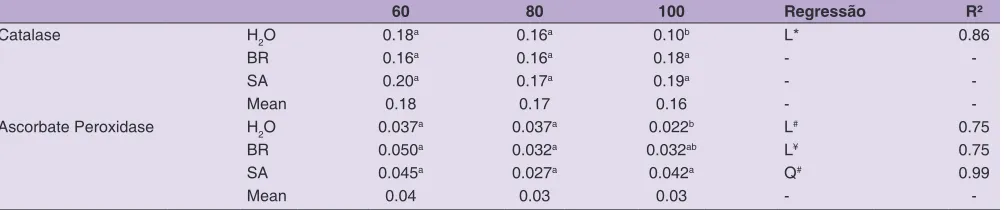
A positive effect of soil moisture levels on antioxidant metabolism was reported, whereby well-hydrated plants presented low levels of CAT and APX, without having effect on SOD (Table S2). Neither bioregulator interfered in CAT activity, when the plants were irrigated with 60 or 80% water in the soil (Table 4), but under 100% water saturation conditions, the bioregulators expressed higher activity of this enzyme. For APX activity the application of BR and H2O on common bean leaves had similar responses, as the water level in the soil increased, expand its activity, until it reaches the maximum at 100% of FC (Table 4), meanwhile, the use of SA leaf treatment presented a quadratic effect (Table 4).
There was a significant interaction between soil moisture levels and bioregulators for the biometric variables (Table S2), SA proved to be extremely efficient in increasing the accumulation of shoot dry matter under 100% of FC, where it was found 78% of gains on shoot dry mass when compared to the control (Table 5). The application of SA resulted in a linear model for SDM, when evaluated the soil moisture levels (Table 5).
Both bioregulators showed a significant result for numbers of nodes per plant, when the plants were subjected to low and high soil moisture levels, were the use of SA and BR promotes a considered gain on the number of nodes, however, under 80% FC these bioregulators not showed positive or deleterious effects on common bean node number. For water leaf treatment, we observed a expressive response of soil moisture levels on node number expression, were 80% FC showed a better level of water for presence of node number (Table 5). And the soil moisture levels alone had a significant, positive, linear effect on the number of flower buds per plant (Table 6).
Table 2: Means of chlorophyll b, 7 days after imposition of different soil moisture levels
60 80 100 Regression R²
0.53 0.6 0.61 L* 0.9
Means presented in the in the row represent a regression analysis,
with respective model better fitted and determination coefficient, (n=4). Equations of regression: *y= 0.06 - 0.0003x
Table 3: Means of relative water content (RWC, %), CO2 net assimilation (A, µmol m-2 s-1), stomatal conductance (gs, µmol m-2 s-1), transpiration (E, mmol m-2 s-1), 6 days after soil moisture levels imposition, for RWC and 7 days after imposition of different soil moisture levels
Variables 60 80 100 Regression R²
RWC 56.91 75.12 73.54 Q* 0.99
A 3.75 12.72 14.47 L¥ 0.86
gs 0.03 0.13 0.18 L+ 0.95
E 1.28 4.49 5.86 L# 0.95
Means presented in the in the row represent a regression analysis, with
respective model better fitted and determination coefficient, (n=4). Equations of regression: *y = -116.49 + 4.374x - 0.024x²; ¥y=-11.25 + 0.267x; + y=-1.074 + 0.003x; and #y=-5.283 + 0.1145x
Table 4: Means of catalase (µmol min-1 mg-1 of protein) and ascorbate peroxidase (µmol min-1 mg-1 of protein), 6 days after soil moisture levels imposition, associate, or not, to foliar application of 24-epibrasinolide or salicylic acid
60 80 100 Regressão R²
Catalase H2O 0.18a 0.16a 0.10b L* 0.86
BR 0.16a 0.16a 0.18a -
-SA 0.20a 0.17a 0.19a -
-Mean 0.18 0.17 0.16 -
-Ascorbate Peroxidase H2O 0.037a 0.037a 0.022b L# 0.75
BR 0.050a 0.032a 0.032ab L¥ 0.75
SA 0.045a 0.027a 0.042a Q# 0.99
Mean 0.04 0.03 0.03 -
-Means followed by the same letter in the column between bioregulators treatment on plant leaf, inside soil moisture level, do not differ from each other according
photosynthetic pigments at 60% FC. Neither of the bioregulators affected chlorophyll b content: the only reduction in the concentration of this pigment occurred due to restrictions in the availability of soil water (Fig. 1).
Stress factors, such as low water availability (Kiani et al., 2008) and salinity (Fayez and Bazaid, 2014), result in significant reductions in pigment content. This phenomenon can be attributed to the degradation of chlorophyll content
Fig 1.Chlorophyll a content (mg g-1 FM), total (mg g-1 FM) and carotenoids (mg g-1 FM), in common bean plants subjected to different soil water
levels (60%, 80% and 100% FC), and to applications of two bioregulators (SA and BR). The t test showed differences at 10% significance for chlorophyll a and total, and 5% for carotenoids
DISCUSSION
Leaf application is the most effective way to promote growth responses, or to mediate different physiological processes under stress conditions (Ashraf et al., 2010). From this perspective, the foliar application of the bioregulators led to gains in chlorophyll a, total chlorophyll and carotenoids when the plants were grown at 100% FC, but caused reductions in the concentrations of these
Table 5: Means of shoot dry matter (SDM, g) and node number in the main stain (NN, per plant), 6 days after soil moisture levels imposition, associate, or not, to foliar application of 24-epibrasinolide or salicylic acid
60 80 100 Regressão R²
Shoot dry matter H2O 1.16a 2.15a 1.56b Q* 0.99
BR 1.66a 2.00a 1.63b -
-SA 0.84a 1.64a 2.78a L# 0.98
Mean 0.96 1.93 1.99 -
-Node number H2O 4.75b 6.25a 5.00b Q+ 0.99
BR 6.00a 5.75a 6.25a -
-SA 6.25a 6.25a 6.25a -
-Mean 5.66 6.08 5.83 -
-Means followed by the same letter in the column between bioregulators treatment on plant leaf, inside soil moisture level, do not differ from each other
(Reddy et al., 2004), combined with the reduction of its biosynthetic pathway (Nikolaeva et al., 2010). The adverse effects of abiotic stresses on photosynthetic pigments can be counteracted by the exogenous application of SA (Idrees et al., 2011; Fayez and Bazaid, 2014), or the exogenous use of brassinosteroids (Siddiqui et al., 2018).
Plants grown under conditions of low water availability
showed reductions in CO2 assimilation, stomatal
conductance and transpiration, a result reversed with increasing soil water (Fig. 2). Water restriction is highly detrimental to gas exchange processes in the common bean, due to the closure of the plant’s stomata (Chaves et al., 2002; Santos et al., 2009; Mathobo et al., 2017). The water content of the leaves was highly responsive to soil water levels: the more water available to the plant, the greater the
relative water content of the leaves. Water influx allows greater turgor of guard cells, and results in greater stomatal opening and higher photosynthetic efficiency (Chaves et al. 2002), corroborating with these results.
Neither soil moisture levels nor bioregulators affected the CO2 concentration in the leaf mesophyll (Ci), which is the opposite result to that reported by Mathobo et al. (2017), who found an increase in intracellular carbon concentration at the higher level of water stress in common bean plants. SA and BR had no effect on the RWC and gas exchange regulation of plants subjected to water deficit, contradicting studies that pointed out the attenuation of plant stress by the use of these bioregulators (Fayez and Bazaid, 2014; Siddiqui et al., 2018).
Normal aerobic metabolism produces reactive oxygen species (ROS); however plants have sophisticated defence mechanisms (both enzymatic and non-enzymatic) against the harmful effects of ROS (Mittler, 2002). In this research, it was observed that a low level of water available for plants promoted high levels of CAT and APX (Fig. 3), corroborating with Rivas-San and Plascencia (2011), who
Fig 2.Net assimilation rate of CO2 (A), stomatal conductance (gs), leaf transpiration (E) and relative water content in common bean plants
subjected to different soil humidity levels (60%, 80% and 100% FC). The t test showed differences at 1% significance for A, gs and E, and at 10% significance for RWC
Table 6: Means of flower bud (FB, per plant), 6 days after
imposition of different soil moisture levels
60 80 100 Regressão R²
3.66 4.5 4.66 L* 0.87
Means presented in the in the row represent a regression analysis,
Fig 3.Catalase (µmol min-1 mg-1 protein) and ascorbate peroxidase (µmol min-1 mg-1 protein), in common bean plants
subjected to different soil water levels (60%, 80% and 100% FC), and to applications of two bioregulators (SA and BR). The t test showed differences at 10% significance
claimed that water deficit leads to ROS accumulation, promoting lipid peroxidation, chlorophyll degradation and the loss of photosynthetic activity and membrane integrity. Furthermore, when the soil moisture level was increased to 100% FC, CAT and APX activity were increased significantly when compared to the control. This response correlates to the damaging effect of water deficit, which leads to substrate (H2O2) suppression in the reaction catalyzed by these enzymes (Mittler, 2002). This shows that both SA (Khan et al., 2015) and BR (Nuñez et al., 2010) activate mechanisms that stimulate
the antioxidant biosynthesis of enzymes, and so potentially make plants more tolerant of water stress.
increasing dry matter accumulation (Fig. 4). Under condition of low water availability, a reduction in dry matter can be explained by a decrease in photosynthetic rates, and consequent adjustment in the allocation of plant biomass (Zlatev and Lidon, 2012). The linear increase in dry matter following SA application can be explained by the interaction between the signaling pathways linking the SA and auxin hormones during the plant vegetative stage (Rivas-San and Plascencia, 2011), in which auxin is responsible for plant root and shoot expansion (Larqué and Martin, 2007). This effect of SA on dry matter accumulation agrees with the results obtained by Pacheco et al. (2013).
An increase in soil moisture led to a linear increase in the number of flower buds fixed by the plants. This result was expected, because a lack of water during the flowering period may cause abortion of flowers, due to competition between the source and sink, with the elimination of abnormal flowers due to a lack of nitrogen or carbohydrates (Hostalácio and Valio, 1984). The use of bioregulators was unable to counter this effect of water deficit.
CONCLUSIONS
Predominantly the salicylic acid and 24-epibrassinolide had a positive effect on photosynthetic pigments, antioxidant enzyme activities (CAT and APX), shoot dry matter and
number of nodes, when plants were subjected to under flooding conditions. While gas exchange and the number of flower buds responded only to soil moisture levels.
ACKNOWLEDGEMENTS
This study was financed by FAPEMIG (Minas Gerais State Agency for Research and Development) for providing the research fellowship (APQ-02110-15), and the Coordenação de Aperfeiçoamento de Pessoal de Nível Superior - Brasil (CAPES) - Finance Code 001, by provide fellowship for first and second authors. The authors are grateful to PhD Jeff Pursglove for corrections and suggestions in this manuscript.
Authors’ Contributions
In this research, LSL conducted the experiment and performed the statistical analysis; DACN assisted the greenhouse and laboratorial analysis; WRM designed the experiment, assisted wrote the manuscript and supervised the assays.
REFERENCES
Anderson, M. D., T. K. Prasad and C. R. Stewart. 1995. Changes in isozyme profiles of catalase, peroxidase, and glutathione reductase during acclimation to chilling in mesocotylus of maize seedlings. Plant Physiol. 109: 1247-1257.
Arivalagan, M. and R. Somasundaram. 2016. Induction of drought stress tolerance by propiconazole and salicylic acid in
Fig 4. Plant dry matter (g), number of nodes (per plant) and flower buds (per plant), in common bean plants subjected
Sorghum bicolor is mediated by enhanced osmoregulation, compatible solutes and biochemical accumulation. J. Appl. Adv. Res. 1: 41-52.
Ashraf, M., N. A. Akram, R. N. Arteca and M. R. Foolad. 2010. The physiological, biochemical and molecular roles of brassinosteroids and salicylic acid in plants process and salt tolerance. Crit. Rev. Plant Sci. 29: 162-190.
Bradford, M. M. 1976. Rapid and sensitive method for quantitation of microgram quantities of protein utilizing principle of protein-dye binding. Anal Biochem., 72: 248-254.
Broughton, W. J. G., G. Hernandez, M. Blair, S. Beebe, P. Gepts and J. Vanderleyden. 2003. Beans (Phaseolus spp.) model food legumes. Plant Soil. 252: 55-128.
Chaves, M. M., J. S. Pereira, J. Maroco, M. L. Rodrigues, C. P. P. Ricardo, M. L. Osório, I. Carvalho, T. Faria and C. Pinheiro. 2002. How plants cope with water stress in the field. Photosynthesis and growth. Ann. Bot. 89: 907-916.
Davies, P. J. 2010. The plant hormones: Their nature, occurrence and functions. In: P. J. Davies (Ed.), Plant Hormones Biosynthesis, Signal, Transduction, Action! 3th ed. Kluwer Academic Publishers, Dordrecht.
Fayez, K. A. and S. A. Bazaid. 2014. Improving drought and salinity tolerance in barley by application of salicylic acid and potassium nitrate. J. Saudi Soc. Agric. Sci. 13: 45-55.
Fernandes, B. and D. J. Sykes. 1968. Capacidade de campo e retenção de água em três solos de Minas Gerais. Ceres. 15: 1-39.
Fernandez, F., P. Gepts and M. Lópes. 1982. Etapas de Desarrollo de la Planta de Fríjol Comum (Phaseolus vulgaris L.) CIAT, Cali, Colombia.
Ferreira, D. F. 2011. Sisvar: A computer statistical analysis system. Cienc. Agrotec. 35: 1039-1042.
Havir, E. A. and N. A. McHale. 1987. Biochemical and developmental characterization of multiple forms of catalase in tobacco leaves. Plant Physiol. 84: 450-455.
Hostalacio, S. and I. F. M. Valio. 1984. Desenvolvimento dos frutos de feijão em diferentes regimes de irrigação. Pesq. Agropec. Bras. 19: 53-57.
Idrees, M., M. Naeem, T. Aftab, M. M. A. Khan and Moinuddin. 2011. Salicylic acid mitigates salinity stress by improving antioxidant defence system and enhances vincristine and vinblastine alkaloids production in periwinkle [Catharanthus roseus (L.) G. Don]. Acta Physiol. Plant. 33: 987-999.
Jangid, K. K. and P. Dwivedi. 2017. Physiological and biochemical changes by nitric oxide and brassinosteroid in tomato
(Lycopersicon esculentum Mill.) under drought stress. Acta Physiol. Plant. 39: 73.
Javid, M., A. Sorooshzadeh, F. Moradi, S. A. M. Sanavy and I. Allahdadi. 2011. Effects of the exogenous application of auxin and cytokinin on carbohydrate accumulation in grains of rice under salt stress. Plant Growth Regul. 65: 305-313.
Kaydan, D., M. Yağmur and N. Okut. 2007. Effects of salicylic acid on the growth and some physiological characters in salt stresses wheat (Triticum aestivum L.). Tarim Bilim. Derg. 13: 114-119. Khan, M. I. R., M. Fatma, T. S. Per, N. A. Anjum and N. A. Khan. 2015.
Salicylic acid-induced abiotic stress tolerance and underlying mechanisms in plants. Front. Plant Sci. 6: 462.
Kiani, S. P. P., A. Maury and P. G. Sarrafi. 2008. QTL analysis of chlorophyll fluorescence parameters in sunflower (Helianthus annuus L.) under well-watered and water-stressed conditions. Plant Sci. 175: 565-573.
Larqué, S. A. and M. R. Martin. 2007. Effects of salicylic acid on
bioproductivity of plants. In: S. Hayat and A. Ahmad (Eds.), Salicylic acid: 1plant hormone. Springer, Dordrecth, SH. Lichtenthaler, H. and A. Wellburn. 1983. Determinations of total
carotenoids and chlorophylls a and b of leaf extracts in different solvents. Biochem. Soc. T. 603: 591-592.
Macedo, W. R., D. K. Araujo and P. R. C. Castro. 2013. Unravelling the physiologic and metabolic action of thiamethoxam on rice plants. Pestic. Biochem. Phys. 107: 244-249.
Mathobo, R., D. Marais and J. M. Steyn. 2017. The effect of drought stress on yield, leaf gaseous exchange and chlorophyll fluorescence of dry beans (Phaseolus vulgaris L.). Agric. Water Manage. 180: 118-125.
Martel, A. B. and M. M. Qaderi. 2016. Does salicylic acid mitigate the adverse effects of temperature and ultraviolet-B radiation on pea
(Pisum sativum) plants? Environ. Exp. Bot. 122: 39-48. Misra, N., and P. Saxena. 2009. Effect of salicylic acid on proline
metabolism in lentil grown under salinity stress. Plant Sci. 177: 181-189.
Mittler, R. 2002. Oxidative stress, antioxidants and stress tolerance. Trends Plant Sci. 7: 405-410.
Muñoz-Perea, C. G., H. Terán, R. G. Allen, J. L. Wright, D. T. Westermann and S. P. Singh. 2006. Selection for drought resistance in dry bean landraces and cultivars. Crop Sci. 46: 2111-2120.
Nakano, Y. and K. Asada. 1981. Hidrogen peroxide is scavenged by ascorbate-specific peroxidase in spinach chloroplasts. Plant Cell Physiol. 22: 867-880.
Nikolaeva, M. K., S. N. Maevskaya, A. G. Shugaev and N. G. Bukhov. 2010. Effect of drought on chlorophyll content and antioxidant enzyme activities in leaves of three wheat cultivars varying in productivity. Russ. J. Plant Physiol. 57: 87-95.
Núñez, M., L. M. Mazorra, Y. Reyes and L. Martínez. 2010. Los brasinoesteroides y las repuestas de las plantas a estrés abióticos. Una visión actualizada. Cultiv. Tropic. 31: 56-65. Pacheco, A. C., C. S. Cabral and E. S. F. Aleman. 2013. Salicylic
acid-induced changes to growth, flowering and flavonoids production in marigold plants. J. Med. Plants Res. 7: 3158-3163.
Peleg, Z. and E. Blumwald. 2011. Hormone balance and abiotic stress tolerance in crop plants. Curr. Opin. Plant Biol. 14: 290-295. Reddy, A. R., K. V. Chaitanya and M. Vivekanandan. 2004.
Drought induced responses of photosynthesis and antioxidant metabolism in higher plants. J. Plant Physiol. 161: 1189-1202. Ribeiro, A. C., P. T. C. Guimarães and V. H. A. Venegas. 1999.
Recomendações Para uso de Fertilizantes em Minas Gerais: 5ªAproximação. Comissão de Fertilidade do Solo do Estado de Minas Gerais, Viçosa.
Ribeiro, R. V., M. G. Santos, C. Pimentel, E. C. Machado and R. F. Oliveira. 2015. Can the critical temperature for photochemical damage in common bean plants be changed after a drought event? Bragantia. 74: 374-378.
Rivas-San, V. M. and J. Plasencia. 2011. Salicylic acid beyond defence: Its role in plant growth and development. J. Exp. Bot. 62: 3321-3338.
Santos, M. G., R. V. Ribeiro, E. C. Machado and E. Pimental. 2009. Photosynthetic parameters and leaf water potential of five common bean genotypes under mild water deficit. Biol. Plant. 53: 229-236.
Siddiqui, H., S. Hayat and A. Bajguz. 2018. Regulation of photosynthesis by brassinosteroids in plants. Acta Physiol. Plant. 40: 59.
produtividade do feijoeiro sob estresse hídrico e profundidade de incorporação do adubo. Glob. Sci. Tech. 5: 45-55.
Witham, F. H., D. F. Blaydes and R. M. Devlin. 1971. Experiments in plant physiology. Van Nostrand Reinhold Co., New York. Yamasaki, S. and L. R. Dillenburg. 1999. Measurements of leaf
relative water content in Araucaria angustifolia. Rev. Bras. Fisiol.
Veg. 11: 69-75.
Zimmermann, F. J. P. 2014. Estatística Aplicada à Pesquisa Agrícola. Embrapa, Brasília, DF.
Zlatev, Z. and F. C. Lidon. 2012. An overview on drought induced changes in plant growth, water relations and photosynthesis. Emir. J. Food Agric. 24: 57-72.
SUPPLEMENTARY TABLE
Table S1: Analysis of variance summary, presenting the test f value of: chlorophyll a (Chl a), chlorophyll b (Chl b), total chlorophyll (Total Chl), carotenoids (Carot), water content (RWC), CO2 net assimilation (A), stomatal conductance (gs), CO2
internal concentration (CI), transpiration (E) and water use efficiency (A/E)
FV DF Chl a Chl b Total Chl Carot RWC A gs CI E
B 2 0.85 1.74 1.11 2.32 1.11 0.86 0.10 0.73 0.24 H 2 6.21 3.63* 5.62 5.47 5.25* 12.34* 24.85* 0.34 29.49*
B x H 4 2.35* 1.90 2.59* 3.00* 1.05 0.28 0.88 0.20 1.25
Error 27 - - -
-Total 35 - - -
-C.V.
(%) --- 12.5 13.3 12.5 9.8 22.2 54.9 44.3 74.6 38.6
*represent significance of p-value ≤ 0.1
Table S2: Analysis of variance summary, presenting the test f value of: total soluble protein (TPS), superoxide dismutase (SOD),
catalase (Cat), ascorbate peroxidase (APX), shoot dry matter (SDM) and node number in the main stain (NN) and flower bud (FB)
FV DF TSP SOD Cat APX SDM NN FB
B 2 0.69 0.26 3.14 1.30 0.19 5.49 0.38
H 2 1.09 1.83 0.75 5.20 5.93 1.07 2.51*
B x H 4 1.18 0.92 3.49* 2.49* 3.72* 2.34* 0.41
Error 27 - - -
-Total 35 - - -
-C.V. (%) --- 5.4 17.7 22.5 28.1 35.9 11.9 27.3