Infogain Publication (Infogainpublication.com) ISSN : 2454-1311
Machine Tool Crack Detection using
Operational Modal Characteristics
Akhil R
1, Sudheer A
21M Tech student, Department of Mechanical Engineering, TKM College of Engineering, Kollam, Kerala, India
2
Assistant Professor, Department of Mechanical Engineering, TKM College of Engineering, Kollam, Kerala, India
Abstract—Machine tool crack detection is to detect any
damages in the tool during machining and to predict the breakage of the tool by identifying the appearance of small cracks in the tool during machining. Machine tool state monitoring is critical for controlling the work piece quality and production continuity in the case of mass production. For assessing tool breakage, machine tool vibration monitoring is a suitable means. The results obtained in FE analysis are validated with experimental data. This work gives a methodology for online crack detection in machine tools. This work presents an experimental technique for measuring modal parameters of a rectangular aluminium plate with cantilever boundary condition using only the output data, with the intention to apply the technique to machine tools. Operational modal analysis is be used for damage detection by determining the depth as well as the position of tool cracks. The results obtained are validated with finite element analysis. To locate the crack, 3D graphs of the normalized frequency in terms of the crack depth and location are plotted. The intersection of these contours gives crack location and crack depth. Out of several case studies conducted the results of one of the case study is presented to demonstrate the applicability and efficiency of the method suggested.
Keywords— crack, finite element analysis, frequency, mode, operational modal analysis, tool.
I. INTRODUCTION
Crack damage is one of the main reasons for the machine tool structure damage. Cracks are small imperfections within a material that are created during manufacturing or loading. Material imperfections which arise at the time of production or usage of the material are unavoidable, and hence must be taken into account. Indeed even microscopic flaws may cause structures which are assumed to be safe to fail, as they grow over time. So the cracks must be detected to avoid such calamities.
Traditional experimental modal analysis (EMA) makes use of input (excitation) and output (response) measurements to estimate modal parameters, consisting of modal frequencies, damping ratios, mode shapes and modal participation factors. Operational Modal Analysis
International Journal of Advanced Engineering, Management and Science (IJAEMS) [Vol-2, Issue-8, Aug- 2016] Infogain Publication (Infogainpublication.com) ISSN : 2454-1311
www.ijaems.com Page | 1318
parameters of a rectangular aluminum plate with free boundaries using only the output data, with the intention to apply the technique to turbine blades.
1.1 Objectives
To obtain a set of modal analysis data of machine tool with cracks at different positions, depth and different numbers. To conduct experimental modal analysis of intact cutting tool and operational modal analysis for intact, single cracked and double cracked cutting tool. Investigate the presence of crack in cutting tool using modal data generated using finite element analysis. To compare of results between experimental and numerical analyses results.
II. EXPERIMANTATION
Experimental modal analysis and Operational modal analysis are conducted to find the modal parameters such as mode shape and natural frequencies of the structure.
2.1 Test Specimen
Rectangular aluminium plate is selected as the test specimen with the intention to apply the technique to machine cutting tool. The dimensions and material properties of the rectangular aluminum plate being studied are shown in Table 1.
Table 1: Test specimen parameters
Parameter Value
Length Width Thickness Young’s modulus Poison’s Ratio Density
0.4m 0.02m 0.006m
69GN/m2
0.33
2700kg/m3
2.2 Experimental setup
A rectangular aluminium plate is used for
experimentation. The plate is supported at one end by a bench vice at one end so as to form a cantilever beam. The beam is excited with the help of an impact hammer of sensitivity 2.25mV/N. Transverse cracks are made in the beam artificially by using a saw. Integrated electronic piezoelectric (IEPE) accelerometers of sensitivity 100mV/g are used in this work. The NI USB-4431is used to collect the data and ME’scope VES from Vibrant Technology is used for operational vibrations and modal analysis.
2.2 Stages for conducting Experiment
A rectangular aluminium plate is selected as the test specimen whose parameters are mentioned in Table 1. First, Experimental modal analysis of intact beam is conducted and the responses are measured. Next, Operational modal analysis (OMA) of intact beam, single cracked and double cracked beam is conducted. The crack is introduced in the beam at depth of 1mm and 3mm, at a
position of 2cm from the fixed end. For a double cracked beam, crack is made at a depth of 3mm (2cm from the fixed end) and depth of 2mm (20cm from the fixed end). Operational Modal Analysis (OMA) requires the response signals of the investigated structure, the signals of the input forces are not needed. Two accelerometers are placed at two positions on the beam and the force is applied using an impact hammer, but the force is not measured. One accelerometer measures roving response and other serves for measuring reference response. Cross-correlation functions between the roving and the reference can be generated and used for modal parameter estimation. OMA setup is shown in Fig. 1.
Fig. 1: OMA setup
III. NUMERICAL ANALYSIS
Numerical analysis is conducted on the aluminium plate using commercial FE software ANSYS 15.0. The boundary conditions of the plate are set to be one end fixed so as to form a cantilever beam. The natural frequencies and mode shapes of the first 2 bending modes are calculated.
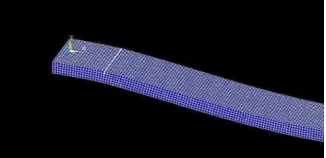
Fig. 2: Finite Element model of cracked beam
The modal analysis of the intact, cracked and double cracked aluminium beam is done with cantilever boundary condition. The effect of crack depth on natural frequency of the beam is compared with the result of OMA). Analysis is also conducted for different crack depths at different locations to study the effect of crack depth and location on natural frequency and mode shape of the beam. These data are used to identify the depth and location of the crack.
IV. RESULTS AND DISCUSSIONS
Infogain Publication (Infogainpublication.com) ISSN : 2454-1311
validity of OMA. The natural frequency of 1st bending mode and 2nd bending mode of intact, single cracked and double cracked beam are obtained from OMA, which are compared with the results of numerical analysis.
The FRF diagram (Fig. 3) of intact beam as a result of Experimental modal analysis (EMA) is obtained. The first peak shows the 1st bending mode frequency which is 31Hz and second peak shows the 2nd bending mode frequency which is 205Hz.
Fig. 3: FRF diagram of intact beam (EMA)
The FRF diagram of intact beam as a result of Operational modal analysis (OMA) is shown in Fig. 4. The first peak shows the 1st bending mode frequency which is 30.3Hz and second peak shows the 2nd bending mode frequency which is 197Hz.
Fig. 4: FRF diagram of intact beam (OMA)
The frequency of intact beam obtained from OMA matches with the frequency of intact beam obtained from EMA with an error of 2.2% and 3.9% for 1st and 2nd bending mode respectively. The 1st and 2nd bending mode frequencies of beam under different conditions obtained from OMA are listed in the Table 2.
Table 2: 1st and 2nd bending mode frequencies of beam under different condition
Condition of crack
Position of crack Frequency (Hz)
Distance from fixed end (cm)
Depth (mm)
1st bending
mode
2nd bending
mode
0
No crack 0 0 30.3 197
Single crack
2 1 29.9 194
2 3 28.5 190
Double crack
2 20
3 2
28.1 187
4.1 Comparison of results of experimental and numerical analysis
The first and second bending modes obtained from experimental (Fig. 5) and numerical analysis (Fig. 6) is compared in this section
Fig. 5: Experiment (a) 1st bending mode and (b) 2nd bending mode
Fig. 6: Numerical analysis (a) 1st bending mode and (b) 2nd bending mode
International Journal of Advanced Engineering, Management and Science (IJAEMS) [Vol-2, Issue-8, Aug- 2016] Infogain Publication (Infogainpublication.com) ISSN : 2454-1311
www.ijaems.com Page | 1320
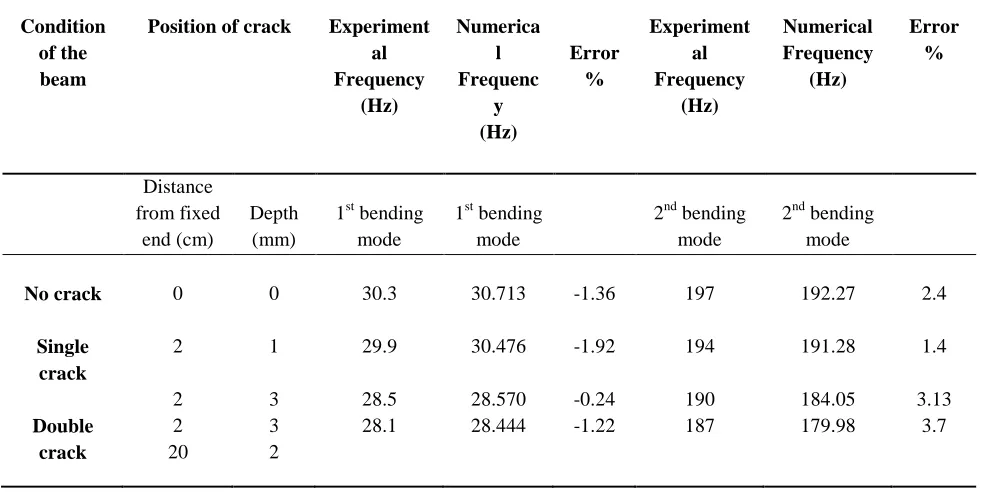
Table 3: Comparison of experimental and numerical analysis results
Condition of the beam
Position of crack Experiment al Frequency
(Hz)
Numerica l Frequenc
y (Hz)
Error %
Experiment al Frequency
(Hz)
Numerical Frequency
(Hz)
Error %
Distance from fixed
end (cm)
Depth (mm)
1st bending mode
1st bending mode
2nd bending mode
2nd bending mode
No crack 0 0 30.3 30.713 -1.36 197 192.27 2.4
Single crack
2 1 29.9 30.476 -1.92 194 191.28 1.4
2 3 28.5 28.570 -0.24 190 184.05 3.13
Double crack
2 20
3 2
28.1 28.444 -1.22 187 179.98 3.7
Table 4: Normalized first mode frequency
Crack depth (mm) Crack
position from
the fixed end (mm)
0.5 1 1.5 2 2.5
50 0.997591 0.993879 0.983362 0.970501 0.943705
100 0.99847 0.996125 0.989418 0.981083 0.963338
150 0.999153 0.997819 0.994009 0.989223 0.978869
200 0.999577 0.998958 0.997135 0.994823 0.989776
250 0.999837 0.999609 0.998958 0.998112 0.996223
300 0.999967 0.999902 0.99974 0.999577 0.999153
350 1 0.999967 0.999967 0.999967 0.999935
Table 5: Normalized second mode frequency
Crack depth (mm) Crack
position from
the fixed end (mm)
0.5 1 1.5 2 2.5
50 0.999376 0.998492 0.995943 0.992875 0.986789
100 0.999948 0.999844 0.999584 0.99922 0.998544
150 0.999012 0.997452 0.993135 0.987778 0.976491
200 0.998232 0.995475 0.987726 0.978156 0.958236
250 0.998492 0.996151 0.989546 0.981328 0.963749
300 0.999376 0.99844 0.995683 0.992198 0.984553
Infogain Publication (Infogainpublication.com
As the experimental value matches with numerical analysis values with a small error, normalized frequencies are determined for different crack depth and crack are shown in the Table 4 and Table 5 respectively. normalized frequencies obtained from finite element analysis (Ansys) for different crack depth and location are used to study the effect of crack in natural frequencies and mode shape of the cantilever beam.
4.2 Variation of normalized frequencies with crack depth and location
Fig. 7: Normalized first mode frequency vs crack position
Figure 8: Normalized first mode frequency vs crack depth
Fig. 9: Normalized second mode frequency vs crack position
Infogainpublication.com)
As the experimental value matches with numerical analysis values with a small error, normalized frequencies are determined for different crack depth and crack
location from finite element analysis. Normalized frequency is the ratio of cracked beam frequ
frequency of intact beam.………
5 respectively. These normalized frequencies obtained from finite element analysis (Ansys) for different crack depth and location are of crack in natural frequencies
Variation of normalized frequencies with crack
: Normalized first mode frequency vs crack position
: Normalized first mode frequency vs crack depth
: Normalized second mode frequency vs crack
Fig. 10: Normalized second mode frequency vs crack depth
It is clear from the Fig. 7
frequency is least affected when the crack depth is 0.5mm. The fundamental frequency is mostly affected when the crack depth is 2.5mm and is located at 50 from the fixed end. From Fig. 9 and Fig.
that second mode frequency is mostly affected for a crack depth of 2.5mm, when the crack is located at 200 mm from the fixed end i.e., at the center of the cantilever beam. From all these observations it can be concluded that the change in frequencies is a function of
as well as the location of the crack.
4.3 Identification of crack depth and location
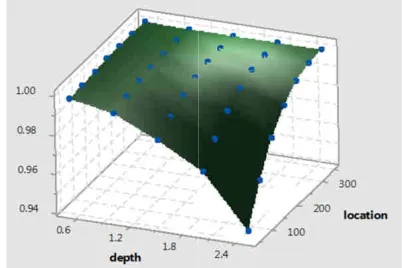
The three dimensional plot of normalized first mode frequency and second mode frequency with crack depth and crack location is shown in Fig. 11 and
respectively. On the basis of 3d surface plot a contour line, which has the same normalized frequency resulting from a combination of different crack depth and crack location can be plotted with crack location and crack depth as its axes.
Fig. 11: Three dimensional surface plot of normalized first mode frequency vs crack depth and location
) ISSN : 2454-1311
location from finite element analysis. Normalized frequency is the ratio of cracked beam frequency to that
………
: Normalized second mode frequency vs crack depth
7 and Fig. 8 that first mode frequency is least affected when the crack depth is 0.5mm. The fundamental frequency is mostly affected when the crack depth is 2.5mm and is located at 50mm from the fixed end. From Fig. 9 and Fig. 10 it is observed mode frequency is mostly affected for a crack depth of 2.5mm, when the crack is located at 200 mm from the fixed end i.e., at the center of the cantilever beam. From all these observations it can be concluded that the change in frequencies is a function of crack depth as well as the location of the crack.
Identification of crack depth and location
The three dimensional plot of normalized first mode frequency and second mode frequency with crack depth and crack location is shown in Fig. 11 and Fig. 12 tively. On the basis of 3d surface plot a contour line, which has the same normalized frequency resulting from a combination of different crack depth and crack location can be plotted with crack location and crack
International Journal of Advanced Engineering, Management and Science (IJAEMS) Infogain Publication (Infogainpublication.com
www.ijaems.com
Fig. 12: Three dimensional surface plot of normalized second mode frequency vs crack depth and location
From Table 4 and Table 5, it is found that for a crack depth of 2mm at a distance of 200mm from the fixed end, the 1st mode and 2nd mode normalized frequencies of the beam are obtained as 0.9948 and 0.9782. The contour lines with the values of 0.9948 and 0.9782 are retrieved from the first two modes respectively as shown in Fig and Fig. 14.
Fig. 13: Contour plot of normalized first mode frequency (0.9948) vs crack depth and location
Fig. 14: Contour plot of normalized second mode frequency (0.99782) vs crack depth and location
To determine the crack depth and crack location, the contour line with the values of 0.9948 and 0.9782 are plotted on the same axes as shown in the Fig
observed that the two contour lines are intersected at a
International Journal of Advanced Engineering, Management and Science (IJAEMS)
Infogainpublication.com)
: Three dimensional surface plot of normalized second mode frequency vs crack depth and location
5, it is found that for a crack depth of 2mm at a distance of 200mm from the fixed end, mode normalized frequencies of the beam are obtained as 0.9948 and 0.9782. The contour .9782 are retrieved from the first two modes respectively as shown in Fig. 13
Contour plot of normalized first mode frequency
plot of normalized second mode frequency (0.99782) vs crack depth and location
To determine the crack depth and crack location, the contour line with the values of 0.9948 and 0.9782 are plotted on the same axes as shown in the Fig. 15. It is observed that the two contour lines are intersected at a
common point, which indicates the location and depth of the crack.
Fig. 15: Crack identification technique using frequency contours
V. CONCLUSIONS
The Experimental Modal Analysis (EMA) matches with Operational Modal Analysis (OMA) of an intact with an error of 2.2% for first mode and 3.9% for second mode. It is due to the additional mass of the reference accelerometer used in the OMA as compared to EMA, where a fixed accelerometer is only used for measuring the response. OMA is conducted for beams having crack at different position and location and it matches with numerical analysis values with a maximum error of 3.8%, because it is very difficult to achieve fixed bou condition experimentally at one end. It is found that crack location and crack depth produce noticeable effects in the first and second bending mode frequencies. Natural frequency decreases with increase in crack depth due to reduction in stiffness of the beam. It also decreases as the crack moves towards the fixed end. The reason is that the presence of crack near the fixed end reduces the stiffness near the support significantly. Contour lines of normalized frequencies obtained from three dimensiona surface plot of normalized frequency with crack depth and location are used to identify the crack depth and location. It is a method for predicting the location and depth of the crack based on changes in the natural frequencies of the tool under operatin
ACKNOWLEDGEMENTS
The authors acknowledge Advanced Dynamic Control Lab (ADCL) in College of Engineering, Trivandrum for their technical support for this work.
REFERENCES
[1] Ertugrul Cam, Sadettin Orhan, Murat Luy, “An
analysis of cracked beam st
echo method”, NDT&E International 38, 2005, pp.368–373
[Vol-2, Issue-8, Aug- 2016] ) ISSN : 2454-1311
Page | 1322
common point, which indicates the location and depth of
: Crack identification technique using frequency contours
CONCLUSIONS
Modal Analysis (EMA) matches with Operational Modal Analysis (OMA) of an intact with an error of 2.2% for first mode and 3.9% for second mode. It is due to the additional mass of the reference accelerometer used in the OMA as compared to EMA, accelerometer is only used for measuring the response. OMA is conducted for beams having crack at different position and location and it matches with numerical analysis values with a maximum error of 3.8%, because it is very difficult to achieve fixed boundary condition experimentally at one end. It is found that crack location and crack depth produce noticeable effects in the first and second bending mode frequencies. Natural frequency decreases with increase in crack depth due to f the beam. It also decreases as the crack moves towards the fixed end. The reason is that the presence of crack near the fixed end reduces the stiffness near the support significantly. Contour lines of normalized frequencies obtained from three dimensional surface plot of normalized frequency with crack depth and location are used to identify the crack depth and location. It is a method for predicting the location and depth of the crack based on changes in the natural frequencies of the tool under operating conditions.
ACKNOWLEDGEMENTS
Advanced Dynamic Control Lab (ADCL) in College of Engineering, Trivandrum for their technical support for this work.
REFERENCES
Infogain Publication (Infogainpublication.com) ISSN : 2454-1311
[2] Sadettin Orhan, “Analysis of free and forced
vibration of a cracked cantilever beam”, NDT&E International 40, 2007, pp.443–450.
[3] X. F. Yang, A. S. J. Swamidas, R. Seshadri, “Crack
identification in vibrating beams using the energy method”, Journal of Sound and vibration 244(2), 2001, pp.339-357.
[4] D.Y. Zheng, N.J. Kessissoglou, “free vibration
analysis of a cracked beam by finite element method”, Journal of Sound and Vibration 273, 2004, pp.457–475.
[5] Jyoti K. Sinha, Michael I. Friswell, “Simulation of the dynamic response of a cracked beam”, Computers and Structures 80, 2002, pp.1473–1476.
[6] Kaushar H. Barad, D. S. Sharma, Vishal Vyas,
“Crack detection in cantilever beam by frequency based method”, Procedia Engineering 51, 2013, pp.770 – 775.
[7] H. Nahvi, M. Jabbari, “Crack detection in beams using experimental modal data and finite element model”, International Journal of Mechanical Sciences 47, 2005, pp.1477–1497.
[8] N. T. Khiem, T. V. Lien, “Simplified method for natural frequency analysis of a multiple cracked beam”, Journal of Sound and Vibration 245(4), 2001, pp.737-751.
[9] Jacek Grosel, Wojciech Sawicki, Wojciech Pakos, “Application of Classical and Operational Modal
Analysis for Examination of Engineering
Structures”, Procedia Engineering 91, 2014, pp.136 – 141.
[10]P. Mohanty, D.J. Rixen., “Identifying Mode Shapes
and Modal Frequencies by Operational Modal Analysis in the Presence of Harmonic Excitation” Society for Experimental Mechanics, VoL 45, 2005, pp.213-220.