http://www.ijcmph.com pISSN 2394-6032 | eISSN 2394-6040
Original Research Article
A cross sectional study to find out the magnitude of “at risk” children
(showing growth faltering/decline) among under-five population
attending anganwadi centres in Bhopal district, Madhya Pradesh
Shailendra Meena
1*, D. M. Saxena
1, Vishal Bankwar
1, Pratibha Meena
2INTRODUCTION
Malnutrition is the most widespread condition affecting the health of children. Scarcity of suitable foods, lack of purchasing power of the family as well as traditional beliefs and taboos about what the baby should eat, often lead to an insufficient balanced diet, resulting in
malnutrition.1 Any child is considered “at risk” of malnutrition if he/she was present with any one or more of the factors like, low birth-weight, multiple pregnancies: twins, triplets,birth order of five and above, pregnancy in the mother before the child is 9 months old, recent measles, whooping cough, diarrhoea or other serious illness, history of malnutrition or death in a
ABSTRACT
Background: In our country the state of under-nutrition was recognized/diagnosed too late or not at all, and therefore the effort to alleviate undernutrition was also delayed. The timely recognition of “at risk” children (showing growth faltering/decline) liable for undernutrition can avert wasting; stunting and prevent severe malnutrition due to concomitant infections and other complications.
Methods: A community based cross-sectional study was carried out in urban and rural area of Bhopal district, Madhya Pradesh, among under-5 children attending anganwadi centres. All the children enrolled among selected urban and rural AWCs were taken as study population. Primary information regarding “at risk” children (showing growth faltering/growth decline) was obtained by reviewing last one year growth monitoring records available.
Results: There were total 10 anganwadi centres visited and growth monitoring record of last one year was analysed. There were total 1230 children enrolled in anganwadi centres under study. As per the available record we found that 416 (33.82%) of the total children enrolled in the anganwadi centres under study were “at risk” of malnutrition. The magnitude of at risk children was almost double in the urban area (43.24%) as compare to the rural area (23%). This difference was found statistically significant. Gender wise distribution of “at risk” children shows that there is marginal difference in the magnitude of “at risk” status among boys (34.57%) and girls (33.06%) and similar difference was found in urban and rural anganwadi centres under study.
Conclusions: The study conclude that children belong to 2 to 4 year age group are “at risk” of under nutrition. Both the genders are equally susceptible of under nutrition though children belong to urban area had more risk as compare to rural area.
Keywords: At risk child, Growth faltering, Growth decline, Undernutrition, ICDS, Bhopal
1
Department of Community Medicine, 2Department of Pathology, L N Medical College and Research centre, Bhopal, Madhya Pradesh, India
Received: 02 March 2018
Revised: 29 March 2018
Accepted: 31 March 2018
*Correspondence:
Dr. Shailendra Meena,
E-mail: [email protected]
Copyright: © the author(s), publisher and licensee Medip Academy. This is an open-access article distributed under the terms of the Creative Commons Attribution Non-Commercial License, which permits unrestricted non-commercial use, distribution, and reproduction in any medium, provided the original work is properly cited.
sibling, lack of weight gain in the last 2 months, social problems: (a) Illegitimate or abandoned child, or a one-parent family (b) Unemployment, chronic illness or alcoholism in a parent (c) Socially deprived ethnic groups.2
Malnutrition is called an “invisible” emergency because, much like iceberg, its deadly menace lies mostly hidden from view.3 It refers to a pathological state resulting from a relative or absolute deficiency or excess of one or more essential nutrients.4 In the current time the three indices - weight-for-age, height/length-for age, weight-for- height/length are used to identify three nutrition
conditions: underweight, stunting and wasting,
respectively. Each of the three nutrition indicators is expressed in standard deviation units (Z-scores) from the median of the reference population based on which under nutrition may be further classified as moderate or severe. Under nutrition is by far the most important and single cause of illness and deaths globally, accounting for 12% of all deaths and 16% of disability-adjusted life year lost.5
It is primarily due to (a) an inadequate intake of food (food gap) both in quality and quantity, and (b) infections notably diarrhoea, respiratory infections, measles and intestinal worms which increase requirements for calories, protein and other nutrients, while decreasing their absorption and utilization. It is a vicious circle – infection contributing to malnutrition and malnutrition contributing to infection, both acting synergistically.6 Malnutrition is a man-made disease which often starts in the womb and ends in the tomb. It is associated with increased morbidity, growth faltering, developmental retardation and significant mortality. A number of studies have also demonstrated a relationship between growth status, school performance and intellectual achievement.7
India is home to the largest number of children in the world, significantly larger than the number in China. The country has 20 per cent of the 0-4 years‟ child population of the world.8 The prevalence of child under nutrition in India is among the highest in the world; nearly double that of Sub-Saharan Africa, with dire consequences for morbidity, mortality, productivity and economic growth.9 In India 20 per cent of children under five years of age suffer from wasting due to acute under nutrition, 43% are underweight and 48 per cent (i.e. 61 million children) are stunted.10 In Madhya Pradesh as per NFHS-4, 42% of children of under-five age group are stunted, or too short for their age, which indicates that they have been undernourished for some time. 25% are wasted, or too thin for their height, which may result from inadequate recent food intake or a recent illness. 42.8% are underweight, which takes into account both chronic and acute undernutrition.11
There is a great opportunity of preventing and treating under nutrition in children attended by anganwadi workers and the health workers during growth monitoring and acute illnesses. These children missed during this
period will eventually develop under nutrition in the due course of time. It could have been prevented by the health worker and the anganwadi workers in the early stage by home based care and by providing proper information to care takers/mothers on proper nutrition during sickness and recovery.5
Need of the study
The timely recognition of “at risk” children (showing growth faltering/decline) liable for under-nutrition can avert wasting; stunting and prevent severe malnutrition due to concomitant infections and other complications. In our country the state of undernutrition was recognized/ diagnosed too late or not at all, and the effort to alleviate under-nutrition was also delayed.12 Studies on attributes responsible for under five malnutrition are available both at global and national level but reliable data on the magnitude of “at risk” children (showing growth faltering/decline) and related factors is not available. Thus there is a need to study the magnitude of “at risk” children and related factors with their “at risk” status so as to develop strategy and/or interventions for primary prevention of under nutrition.
Objective
To find out the magnitude of “at risk” children among under-five population attending anganwadi centres in Bhopal district, MP.
METHODS Study design
It was a community based observational study.
Area of study
The urban and rural ICDS projects of Bhopal district.
Duration of study
The study was conducted over a period of one year that is from July 2014 to June 2015.
Study population
The target population in the urban setting was the under-five children population attending anganwadi centres while in the rural setting it was the under-five children population attending anganwadi centres of rural ICDS block of Bhopal district.
Sampling frame
The sample unit
Sampling unit was an under-five child.
Sampling method and sample size
Bhopal district has a total of 10 ICDS projects (3 rural and 7 urban) and these 10 ICDS project consist of total 1618 anganwadi centres. One ICDS project was selected by simple random sampling from urban area and one from rural area. From the above selected urban and rural ICDS project, 5 anganwadi centres from each project was selected by simple random sampling. There were total 10 anganwadi centres visited and growth monitoring record of last one year was analysed. There were total 1230 children enrolled in anganwadi centres under study, which provide us a sample size of 1230.
Inclusion criteria
All under five children, who are “at risk” i.e. showing growth faltering or decline and all those children who developed undernutrition during the study period were included as study subjects. These children were enrolled from the selected anganwadi centres and included only when mothers were willing to participate in the study.
Exclusion criteria
Exclusion criteria were children whose mothers are not willing to participate and healthy children attending anganwadi centre and seriously ill children.
Study tools
Two types of instruments were used: a structured
questionnaire and anthropometric measurements
including weight, height and MUAC.
Data source and method of data collection
Data collection was started after obtaining clearance from ethical committee and respective authorities of ICDS scheme in Bhopal district. Primary information regarding “at risk” children (showing growth faltering and decline) was obtained by reviewing last one year growth monitoring record, available at anganwadi centres. There were total 10 anganwadi centres visited and growth monitoring record of last one year was analysed. There were total 1230 children enrolled in anganwadi centres under study. Growth monitoring records of all these children were analyzed to find out magnitude of “at risk” children.
Data analysis
Data was managed by entering it into MS office. Data was analyzed using Epi-Info software for windows (Version 3.5.4. CDC, Atlanta, USA). Chi-square test was
applied as test of significance wherever required. A p-value < 0.05 is considered as statistically significant.
Ethical consideration
Children were enrolled in the study after taking informed consent from their caregivers.
Children and their caregivers had full liberty to leave the study at any point of time without affecting their services from anganwadi centres.
Full confidentiality of data was maintained
throughout the study.
RESULTS
Table 1: Residence and gender wise distribution of children enrolled among AWCs under study.
Gender Urban area (n=659) Rural area (n=571) Total children (n=1230)
n % n % n %
Male 335 50.83 281 49.21 616 50.08
Female 324 49.17 290 50.79 614 49.92
Table 2: Magnitude of "at risk" children in urban and rural anganwadi centres under study. Five AWCs in each area were covered.
AWCs under study Total children enrolled in selected AWCs Total "at risk" children %
Urban anganwadi centres 659 285 43.24
Rural anganwadi centres 571 131 23
Total 1230 416 33.82
Chi-square test was applied. Chi-square value 56.4. P≤0.001
Table 3: Residence and gender wise distribution of “at risk children” in the anganwadi centres under study.
AWCs under study Boys enrolled in
selected AWCs
Boys "at risk" (%)
Girls enrolled in selected AWCs
Girls "at risk" (%)
Urban anganwadi centres 335 154 (46) 324 131 (40)
Rural anganwadi centres 281 59 (21) 290 72 (24.83)
Total 616 213 (34.57) 614 203 (33.06)
Table 4: Distribution of "at risk" children as per gender and place of residence (n=305).
Gender Urban area (n=192) % Rural area (n=113) % Total (n=305) %
Boys 93 48.43 52 46.01 145 47.54
Girls 99 51.56 61 53.99 160 52.46
Table 5: Distribution of “at risk” children as per age group and residence (n=305).
Age in months Urban area (n=192) % Rural area (n=113) % Total (n=305) %
1–12 3 1.6 4 3.5 7 2.30
13–24 20 10.4 13 11.5 33 10.82
25–36 67 34.9 27 23.9 94 30.82
37–48 53 27.6 33 29.2 86 28.20
49–60 49 25.5 36 31.9 85 27.87
Total 192 100 113 100 305 100
Table 6: Distribution of mothers of “at risk” children according to educational status in urban and rural area (n=305).
Mother's education Urban area (n=192) % Rural area (n=113) % Total (n=305) %
Illiterate 61 31.8 38 33.6 99 32.5
Primary 60 31.3 25 22.1 85 27.9
Middle 47 24.5 29 25.7 76 24.9
High school 12 6.3 14 12.4 26 8.5
12th 10 5.2 5 4.4 15 4.9
Graduate 2 1 2 1.8 4 1.3
Table 7: Distribution of “at risk” children according to socio-economic status (Prasad’s classification) (n=305).
Socio economic status Urban area (n=192) % Rural area (n=113) % Total (n=305) %
I 0 0 1 0.9 1 0.3
II 19 9.9 7 6.2 26 8.5
III 56 29.2 34 30.1 90 29.5
IV 100 52.1 58 51.3 158 51.8
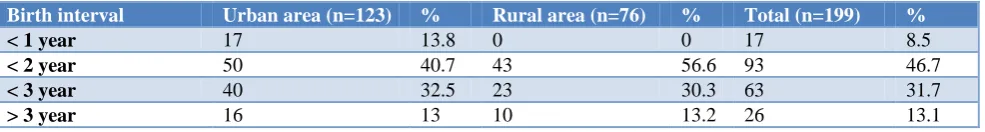
Table 8: Distribution of "at risk" children as per the birth interval with previous child (n=199).
Birth interval Urban area (n=123) % Rural area (n=76) % Total (n=199) %
< 1 year 17 13.8 0 0 17 8.5
< 2 year 50 40.7 43 56.6 93 46.7
< 3 year 40 32.5 23 30.3 63 31.7
> 3 year 16 13 10 13.2 26 13.1
DISCUSSION
The magnitude of “at risk” children was obtained by analysing the last one year growth monitoring records of selected AWCs. There were total 10 anganwadi centres were selected, five each from one urban and one rural ICDS blocks of Bhopal district. There were total 1230 children enrolled in the selected anganwadi centres, 659 in the urban anganwadi centres and 571 in the rural anganwadi centres. There were total 616 boys and 614 girls among the total enrolled children (Table 1).
After analysing the last one year growth monitoring record of selected anganwadi centres in urban and rural area, we obtained the magnitude of “at risk” child was 33.82% (Table 2). Children showing growth faltering and decline for two consecutive months and those children who were not gaining weight as per the age were considered as “at risk” child. When we compared the urban and rural areas it was found to be more prevalent in the urban areas (43.24%) then the rural areas (23%). Gender wise prevalence of “at risk” child was almost similar as 34.57% and 33.06% respectively (Table 3). We were not able to find out any relevant research in the available literature related to “at risk” child concept of ICDS scheme therefore we were not able to compare our study findings with other studies.
Out of the total 1230 children enrolled in various anganwadi centres under study, we selected 416 children who were “at risk” of malnutrition. We were able to contact 305 mothers of “at risk” children because rest of the children (111) were either out of station or changed their residence at the time of visit.
Out of the total 305 “at risk” children 192 belongs to urban anganwadi centres and 113 belongs to rural anganwadi centres. 145 (47.54%) were boys and 160 (52.46%) were girls. The proportion of “at risk” girls was slightly higher in urban and rural anganwadi centres as 51.56% and 53.99% compared to “at risk” boys 48.43% and46.01% respectively (Table 4). Among overall “at risk” children, maximum (30.82%) belongs to 25 to 36 months age group. In the urban area maximum number of “at risk” children belongs to 25-36 months (34.9%) age group and in the rural area maximum number of “at risk” children belongs to 49-60 months (31.9%) age group (Table 5).
Most of the mothers (32.5%) of “at risk” children were illiterate and similar pattern was observed in urban
(31.8%) as well as rural (33.6%) area. 31.3% mothers in urban area and 22.1% mothers in the rural area were only had primary education. These two categories together represent that 60.4% of mothers of “at risk” children either had no education or primary education and due to this reason mothers were not able to understand the concept of malnutrition and its prevention (Table 6). Even though they were repeatedly taught by AWWs about concept of growth monitoring they were not able to implement it and it leads to delay in the identification of children “at risk” of malnutrition. Sengupta et al, Mishra et al, Nale et al and Harishankar et al also reported significant relationship between mother educational status and malnutrition among under five children.13-16 Basit et al did not find out significant association between care takers/mothers educational status and malnutrition.17
In our study maximum numbers of “at risk” children were belong to fourth socio economic class (51.8) as per the Prasad‟s socio economic classification, followed by third socio economic class and fifth socio economic class (Table 7). Similar pattern was observed in urban and rural area. Similar to our observations Patel et al, Viramgami et al, Gupta et al and Patel et al also found that lower socio economic class had significantly higher prevalence of undernutrition.18-21 However Ahmad E et al found that lower socio economic class is not significantly associated with undernutrition among under-five children.22
CONCLUSION
The study conclude that children belong to 2 to 4 year age group are “at risk” of undernutrition. Both the genders are equally susceptible of undernutrition though children belong to urban area had more risk as compare to rural area. Majority of “at risk” children lives in nuclear families thus facing problem of proper care and adequate nutrition where the mother was involved in any kind of occupation. More than half of the mothers were illiterate and due to this they were not able to catch the various nutrition and health education messages displayed in AWCs or spread through multimedia by various government agencies. Most of the “at risk” children belong to IV class as per Prasad„s socio-economic classification thus reemphasize the importance of earning capabilities of family members also responsible for the risk of undernutrition, better earning families have less risk of undernutrition among their under five children. More number of siblings and low birth interval among siblings are other important factors that put them “at risk” of undernutrition.
Limitations of the study
We were not able to find out any association between the dependent and independent variables as there was no control available in our study. It was a descriptive study so we could only hypothesize that our observations may be the factors behind the “at risk” status of the children.
ACKNOWLEDGEMENTS
Authors express their sincere gratitude to Medical social workers, Anganwadi workers, mothers and children who have extended their co-operation during the period of study. Authors are also thankful to Joint Director, DPM and CDPOs of ICDS scheme, Department of women and Child welfare, Government of MP, for providing the permission and their constant support.
Funding: No funding sources Conflict of interest: None declared
Ethical approval: The study was approved by the Institutional Ethics Committee
REFERENCES
1. Park K. Nutrition and Health. In Park‟s Text book of Preventive and Social Medicine. 22nd ed. Jabalpur, MP: Banarsidas Bhanot publishers; 2013: 608-667.
2. World Health Organization. Practical Mother and Child Health in Developing Countries Book 1 Chapter 11 The Under-fives‟ Clinic. Available at http://www.oxfordjournals.org/our_journals/tropej/o nline/chapter11.pdf. Accessed on 6 September 2015. 3. Bhat BV. In Protein Energy. Ist Edition. New Delhi:
Peepee publishers and distributors (P) Ltd; 2008.
4. Dhaar GM, Robbani I. In Foundation of Community
Medicine, 2nd ed. Noida, India: Published by Elsevier, a division of Reed Elsevier India Private Limited, Noida. India: 2008
5. Akugizibwe R, Kasolo J, Duncan B, Makubuya, Ali
DM. Missed opportunities in the diagnosis and management of protein energy malnutrition among children under 5 years in Wakiso district, Uganda. J Public Health Epidemiol. 2013;5(11):463–70.
6. Pelletier JG. Children in tropics, severe
malnutrition: A Global approach, 1993: 208-209. 7. Elizabeth KE. Protein Energy Malnutrition. In
Nutrition and Child development. Paras Medical Publisher, Hyderabad, 2005: 133-187.
8. Situation of children in India-A profile: United Nations Children‟s Fund (UNICEF) 73 Lodi Estate, New Delhi – 110003, 2011. Available at: https://www.unicef.in. Accessed on 6 September 2015.
9. India Under-nourished Children World Bank report.
Available at:
http://siteresources.worldbank.org/SOUTHASIAEX
T/Resources/223546-1147272668285/IndiaUndernourishedChildrenFinal. pdf. Accessed on 6 September 2015.
10. National Family Health Survey (NFHS-3) India 2005-06. Nutrition in India. Ministry of Health and Family Welfare. Government of India Available at: http://www.motherchildnutrition.org/india/pdf/nfhs3 /mcn-NFHS-3-Madhya-Pradesh-state-report.pdf. Accessed on 6 September 2015.
11. National Family Health Survey-4 2015 -16
International Institute for Population Sciences (Deemed University) Mumbai State Fact Sheet
Madhya Pradesh. Available at:
http://rchiips.org/NFHS/pdf/NFHS4/MP_FactSheet. pdf. Accessed on 6 September 2015.
12. IMPROVING CHILD NUTRITION: The
achievable imperative for global progress United Nations Children‟s Fund (UNICEF) April 2013.
Available at:
http://www.unicef.org/media/files/nutrition_report_ 2013.pdf. Accessed on 6 September 2015.
13. Sengupta P, Philip N, Benjamin AI.
Epidemiological correlates of under-nutrition in under-5 years children in an urban slum of Ludhiana. Health and Population: Perspectives and Issues: 2010;33(1):1-9.
14. Mishra K. Risk Factors for Severe Acute
Malnutrition in Children below 5 year of Age in India: A Case-Control Study. Indian J Pediatr. 2014;81(8):762-5.
15. Shankar H, Dwivedi S. Correlates Birth Order and Literacy with Nutritional Status under „6‟ Children in Rural Area of Allahabad, India. Asian J Modern Ayurvedic Med Sci. 2012;1(1):257-62.
16. Nale T, Chavan MK, Mahajan H, Mahajan A.
Evidence from Community Based Study in India. Int J Scientific Res Public. 2013;3(2):1-5.
17. Basit A, Nair S, Chakraborthy KB, Darshan BB, Kamath A. Risk factors for undernutrition among children aged one to five years in Udupi taluk of Karnataka, India: A case control study. Australasian Medical J. 2012;5(3):163-7.
18. Patel KA, Langare SD, Naik JD, Rajderkar SS. Gender inequality and bio-social factors in nutritional status among under five children attending anganwadis in an urban slum of a town in Western Maharashtra, India. J Res Med Sci. 2013;18(4):341–5.
19. Viramgami AP, Vala MC, Sharma S, Sheth A,
Ninama R, Verma PB. Study of socio-demographic profile of malnourished children residing in urban slums of Rajkot city, Gujarat, India. Int J Res Med. 2014;3(2):53-6.
20. Sengupta P, Philip N, Benjamin AI.
Epidemiological correlates of under-nutrition in under-5 years children in an urban slum of
Ludhiana. Hlth Population Perspect Iss.
2010:33(1);1-9.
21. Patel B, Gandhi DJ. Nutritional Status of Rural Children Aged Six Months to Five Years in Vadodara District of Gujarat. J Evol Med Dental Sci. 2014;3(14):3644-51.
22. Ehtisham A, Khalil S, Khan Z. Nutritional status in children (1-5 yrs) A Rural Study. Indian J Comm Health. 2011;23(2);84-6.
23. National Family Health Survey (NFHS-3) India 2005-06. Nutrition in India. Ministry of Health and Family Welfare. Government of India. Available at:http://www.motherchildnutrition.org/india/pdf/nf hs3/mcn-NFHS-3-Madhya-Pradesh-state-report.pdf. Accessed on 6 September 2015.
24. Shahjada A, Sharma BK, Sharma S, Mahashabde P,
Bachhotiya A. Effect of birth interval on nutritional status of under five children in periurban area of Madhya Pradesh, India. Int J Med Sci Public Health. 2014;3:723-6.
25. Rayhan IM, Khan SHM. Factors Causing
Malnutrition among under-five Children in
Bangladesh. Pakistan J Nutr. 2006:5(6):558-62. 26. Patel B, Gandhi DJ. Nutritional Status of Rural
Children Aged Six Months to Five Years in Vadodara District of Gujarat. J Evol Med Dent Sci. 2014;3(14):3644-51.