www.impactjournals.com/oncotarget/ Oncotarget, Vol. 7, No. 48
GBM heterogeneity as a function of variable epidermal growth
factor receptor variant III activity
Olle R. Lindberg1, Andrew McKinney1, Jane R. Engler1, Gayane Koshkakaryan2,
Henry Gong1, Aaron E. Robinson1, Andrew J. Ewald3, Emmanuelle Huillard4, C.
David James5, Annette M. Molinaro1,6,7, Joseph T. Shieh8, Joanna J. Phillips1,6,9 1Department of Neurological Surgery, Brain Tumor Center, University of California, San Francisco, CA, USA
2Touro University California, College of Osteopathic Medicine. Vallejo, CA, USA
3Departments of Cell Biology, Oncology, and Biomedical Engineering, School of Medicine, Johns Hopkins University, Baltimore,
MD, USA
4Université Pierre et Marie Curie (UPMC) UMR-S975, Inserm U1127, CNRS UMR7225, Institut du Cerveau et de la Moelle
Epiniere, Paris, France
5Department of Neurological Surgery, Feinberg School of Medicine, Northwestern University, Chicago, IL, USA 6Helen Diller Family Comprehensive Cancer Center, University of California, San Francisco, CA, USA
7Epidemiology and Biostatistics, University of California, San Francisco, CA, USA
8Institute for Human Genetics, Department of Pediatrics, University of California, San Francisco, CA, USA 9Department of Pathology, Division of Neuropathology, University of California, San Francisco, CA, USA
Correspondence to: Joanna J. Phillips, email: [email protected]
Keywords: RTK activity, extracellular matrix, tumor heterogeneity, vessel co-option, invasion
Received: August 06, 2016 Accepted: September 29, 2016 Published: October 12, 2016
ABSTRACT
Abnormal activation of the epidermal growth factor receptor (EGFR) due to a deletion of exons 2-7 of EGFR (EGFRvIII) is a common alteration in glioblastoma (GBM). While this alteration can drive gliomagenesis, tumors harboring EGFRvIII are heterogeneous. To investigate the role for EGFRvIII activation in tumor phenotype we used a neural progenitor cell-based murine model of GBM driven by EGFR signaling and generated tumor progenitor cells with high and low EGFRvIII activation, pEGFRHi
and pEGFRLo. In vivo, ex vivo, and in vitro studies suggested a direct association
between EGFRvIII activity and increased tumor cell proliferation, decreased tumor cell adhesion to the extracellular matrix, and altered progenitor cell phenotype. Time-lapse confocal imaging of tumor cells in brain slice cultures demonstrated blood vessel co-option by tumor cells and highlighted differences in invasive pattern. Inhibition of EGFR signaling in pEGFRHi promoted cell differentiation and increased cell-matrix
adhesion. Conversely, increased EGFRvIII activation in pEGFRLo reduced cell-matrix
adhesion. Our study using a murine model for GBM driven by a single genetic driver, suggests differences in EGFR activation contribute to tumor heterogeneity and aggressiveness.
INTRODUCTION
Glioblastoma (GBM) is the most common primary malignant brain tumor in adults and is characterized by intertumoral and intratumoral heterogeneity [1–4], including differences in genomic and epigenomic alterations [5, 6], invasive phenotype [7], and RTK signaling pathway activity [8]. Although gene expression
analysis of bulk tumor tissue suggests tumors can be
divided into discrete transcriptionally-defined subgroups
[6, 9], the analysis of multiple samples from the same tumor frequently reveals striking intratumoral diversity in gene copy number, mutations, and stem cell signature [2-4, 10]. GBM heterogeneity endows this cancer with an ability to adapt to and evade the anti-tumor effects of nearly any therapy. Thus, despite the development and
application of targeted therapeutics based on an improved understanding of GBM molecular characteristics [11–15], tumor heterogeneity continues to confound efforts for improving GBM treatment outcomes.
The most common RTK alteration in GBM is of the epidermal growth factor receptor (EGFR) and altered EGFR signaling is considered a driver of malignant characteristics in up to 45% of tumors. EGFR is frequently
amplified in GBM [11] and approximately 20-30% of amplified tumors express a constitutively active variant of
EGFR, EGFRvIII or EGFR*, which contains a deletion of exons 2-7 [11, 16–20]. Several cancers are driven by altered EGFR signaling, yet associations between total receptor levels, activation levels, and clinical outcome
have been mixed [21–23]. In GBM, increased expression
of EGFR or EGFRvIII are also not clearly associated with decreased overall survival [18, 24–27] and a link between EGFR activation and outcome in GBM is yet to be determined.
EGFR signaling is important to the normal biology of neural stem cells (NSCs), and promotes the transition from a quiescent to an activated state [28]. In the murine postnatal brain, EGFR expression in NSCs is reduced upon neuronal lineage commitment. Aberrant activation of EGFR in neural and glial progenitor cells, either via genetic manipulations or by treatment with exogenous ligand, induces aberrant proliferation of cells with glial features, and can lead to the formation of tumor-like
lesions [29–32].
The constitutive activation of EGFR conferred by EGFRvIII results in altered signaling relative to ligand-mediated activation of the full-length receptor with respect to activated downstream pathways, intracellular
signaling molecules, and epigenetic regulators [33–35].
Complex cross-talk between signaling pathways in human GBM and GBM cell lines can complicate the investigation of activation of a single RTK. Using an immune competent murine model for glioma, based on the genetic manipulation of neural progenitor cells and driven by EGFRvIII, we identify the activity level of EGFRvIII as a determinant of tumor cell aggressiveness.
RESULTS
Generating tumor progenitor cells with differences in EGFRvIII activation
To generate tumor progenitor cell lines exhibiting divergent EGFRvIII activation, we used a model for high
grade astrocytoma developed in mice [36]. In this model
neural progenitor cells (NPCs) are isolated from the subventricular zone of Ink4a/Arf null mice and transduced with the human EGFRvIII. This and similar models making use of neural stem cells and EGFRvIII overexpression are known to produce tumors heterogeneous in growth and
survival [37, 38]. Lysates from EGFRvIII-transduced cells
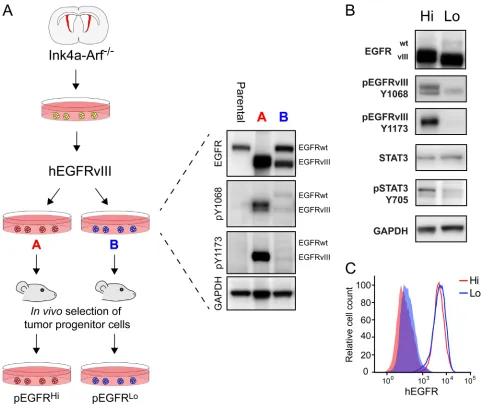
derived from the same pool of parental NPCs revealed two lines with divergent EGFRvIII activity as determined by Western blotting, denoted line A and line B (Figure 1A). While both cell lines had increased EGFR activity relative to parental NPCs, only line A with high EGFRvIII activity had a decrease in expression of the full-length endogenous EGFRwt. To generate tumor progenitor cells, the two EGFRvIII-transduced lines were transplanted intracranially into syngeneic mice and the resulting tumors were propagated as tumorspheres in minimal essential media in vitro as pEGFRHi and pEGFRLo, respectively
(Figure 1A).
Following in vivo passage and selection of tumor progenitor cells, the relative differences in EGFR activity were preserved. pEGFRHi had increased abundance of
phosphorylated EGFRvIII, as evidenced at Y1173 and
Y1068 tyrosine residues compared to pEGFRLo (6.5- and
2.86-fold p-EGFR/total, respectively; p<0.005, n=4). Differences in EGFRvIII activation were not due to differences in total expression of EGFRvIII or differences in cell surface expression of EGFRvIII (Figure 1B and 1C). pEGFRHi also had increased STAT3 activation
(6.89-fold; p>0.001, n=4), based on Y705 tyrosine residue phosphorylation (Figure 1B).
EGFRvIII activity associated with more
aggressive tumors and gene expression signature
Orthotopic transplants of pEGFRHi and pEGFRLo revealed significant differences in tumor growth in vivo. While both groups developed signs of tumor by 42 days post transplant, the median survival of mice harboring pEGFRHi cells was 21 days versus 31 days for
pEGFRLo cells (p<0.0001, n=6) (Figure 2A). The more
aggressive pEGFRHi resulted in greater tumor burden
than pEGFRLo even at comparable median survival time
points. Enumeration of ZsGreen tagged tumor cells by
fluorescence-activated cell sorting (FACS), revealed an
8.7-fold increase in pEGFRHi versus pEGFRLo tumor cells
at respective median survival time points (p=0.001, n=6) (Figure 2B) and increased tumor area (p<0.05) (Figure 2C).
To investigate in vivo gene expression differences
associated with increased EGFRvIII activity,
fluorescently-tagged tumor cells were isolated by FACS from tumors and differential gene expression was determined by microarray analysis at median survival ±1 day (Figure 2D). KEGG pathway annotation of differentially expressed genes
identified enrichment of processes related to proliferation
and DNA repair in pEGFRHi tumors. Conversely,
processes associated with cell-matrix interactions and the glycocalyx were enriched in pEGFRLo tumor cells,
‘long-term potentiation’, were also enriched in pEGFRLo
(Figure 2E).
Increased in vivo tumor burden, as defined by
increased tumor cell number (Figure 2B), increased tumor area (Figure 2C), and enrichment of genes involved in DNA replication (Figure 2E) suggested increased proliferative capacity in pEGFRHi versus pEGFRLo cells.
In vitro, pEGFRHi had increased incorporation of EdU
(p<0.01) and greatly reduced doubling time compared to pEGFRLo (Figure 2F and 2G), reflecting an increased
rate of proliferation. No differences in apoptosis were appreciated based on immunohistochemical analysis of
cleaved caspase 3 in tumors (data not shown).
While EGFRvIII lacks a ligand-binding domain and can be activated independent of EGF ligand, EGFRvIII can act as a substrate for EGF-activated
full-length EGFR [39]. To assess the role for EGF
ligand-mediated signaling in the two lines, cell growth was compared in the absence of exogenous EGF ligand. While pEGFRHi maintained a high rate of proliferation,
the growth of pEGFRLo was decreased three-fold in the
absence of EGF (Figure 2H). These data suggest that the higher expression levels of full-length EGFR in pEGFRLo may confer some degree of ligand-mediated
[image:3.612.65.551.230.644.2]signaling in these cells that is not appreciated in pEGFRHi.
Figure 1: Generation of murine tumor cells with divergent EGFRvIII activity.A. Paradigm for generating murine tumor progenitor cells with divergent EGFR activation from Ink4a/Arf-null neural progenitor cells and EGFRvIII transduction. After transduction, EGFRvIII-transduced cells were assayed for EGFR expression and activity level using western blot and were subsequently passaged through syngeneic mice as intracranial tumors to create the pEGFRHi and pEGFRLo lines. B. Western blot analysis of pEGFRHi (Hi) and pEGFRLo (Lo) demonstrating differences in EGFRvIII phosphorylation at pY1068 and pY1173 and Stat3 phosphorylation at pY705. C.
Analysis of EGFRvIII surface levels on pEGFRHi (Hi) and pEGFRLo (Lo) cells using flow cytometry. Solid histograms represent negative
Figure 2: EGFRvIII activity associated with more aggressive tumors and gene expression signature.A. Kaplan-Meier survival curve comparing survival of mice transplanted with pEGFRHi and pEGFRLo tumor cells. Log-rank test median survival 21 versus 31 days, respectively (p<0.0001) B. Total number of ZsGreen-tagged tumor cells per brain enumerated by fluorescence-activated cell sorting (FACS). C. Area of brain involved by tumor as a percentage of total brain area per section with the greatest tumor. D. Schematic of isolation of tumor cells by FACS for microarray analysis. E. Enrichment of KEGG pathway processes in pEGFRHi versus pEGFRLo tumors
based on in vivo microarray analysis of gene expression in sorted cells. F.In vitro EdU incorporation in pEGFRHi and pEGFRLo following
a 2-hour pulse. G.In vitro doubling time of pEGFRHi (Hi) and pEGFRLo (Lo) cells. H. Growth of pEGFRHi (Hi) and pEGFRLo (Lo) cells in
Blocked differentiation in EGFRvIII highly activated tumor progenitor cells
As compared to pEGFRHi cells, pEGFRLo cells had
enriched expression of pathways associated with a more differentiated phenotype. Given that activation of EGFR
can drive proliferation of a neural progenitor cells we examined the expression of a panel of genes associated with neural stem and progenitor cell maturation.
Real-time quantitative PCR demonstrated increased expression of the immature stem cell markers Prom1 and
[image:5.612.93.520.141.624.2]Id1 in pEGFRHi (Figure 3A). Conversely, expression of
Figure 3: High EGFRvIII activity is associated with an immature stem cell phenotype and EGFRvIII-dependent block in differentiation.A. Gene expression of neural stem and progenitor lineage markers in pEGFRHi relative to pEGFRLo cells by
real-time quantitative PCR. B. Cell surface Prominin-1 expression in pEGFRHi (red) and pEGFRLo (blue) cells. Negative control in gray. Data
representative of triplicate experiments. C. Protein expression of neuronal and glial differentiation markers 3 days after differentiation in pEGFRHi and pEGFRLo cells. D and E. Representative images of GFAP (green) and nestin (red) expression after 7 days of differentiation
of pEGFRHi (D) and pEGFRLo cells (E). F and G. Representative images of GFAP (green) and nestin (red) expression after 7 days of
genes associated with cellular differentiation, such as
Tubb3 and Ascl1 (Mash1), were upregulated more than
40-fold in pEGFRLo. Olig2 and Dlx2 transcripts, genes
commonly expressed by progenitor cells, were also more highly expressed in pEGFRLo compared to pEGFRHi
(Figure 3A). Consistent with a more undifferentiated
phenotype, more than 95% of EGFRvIII-activated pEGFRHi tumor cells expressed Prominin-1 on their cell
surface (Figure 3B). In contrast, less than 2% of pEGFRLo tumor cells expressed Prominin-1 (Figure 3B).
In cell differentiation assays increased EGFRvIII activity in pEGFRHi cells was associated with reduced
differentiation potential relative to in pEGFRLo cells. The
pEGFRHi cells retained expression of nestin, a marker
of immature neural stem and progenitor cells, and had decreased expression of glial (O4 and GFAP) and neuronal
lineage markers (TUJ1/βIII-Tubulin) as compared to
pEGFRLo cells (Figure 3C). Even after 7 days of culture
under differentiation conditions pEGFRHi cells appeared
largely undifferentiated, and displayed a small round
cell-appearance with robust expression of nestin (Figure 3D).
pEGFRLo cultures, in contrast, contained a significant
population of GFAP-expressing cells, indicative of glial differentiation, and exhibited a bipolar or multipolar
morphology (Figure 3E).
To determine whether the lower differentiation potential of pEGFRHi cells was due to high EGFR
activation, we examined differentiation in the presence or absence of the EGFR tyrosine kinase inhibitor erlotinib. After 7 days of culture, pEGFRHi cells with
EGFR inhibition exhibited increased GFAP expression and altered cell morphology, with more elongate cells, as compared to control-treated pEGFRHi cells, which
retained their rounded, clumped morphology (Figure
3F-3H).
Multicellular co-option of the vasculature in EGFRvIII activated tumors
Both pEGFRHi and pEGFRLo tumors were highly infiltrative with involvement of the striatum, cerebral white
matter, and cortex (Figure 4A and 4B), yet the pattern of
tumor infiltration was different. At the invasive front,
pEGFRHi tumors formed dense multicellular invasive
cords of tumor cells (Figure 4C and 4E). In contrast, pEGFRLo tumors appeared diffusely infiltrative primarily
as single cells (Figure 4D and 4F). The pattern of invasion
was highly stable as 78% (18/23) of pEGFRHi and 84%
(16/19) of pEGFRLo secondary intracranial tumors retained
the pattern (Figure 4G). At the invasive tumor front, co-labeling of tumor cells and blood vessels revealed blood vessel co-option in both pEGFRHi and pEGFRLo tumors
(Figure 4H and 4I). Multicellular clusters of pEGFRHi
tumor cells were often identified in close association with
the vasculature.
To model these invasive behaviors ex vivo we injected tagged tumor cells into freshly isolated brain
slices and performed confocal imaging of
fluorescently-tagged tumor cells and lectin-labeled blood vessels. At 24 hours both pEGFRHi and pEGFRLo cells readily
invaded into brain slices and showed preferential co-option of blood vessels (Figure 5A and 5B). Similar to their respective in vivo patterns of invasion, pEGFRHi
cells generated multicellular clusters (Figure 5A) while pEGFRLo cells tended to extend as single cells along the vasculature (Figure 5B). Quantification demonstrated
nearly twice as many blood vessel-associated tumor
cells per 100 μm length of vessel in pEGFRHi compared
to pEGFRLo (Figure 5C). To distinguish multicellular
invasion from local tumor cell proliferation in the highly proliferative pEGFRHi cells, we performed time-lapse
confocal imaging of tumor cells in brain slice cultures over 24 hours. Both pEGFRHi and pEGFRLo tumor cells
invaded along blood vessels, but only pEGFRHi tumor
cells invaded as multicellular groups of cells (Figure 5D, Suppl video 1 (pEGFRHi) and 2 (pEGFRLo)).
Decreased cell adhesion and invasion in EGFRvIII highly activated tumor cells
Differences in in vivo and ex vivo invasion exhibited by pEGFRHi and pEGFRLo tumor cells suggested EGFRvIII activity may influence cell-ECM interactions. Tumor cells
plated on cell culture plates pre-coated with laminin,
collagen IV, or fibronectin revealed a marked difference in
cell adhesion between pEGFRHi and pEGFRLo. Increased
EGFRvIII activity was associated with a reduced ability to adhere to all substrates (Figure 6A-6C). To assess how
decreased cell adhesion may influence invasion in a 3D
matrix we utilized an in vitro matrigel invasion assay in which the primary components are laminin, collagen IV, and enactin/nidogen-1 [40, 41]. While pEGFRLo tumor
cells were highly invasive even by 16 hours, pEGFRHi
showed very limited invasion even after 24 hours (Figure 6D-6E). Thus, the increased EGFRvIII activity in pEGFRHi was associated with reduced adhesion and
reduced invasion in vitro.
To investigate whether reduced adhesion was due to increased EGFRvIII activity, cell adhesion assays were performed while modulating EGFR activity. Reduction of EGFR activity in pEGFRHi cells, using a 2-hour treatment
with erlotinib, demonstrated a 2.35-fold increase in
adhesion to collagen IV (p<0.01, n=6) (Figure 7A-7B). In contrast, adhesion was decreased when EGFR activity was acutely increased in pEGFRLo cells using the phosphatase
inhibitor sodium orthovanadate (NaOV) (Figure 7C-7D). Importantly, pEGFRLo cell adhesion could be restored
Figure 4: Blood vessel co-option and cohesive versus single cell invasion of tumor cells in vivo.A and B. pEGFRHi (A) and pEGFRLo (B) form large, invasive tumors highlighted by hEGFR immunohistochemisty. At the infiltrating tumor edge, pEGFRHiC and E. tumor cells form cohesive clusters of invading tumor cells while pEGFRLoD and F. tumor cells exhibit diffuse, single cell invasion
as demonstrated by representative images of H&E stained (C and D) and hEGFR immunolabeled tumor cells (E and F). G. Stability of cohesive and diffuse invasive phenotype in pEGFRHi (Hi) and pEGFRLo (Lo) tumors, respectively. Chi-square test for difference in invasive
pattern p<0.0001. H and I. Confocal images of blood vessel co-option by pEGFRHi (H) and pEGFRHi (I) tumor cells in vivo. Tumor cells labeled by hEGFR (green), blood vessels by isolectin IB4 (red), and nuclei by DAPI (blue). Scale bars: A and B = 500 μm, C-F = 50 μm, H and I = 100 μm.
by the restoration of well-organized stress fibers in treated
cells (Figure 7F-7H).
DISCUSSION
GBM are characterized by their heterogeneity, including tumor genetics [6], invasive phenotype [7], and RTK signaling activation [8]. This heterogeneity is an important prognostic factor in GBM and presents
a great therapeutic challenge [42]. Murine models for GBM provide a controlled genetic background to study
individual oncogenic events [43], however, there has not
been a major focus on modeling and studying the impact
of differences in RTK activity levels [37, 38, 44, 45].
The potential importance of RTK activity on disease is highlighted by elegant studies examining the cross-talk between constitutive versus ligand-dependent EGFR
phosphorylates EGFRvIII and promotes STAT3 activation,
[image:8.612.82.534.305.643.2]but can also disrupt EGFRvIII-induced NFkB signaling
[39, 46]. Moreover, ligand-independent activation of
EGFR results in non-canonical EGFR signaling through
the formation of an EGFR, TBK1, and IRF3 complex,
downstream effects of which include reduced sensitivity to chemotherapy [47]. Using a murine model for glioma, we demonstrate EGFRvIII activity-dependent regulation of cell differentiation and cell adhesion and associate these differences with altered animal survival and in vivo tumor growth and invasion. Our results suggest that the activity
of the EGFR signaling pathway, in addition to the specific
genetic alteration, is an important determinant of tumor aggressiveness.
The more aggressive pEGFRHi tumors exhibited
both increased proliferation and a more cohesive pattern of invasion as compared to pEGFRLo tumors. While increased
proliferation is a known driver of malignancy, differences in invasive pattern may also contribute. Indeed, tumor
progression following antiangiogenic therapy has been associated with a perivascular pro-invasive phenotype [48, 49].
Diffuse invasion of tumors cells is a characteristic feature of human GBM and contributes to poor prognosis, yet the pattern of invasion is heterogeneous [7] suggesting the contribution of multiple factors. Even within a single patient several patterns can often be observed and differences in cell adhesion, proteolysis, and migration may all contribute. Blood vessel co-option was prominent in pEGFRHi and pEGFRLo tumors, yet pEGFRHi invaded as
multicellular clusters while the less aggressive pEGFRLo
invaded as single cells. Single cell invasion of pEGFRLo
was associated with increased in vitro adhesion and increased in vivo expression of genes implicated in cell-matrix interactions, including integrins and proteoglycans. In pEGFRHi, inhibition of EGFR increased cell-matrix
adhesion and promoted a more differentiated phenotype.
While the identification of factors downstream of EGFR
Figure 5: Ex vivo slice cultures demonstrate blood vessel co-option and preferential multicellular clustering by pEGFRHi.A and B. Blood vessel co-option by both pEGFRHi and pEGFRLo tumor cells. At 24 hours after injection pEGFRHi cells (A) appear as cohesive clusters while pEGFRLo cells (B) exhibit a single-cell pattern. C. Blood vessel co-option in slice cultures quantified as tumor cell number/100 μm of blood vessel in pEGFRHi and pEGFRLo slice cultures at 24 hours. D. Time-lapse confocal imaging of invasion
Figure 6: EGFRvIII highly active tumor cells exhibit decreased cell adhesion and invasion in vitro.A-C. Adhesion of pEGFRHi and pEGFRLo cells to collagen IV (A), fibronectin (B), and laminin (C), matrices, expressed as fold-change relative to pEGFRHi. D. Representative images of matrigel 3D spheroid invasion assay and quantification of pEGFRHi and pEGFRLo invasion E. at 16hr and 24hr
normalized to pEGFRHi at 0 hours. Scale bars: A=50 μm. p<0.05 = *, p<0.01 = **, p<0.001 = ***. Error bars are displayed as standard error of mean (SEM). (A) n=4, (B and C) n=3, (E) n=4.
Figure 7: EGFRvIII activity dictates adhesion properties in mouse tumor cells.A. Western blot analysis of EGFR activation, as demonstrated by phosphorylation at Y1173, in control (Ctrl) and erlotinib (Erl) treated pEGFRHi tumor cells. B. EGFR inhibition increases adhesion of pEGFRHi cells to a collagen IV-coated substrate. C. Phosphorylation of EGFR at Y1173 in pEGFRLo cells treated with 0, 50 μM, and 500 μM of the phosphatase inhibitor sodium orthovanadate (NaOV). D. Reduced adhesion of pEGFRLo cells to collagen IV
in the presence of increasing concentrations of NaOV. E. NaOV-induced reduction in adhesion to collagen IV is restored by inhibition of EGFR by Erl in pEGFRLo cells. H-J. Representative confocal images of phalloidin labeled f-actin (green) and nuclei (blue) in control (H),
[image:9.612.117.494.380.627.2]that mediate cohesive invasion is a focus of future studies,
it is notable that by gene expression array fibronectin
(FN1) expression was elevated 5.8-fold in pEGFRHi
tumors. FN1 has previously been implicated in cohesive invasion in glioma and gene knockdown increased cell-matrix adhesion [50]. In addition, differences in protease activity or activation of other receptor tyrosine kinases
such as MET can have profound influences on tumor cell
invasion [49, 51].
Abnormal activation of EGFR in neural stem and progenitor cells promotes proliferation and is detrimental
to neuronal cell maturation [29–32]. pEGFRHi exhibited
profound alterations in progenitor cell phenotype with high expression of Prominin-1 and decreased ability to differentiate, which was at least partially dependent on EGFR activation. In immortalized neural stem cells, EGFRvIII expression has previously been associated with decreased differentiation, increased focal adhesion disassembly, and perivascular invasion in vivo [52]. In addition, a
CD133-expressing subset of EGFRvIII+ glioma cells was shown
to have increased self-renewal and tumorigenicity [53].
While several factors, including homozygous deletion of Ink4a/Arf-/- [37], likely contribute to the overall modest
degree of cell differentiation that we observed, our data strengthen the link between abnormal EGFR signaling pathway activity and aberrations in cell differentiation.
EGFRvIII is known to be expressed at varying levels within a tumor [54, 55] and the regulation of extrachromosomal EGFRvIII DNA is a major mechanism of treatment resistance [56]. Our data, in a genetically controlled background, suggest that the level of EGFR activation, not just the total protein levels, is an important determinant of tumor cell phenotype. Given the complexity of EGFR signaling and the multiple feedback loops and regulatory mechanisms [57], several factors may contribute to differences in EGFR activity and ultimately cellular behavior. These include differences in phosphatase activity, cell differentiation [58], receptor endocytosis, and the activity of other receptor tyrosine kinases [57]. Our data emphasize the importance of signaling pathway activity, in addition to the genetic status of EGFR, in tumor cell behavior and aggressiveness.
MATERIALS AND METHODS
Cell culture conditions and reagents
Murine neural stem cell and tumorspheres
were cultured as described previously [36, 59]. Three
dimensional invasion assays were performed as previously described [60]. EGF-dependent growth was calculated over three consecutive passages comparing cells cultured
in defined neurosphere media including fibroblast growth
factor in the presence and absence of added EGF (20 ng/ ml). For adhesion assays, wells of a 96-well plate were
coated with 2 μg/cm2 Laminin (Sigma L2020), 10 μg/
cm2 Collagen IV (Sigma C5533) or 5 μg/cm2 Fibronectin
(Sigma F1141). 1-5x10⁴ cells were plated per well and
incubated for 2 hours. For assays involving erlotinib and
sodium orthovanadate (NaOV) drug treatments, 1 μM erlotinib, 50 μM NaOV, or 500 μM NaOV was added
to cell suspension for the 2 hour duration of the assay. For adhesion assays using co-treatment of erlotinib and
NaOV, 1 μM erlotinib and 250 μM NaOV was used.
Protein lysates were prepared as previously described
[36]. Protein lysates for studying effects of erlotinib and
NaOV on EGFR phosphorylation were acquired after 2 hours of incubation in sphere suspension cultures. Images acquired for invasion and adhesion assays were acquired
using a DMI IL LED Leica microscope (Leica, Germany) and quantified using ImageJ 1.48v (http://imagej.nih.gov/
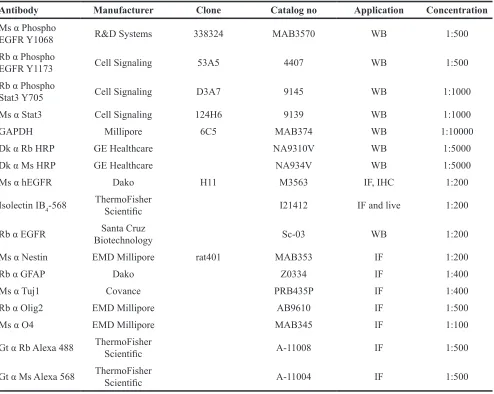
ij/). All antibodies used are described in Table 1.
Tumor cell isolation and RNA isolation
Tumor bearing brains were harvested from six mice with each tumor type and the cerebellum and olfactory
bulbs were removed. The brains were diced finely with a
razor, dissociated using Worthington’s Papain Dissociation
System (LK003150) and passed through a 70um filter to
obtain a single cell suspension. To remove myelin and red blood cells the cell suspension was re-suspended in
35% PercollTM (GE Healthcare) and underlaid with 70%
PercollTM. Following a 30 minute centrifugation purified
cells were removed from the interface between the 35%
and 70% layers and counted for viability. ZsGreen+ tumor cells were isolated by FACS using a BD FACSAria III into
TRIzol Reagent (Ambion Life Technologies, Japan), using
Dapi to exclude dead cells. Sorted cells were re-suspended
in TRIzol Reagent (Ambion Life Technologies, Japan) and RNA was purified using the RNeasy Mini Kit (Qiagen,
Germany) according to the manufacturers protocol.
In vivo transplantation
Dissociated cells were transplanted as previously
described previously [36, 59]. FVB mice (Charles River Laboratories, Wilmington, MA) were used for tumor microarray profiling experiments.
Immunohistochemistry
Murine tumor tissue for immunohistochemical
analysis was collected at first sign of tumor growth by perfusing mice with 4% paraformaldehyde and postfixed overnight in 4% PFA. Following postfixation tissue was
rinsed in PBS and stored in 70% ethanol until further
processing. Murine tumor paraffin embedded sections
analysis was performed on hematoxylin and eosin stained sections. Tumor area was analyzed on hEGFR-labeled
sections and quantified in ImageJ 1.48v (http://imagej.
nih.gov/ij/).
Ex vivo invasion and time-lapse imaging
Brains from P7-P21 FVB mice were dissected, put in cold aCSF, sectioned using a HM650V vibratome
(Thermo Fisher scientific, San Jose, CA) at thickness of 190 μm. Slices were incubated in RT aCSF for 30 mins prior to transfer to wells with a MilliCell-CM 40 μm
membranes (Millipore, Bedford, MA). For live imaging, ZsGreen expressing cells were injected underneath the slice using a Hamilton syringe (Hamilton, Reno, NV), for confocal analysis cells were deposited on top of slices using P10 pipette. For live imaging slices were imaged
after 2 hours of incubation at 37°C, using a Zeiss Observer Z1 equipped with a Zeiss Observer XL stage incubator (37°C, 5% CO2, humidified air) (Carl Zeiss, Germany)
and a Yokogawa spinning disc scanning unit (Yokogawa electric, Japan). Movies assembled using Zeiss imaging software (Carl Zeiss) at a single plane from images acquired over 6-8 hours. For confocal analysis, slices
were fixed using 4% paraformaldehyde in
phosphate-buffer saline 24 hours after tumor cell deposition, for 4-6 hours. A proteinase K antigen retrieval step was used to image hEGFR labeled tumor cells, followed by 1 hour of block/permabilization, 24-72 hours incubation in primary anti-human EGFR antibody antibody (Dako, Denmark,
Clone H11) at 4°C, and 2 hours incubation in secondary antibodies. Slices were washed in PBS 3-5 times after
[image:11.612.62.556.62.456.2]each antibody incubation step. Slices were mounted onto Superfrost plus glass slides and mounted using Dako
Table 1: Antibodies used
Antibody Manufacturer Clone Catalog no Application Concentration Ms α Phospho
EGFR Y1068 R&D Systems 338324 MAB3570 WB 1:500
Rb α Phospho
EGFR Y1173 Cell Signaling 53A5 4407 WB 1:500
Rb α Phospho
Stat3 Y705 Cell Signaling D3A7 9145 WB 1:1000
Ms α Stat3 Cell Signaling 124H6 9139 WB 1:1000
GAPDH Millipore 6C5 MAB374 WB 1:10000
Dk α Rb HRP GE Healthcare NA9310V WB 1:5000
Dk α Ms HRP GE Healthcare NA934V WB 1:5000
Ms α hEGFR Dako H11 M3563 IF, IHC 1:200
Isolectin IB4-568 ThermoFisher Scientific I21412 IF and live 1:200
Rb α EGFR BiotechnologySanta Cruz Sc-03 WB 1:200
Ms α Nestin EMD Millipore rat401 MAB353 IF 1:200
Rb α GFAP Dako Z0334 IF 1:400
Ms α Tuj1 Covance PRB435P IF 1:400
Rb α Olig2 EMD Millipore AB9610 IF 1:500
Ms α O4 EMD Millipore MAB345 IF 1:100
Gt α Rb Alexa 488 ThermoFisher Scientific A-11008 IF 1:500
Gt α Ms Alexa 568 ThermoFisher Scientific A-11004 IF 1:500
Abbreviations: Ms, mouse; Rb, rabbit; Dk, donkey; Gt, goat; WB, Western blotting; IF, immunofluorescence; IHC,
fluorescent mounting media (Dako, Denmark). Images were acquired on a Zeiss LS780 laser confocal microscope
(Carl Zeiss).
Differentiation assay
Cells were prepared as a single cell suspension in normal culture media, 500-1000 cells per well were added to a laminin/poly-d-lysine coated 8-well culture slide (BD
Biocoat 354688, BD biosciences) in 300 μL growth media.
The culture slides were incubated overnight and the media
carefully removed and replaced with 300 μL of neurobasal
(Thermo Fisher) + 2% FBS to induce differentiation.
For studies using erlotinib, erlotinib (1 μM) or DMSO
was included in differentiation media. Culture slides
were incubated for 3 to 7 days, then fixed in 4% PFA.
After immunolabeling, six images per well were taken
on a Zeiss Axioimager M1 or a Zeiss LSM780 confocal
microscope (Carl Zeiss), counted for positivity in ImageJ 1.48v and averaged.
Visualization of f-actin cytoskeleton
pEGFRLo cells were fixed in 4% PFA 2 hours after
seeding cells onto laminin/poly-d-lysine coated 8-well culture slides (BD biosciences). F-actin was visualized
using Alexa fluor-546 phalloidin according to the
manufacturer’s instructions (Thermo Fisher). Cells were
treated with DMSO, 250 μM NaOV, or 250 μM NaOV + 1 μM erlotinib for the 2 hour duration of the assay.
Flow cytometry
Cell surface PE-conjugated mouse Prom1 antibody
(Miltenyi Biotec, France, Clone MB9-3G8) and
anti-human EGFR antibody (Dako, Denmark, Clone H11) were used to analyze Prominin-1 and EGFRvIII surface expression, respectively. Incubation using EGFR was
followed by fluorescently tagged secondary incubation.
Data was acquired using a FACSCalibur or FACSCanto
flow cytometer (BD biosciences). For EdU incorporation
assay spheres were cultured for 2 days, incubated with
2 μM EdU for 2 hours, and labeled using Click-IT EdU
Assay kit (Thermo Fisher). Cells were analyzed using a
FACSCalibur flow cytometer (BD biosciences). Data was
analyzed using FlowJo 10 (Tree star, San Carlos, CA).
RNA isolation, cDNA synthesis and RT-PCR
Cells isolated from mouse brains or dissociated tumorspheres from culture were prepared as a single cell suspension and re-suspended in an appropriate
volume of RLT buffer from RNeasy mini kit (Qiagen,
Germany). RNA was isolated as per the manufacturers
instructions and quantified using a Nanodrop (Nanodrop
Technologies Inc., Wilmington, DE) Spectrophotometer. Complementary DNA was synthesized using Oligo(dT)
primers and Superscript III (18080-051, Thermo Fisher
Scientific). Primers were synthesized by IDT (IDT
Inc, Coralville, IA). The following primers were used: Id1 (Forward (Fw): CCTAGCTGTTCGCTGAAGGC, Reverse (Rv): GTAGAGCAGGACGTTCACCT), Prom1 (Fw: GACCAGGACTCGGATCAAAGG, Rv: TGTACTGCTCCACTACATAGTCA), Nes (Fw: AGAGTCAGATCGCTCAGATCC, Rv: GCAGAGT CCTGTATGTAGCCAC), Sox2 (Fw: GCGGAGT GGAAACTTTTGTCC, Rv: GGGAAGCGTGTACTT ATCCTTCT), Olig2 (Fw: TCCCCAGAACCCGA TGATCTT, Rv: CGTGGACGAGGACACAGTC), Dlx2 (Fw: CTACGGCACCAGTTCGTCTC, Rv: CCGTTCACT
ATTCGGATTTCAGG), Tubb3 (Fw: TAGACCCC
AGCGGCAACTAT, Rv: GTTCCAGGTTCCAAGTC CACC), Ascl1 (Fw: GCAACCGGGTCAAGTTGGT, Rv: CAAGTCGTTGGAGTAGTTGGG). Real Time PCR was performed on a 7900 HT Fast Real-Time PCR System
(Thermo Fisher Scientific) using FastStart Universal SYBR Green Master (Rox) (049138500011, Roche,
Switzerland). Ct values were normalized to GAPDH Ct values for each individual sample and then averaged across experiments.
Microarray profiling and analysis
Expression profiling was conducted by the
Gladstone Institute Genomics Core Facility using Affymetrix Mouse Gene 1.0 ST Array (901169).
Raw expression data was RMA normalized and Log2
transformed using Affymetrix Expression Console Software. The microarray data have been deposited
in the GEO database (accession number GSE87332)
and described in accordance with MAIME guidelines. Multiple Experiment Viewer Software (MeV; http://www.
tm4.org/mev/) was used to perform Significance Analysis
of Microarray (SAM) to determine differentially expressed genes between the two tumor types. A 1% false discovery rate and 2-fold expression difference was applied. The subsequent list of differentially expressed genes were analyzed for enriched Kegg Pathways using the Database for Annotation, Visualization and Integrated Discovery (DAVID).
Ethical statement
All animal work was approved by the UCSF institutional care and use committee (IACUC), approval
number AN105263.
Statistics
in the Kaplan-Meier survival analysis. Chi-squared test was used to compare the frequency of invasive phenotypes in Figure 1C.
ACKNOWLEDGMENTS
We thank Zena Werb and Claudia Petritsch for their
helpful advice and scientific discussions and the UCSF
Brain Tumor Center Tissue Bank for tissue processing and immunohistochemistry.
CONFLICTS OF INTEREST
The authors indicate no conflicts of interest
GRANT SUPPORT
National Institute of Health (R01 NS081117, J.J.P; UCSF Brain Tumor SPORE Tissue Core P50 CA097257), a Research Scholar Grant from the American Cancer Society (RSG-12-141-01-CSM, A.J.E.), American Brain Tumor Basic Research Fellowship in Honor of Joel A. Gingras, Jr. (J.R.E.), and The Swedish Childhood Cancer
Foundation (Barncancerfonden, TJ2014-0051 O.R.L).
REFERENCES
1. Burger PC, Green SB. Patient age, histologic features, and length of survival in patients with glioblastoma multiforme. Cancer. 1987; 59:1617-25. doi:
2. Patel AP, Tirosh I, Trombetta JJ, Shalek AK, Gillespie SM, Wakimoto H, Cahill DP, Nahed BV, Curry WT, Martuza RL, Louis DN, Rozenblatt-Rosen O, Suva ML, et al. Single-cell RNA-seq highlights intratumoral heterogeneity in primary glioblastoma. Science. 2014; 344:1396-401. doi: 10.1126/science.1254257.
3. Gill BJ, Pisapia DJ, Malone HR, Goldstein H, Lei L, Sonabend A, Yun J, Samanamud J, Sims JS, Banu M, Dovas A, Teich AF, Sheth SA, et al. MRI-localized biopsies reveal subtype-specific differences in molecular and cellular composition at the margins of glioblastoma. Proc Natl Acad Sci U S A. 2014; 111:12550-5. doi: 10.1073/ pnas.1405839111.
4. Kim J, Lee IH, Cho HJ, Park CK, Jung YS, Kim Y, Nam SH, Kim BS, Johnson MD, Kong DS, Seol HJ, Lee JI, Joo KM, et al. Spatiotemporal Evolution of the Primary Glioblastoma Genome. Cancer Cell. 2015; 28:318-28. doi: 10.1016/j.ccell.2015.07.013.
5. Noushmehr H, Weisenberger DJ, Diefes K, Phillips HS, Pujara K, Berman BP, Pan F, Pelloski CE, Sulman EP, Bhat KP, Verhaak RG, Hoadley KA, Hayes DN, et al. Identification of a CpG island methylator phenotype that defines a distinct subgroup of glioma. Cancer Cell. 2010; 17:510-22. doi: 10.1016/j.ccr.2010.03.017.
6. Verhaak RG, Hoadley KA, Purdom E, Wang V, Qi Y, Wilkerson MD, Miller CR, Ding L, Golub T, Mesirov JP, Alexe G, Lawrence M, O'Kelly M, et al. Integrated genomic analysis identifies clinically relevant subtypes of glioblastoma characterized by abnormalities in PDGFRA, IDH1, EGFR, and NF1. Cancer Cell. 2010; 17:98-110. doi: 10.1016/j.ccr.2009.12.020.
7. Scherer HJ. A Critical Review: The Pathology of Cerebral Gliomas. J Neurol Psychiatry. 1940; 3:147-77. doi: 8. Stommel JM, Kimmelman AC, Ying H, Nabioullin R,
Ponugoti AH, Wiedemeyer R, Stegh AH, Bradner JE, Ligon KL, Brennan C, Chin L, DePinho RA. Coactivation of receptor tyrosine kinases affects the response of tumor cells to targeted therapies. Science. 2007; 318:287-90. doi: 10.1126/science.1142946.
9. Phillips HS, Kharbanda S, Chen R, Forrest WF, Soriano RH, Wu TD, Misra A, Nigro JM, Colman H, Soroceanu L, Williams PM, Modrusan Z, Feuerstein BG, et al. Molecular subclasses of high-grade glioma predict prognosis, delineate a pattern of disease progression, and resemble stages in neurogenesis. Cancer Cell. 2006; 9:157-73. doi: 10.1016/j. ccr.2006.02.019.
10. Sottoriva A, Spiteri I, Piccirillo SG, Touloumis A, Collins VP, Marioni JC, Curtis C, Watts C, Tavare S. Intratumor heterogeneity in human glioblastoma reflects cancer evolutionary dynamics. Proc Natl Acad Sci U S A. 2013; 110:4009-14. doi: 10.1073/pnas.1219747110.
11. Cancer Genome Atlas Research N. Comprehensive genomic characterization defines human glioblastoma genes and core pathways. Nature. 2008; 455:1061-8. doi: 10.1038/ nature07385.
12. Furnari FB, Cloughesy TF, Cavenee WK, Mischel PS. Heterogeneity of epidermal growth factor receptor signalling networks in glioblastoma. Nat Rev Cancer. 2015; 15:302-10. doi: 10.1038/nrc3918.
13. Hermanson M, Funa K, Hartman M, Claesson-Welsh L, Heldin CH, Westermark B, Nister M. Platelet-derived growth factor and its receptors in human glioma tissue: expression of messenger RNA and protein suggests the presence of autocrine and paracrine loops. Cancer Res. 1992; 52:3213-9. doi:
14. Ozawa T, Brennan CW, Wang L, Squatrito M, Sasayama T, Nakada M, Huse JT, Pedraza A, Utsuki S, Yasui Y, Tandon A, Fomchenko EI, Oka H, et al. PDGFRA gene rearrangements are frequent genetic events in PDGFRA-amplified glioblastomas. Genes Dev. 2010; 24:2205-18. doi: 10.1101/gad.1972310.
16. Ekstrand AJ, Sugawa N, James CD, Collins VP. Amplified and rearranged epidermal growth factor receptor genes in human glioblastomas reveal deletions of sequences encoding portions of the N- and/or C-terminal tails. Proc Natl Acad Sci U S A. 1992; 89:4309-13. doi:
17. Frederick L, Wang XY, Eley G, James CD. Diversity and frequency of epidermal growth factor receptor mutations in human glioblastomas. Cancer Res. 2000; 60:1383-7. doi: 18. Aldape KD, Ballman K, Furth A, Buckner JC, Giannini
C, Burger PC, Scheithauer BW, Jenkins RB, James CD. Immunohistochemical detection of EGFRvIII in high malignancy grade astrocytomas and evaluation of prognostic significance. J Neuropathol Exp Neurol. 2004; 63:700-7. doi:
19. Heimberger AB, Suki D, Yang D, Shi W, Aldape K. The natural history of EGFR and EGFRvIII in glioblastoma patients. J Transl Med. 2005; 3:38. doi: 10.1186/1479-5876-3-38.
20. Wong AJ, Ruppert JM, Bigner SH, Grzeschik CH, Humphrey PA, Bigner DS, Vogelstein B. Structural alterations of the epidermal growth factor receptor gene in human gliomas. Proc Natl Acad Sci U S A. 1992; 89:2965-9. doi:
21. Noordhuis MG, Eijsink JJ, Ten Hoor KA, Roossink F, Hollema H, Arts HJ, Pras E, Maduro JH, Reyners AK, de Bock GH, Wisman GB, Schuuring E, van der Zee AG. Expression of epidermal growth factor receptor (EGFR) and activated EGFR predict poor response to (chemo)radiation and survival in cervical cancer. Clin Cancer Res. 2009; 15:7389-97. doi: 10.1158/1078-0432.CCR-09-1149. 22. Sonnweber B, Dlaska M, Skvortsov S, Dirnhofer S, Schmid
T, Hilbe W. High predictive value of epidermal growth factor receptor phosphorylation but not of EGFRvIII mutation in resected stage I non-small cell lung cancer (NSCLC). J Clin Pathol. 2006; 59:255-9. doi: 10.1136/ jcp.2005.027615.
23. Nieto Y, Nawaz F, Jones RB, Shpall EJ, Nawaz S. Prognostic significance of overexpression and phosphorylation of epidermal growth factor receptor (EGFR) and the presence of truncated EGFRvIII in locoregionally advanced breast cancer. J Clin Oncol. 2007; 25:4405-13. doi: 10.1200/ JCO.2006.09.8822.
24. Faulkner C, Palmer A, Williams H, Wragg C, Haynes HR, White P, DeSouza RM, Williams M, Hopkins K, Kurian KM. EGFR and EGFRvIII analysis in glioblastoma as therapeutic biomarkers. Br J Neurosurg. 2014:1-7. doi: 10.3109/02688697.2014.950631.
25. Pelloski CE, Ballman KV, Furth AF, Zhang L, Lin E, Sulman EP, Bhat K, McDonald JM, Yung WK, Colman H, Woo SY, Heimberger AB, Suki D, et al. Epidermal growth factor receptor variant III status defines clinically distinct subtypes of glioblastoma. J Clin Oncol. 2007; 25:2288-94. doi: 10.1200/JCO.2006.08.0705.
26. Montano N, Cenci T, Martini M, D'Alessandris QG, Pelacchi F, Ricci-Vitiani L, Maira G, De Maria R, Larocca LM, Pallini R. Expression of EGFRvIII in glioblastoma: prognostic significance revisited. Neoplasia. 2011; 13:1113-21. doi:
27. Heimberger AB, Hlatky R, Suki D, Yang D, Weinberg J, Gilbert M, Sawaya R, Aldape K. Prognostic effect of epidermal growth factor receptor and EGFRvIII in glioblastoma multiforme patients. Clin Cancer Res. 2005; 11:1462-6. doi: 10.1158/1078-0432.CCR-04-1737. 28. Pastrana E, Cheng LC, Doetsch F. Simultaneous prospective
purification of adult subventricular zone neural stem cells and their progeny. Proc Natl Acad Sci U S A. 2009; 106:6387-92. doi: 10.1073/pnas.0810407106.
29. Lindberg OR, Brederlau A, Jansson A, Nannmark U, Cooper-Kuhn C, Kuhn HG. Characterization of epidermal growth factor-induced dysplasia in the adult rat subventricular zone. Stem Cells Dev. 2012; 21:1356-66. doi: 10.1089/scd.2011.0275.
30. Lindberg OR, Brederlau A, Kuhn HG. Epidermal growth factor treatment of the adult brain subventricular zone leads to focal microglia/macrophage accumulation and angiogenesis. Stem Cell Reports. 2014; 2:440-8. doi: 10.1016/j.stemcr.2014.02.003.
31. Doetsch F, Petreanu L, Caille I, Garcia-Verdugo JM, Alvarez-Buylla A. EGF converts transit-amplifying neurogenic precursors in the adult brain into multipotent stem cells. Neuron. 2002; 36:1021-34. doi:
32. Gonzalez-Perez O, Romero-Rodriguez R, Soriano-Navarro M, Garcia-Verdugo JM, Alvarez-Buylla A. Epidermal growth factor induces the progeny of subventricular zone type B cells to migrate and differentiate into oligodendrocytes. Stem Cells. 2009; 27:2032-43. doi: 10.1002/stem.119.
33. Nishikawa R, Ji XD, Harmon RC, Lazar CS, Gill GN, Cavenee WK, Huang HJ. A mutant epidermal growth factor receptor common in human glioma confers enhanced tumorigenicity. Proc Natl Acad Sci U S A. 1994; 91:7727-31. doi:
34. Nagane M, Levitzki A, Gazit A, Cavenee WK, Huang HJ. Drug resistance of human glioblastoma cells conferred by a tumor-specific mutant epidermal growth factor receptor through modulation of Bcl-XL and caspase-3-like proteases. Proc Natl Acad Sci U S A. 1998; 95:5724-9. doi:
35. Liu F, Hon GC, Villa GR, Turner KM, Ikegami S, Yang H, Ye Z, Li B, Kuan S, Lee AY, Zanca C, Wei B, Lucey G, et al. EGFR Mutation Promotes Glioblastoma through Epigenome and Transcription Factor Network Remodeling. Mol Cell. 2015; 60:307-18. doi: 10.1016/j. molcel.2015.09.002.
and growth in human and mouse malignant glioma. J Clin Invest. 2012; 122:911-22. doi: 10.1172/JCI58215.
37. Bachoo RM, Maher EA, Ligon KL, Sharpless NE, Chan SS, You MJ, Tang Y, DeFrances J, Stover E, Weissleder R, Rowitch DH, Louis DN, DePinho RA. Epidermal growth factor receptor and Ink4a/Arf: convergent mechanisms governing terminal differentiation and transformation along the neural stem cell to astrocyte axis. Cancer Cell. 2002; 1:269-77. doi:
38. Li L, Dutra A, Pak E, Labrie JE, 3rd, Gerstein RM, Pandolfi PP, Recht LD, Ross AH. EGFRvIII expression and PTEN loss synergistically induce chromosomal instability and glial tumors. Neuro Oncol. 2009; 11:9-21. doi: 10.1215/15228517-2008-081.
39. Fan QW, Cheng CK, Gustafson WC, Charron E, Zipper P, Wong RA, Chen J, Lau J, Knobbe-Thomsen C, Weller M, Jura N, Reifenberger G, Shokat KM, et al. EGFR phosphorylates tumor-derived EGFRvIII driving STAT3/5 and progression in glioblastoma. Cancer Cell. 2013; 24:438-49. doi: 10.1016/j.ccr.2013.09.004.
40. Hughes CS, Postovit LM, Lajoie GA. Matrigel: a complex protein mixture required for optimal growth of cell culture. Proteomics. 2010; 10:1886-90. doi: 10.1002/ pmic.200900758.
41. Kleinman HK, McGarvey ML, Liotta LA, Robey PG, Tryggvason K, Martin GR. Isolation and characterization of type IV procollagen, laminin, and heparan sulfate proteoglycan from the EHS sarcoma. Biochemistry. 1982; 21:6188-93. doi:
42. Andor N, Graham TA, Jansen M, Xia LC, Aktipis CA, Petritsch C, Ji HP, Maley CC. Pan-cancer analysis of the extent and consequences of intratumor heterogeneity. Nat Med. 2015. doi: 10.1038/nm.3984.
43. Gutmann DH, Baker SJ, Giovannini M, Garbow J, Weiss W. Mouse models of human cancer consortium symposium on nervous system tumors. Cancer Res. 2003; 63:3001-4. doi: 44. Hover LD, Owens P, Munden AL, Wang J, Chambless
LB, Hopkins CR, Hong CC, Moses HL, Abel TW. Bone morphogenetic protein signaling promotes tumorigenesis in a murine model of high-grade glioma. Neuro Oncol. 2015. doi: 10.1093/neuonc/nov310.
45. Stoltz K, Sinyuk M, Hale JS, Wu Q, Otvos B, Walker K, Vasanji A, Rich JN, Hjelmeland AB, Lathia JD. Development of a Sox2 reporter system modeling cellular heterogeneity in glioma. Neuro Oncol. 2015; 17:361-71. doi: 10.1093/neuonc/nou320.
46. Puliyappadamba VT, Chakraborty S, Chauncey SS, Li L, Hatanpaa KJ, Mickey B, Noorani S, Shu HK, Burma S, Boothman DA, Habib AA. Opposing effect of EGFRWT on EGFRvIII-mediated NF-kappaB activation with RIP1 as a cell death switch. Cell Rep. 2013; 4:764-75. doi: 10.1016/j. celrep.2013.07.025.
47. Chakraborty S, Li L, Puliyappadamba VT, Guo G, Hatanpaa KJ, Mickey B, Souza RF, Vo P, Herz J, Chen MR,
Boothman DA, Pandita TK, Wang DH, et al. Constitutive and ligand-induced EGFR signalling triggers distinct and mutually exclusive downstream signalling networks. Nat Commun. 2014; 5:5811. doi: 10.1038/ncomms6811. 48. de Groot JF, Fuller G, Kumar AJ, Piao Y, Eterovic K, Ji Y,
Conrad CA. Tumor invasion after treatment of glioblastoma with bevacizumab: radiographic and pathologic correlation in humans and mice. Neuro Oncol. 2010; 12:233-42. doi: 10.1093/neuonc/nop027.
49. Lu KV, Chang JP, Parachoniak CA, Pandika MM, Aghi MK, Meyronet D, Isachenko N, Fouse SD, Phillips JJ, Cheresh DA, Park M, Bergers G. VEGF inhibits tumor cell invasion and mesenchymal transition through a MET/ VEGFR2 complex. Cancer Cell. 2012; 22:21-35. doi: 10.1016/j.ccr.2012.05.037.
50. Serres E, Debarbieux F, Stanchi F, Maggiorella L, Grall D, Turchi L, Burel-Vandenbos F, Figarella-Branger D, Virolle T, Rougon G, Van Obberghen-Schilling E. Fibronectin expression in glioblastomas promotes cell cohesion, collective invasion of basement membrane in vitro and orthotopic tumor growth in mice. Oncogene. 2014; 33:3451-62. doi: 10.1038/onc.2013.305.
51. Du R, Lu KV, Petritsch C, Liu P, Ganss R, Passegue E, Song H, Vandenberg S, Johnson RS, Werb Z, Bergers G. HIF1alpha induces the recruitment of bone marrow-derived vascular modulatory cells to regulate tumor angiogenesis and invasion. Cancer Cell. 2008; 13:206-20. doi: 10.1016/j. ccr.2008.01.034.
52. Boockvar JA, Kapitonov D, Kapoor G, Schouten J, Counelis GJ, Bogler O, Snyder EY, McIntosh TK, O'Rourke DM. Constitutive EGFR signaling confers a motile phenotype to neural stem cells. Mol Cell Neurosci. 2003; 24:1116-30. doi:
53. Emlet DR, Gupta P, Holgado-Madruga M, Del Vecchio CA, Mitra SS, Han SY, Li G, Jensen KC, Vogel H, Xu LW, Skirboll SS, Wong AJ. Targeting a glioblastoma cancer stem-cell population defined by EGF receptor variant III. Cancer Res. 2014; 74:1238-49. doi: 10.1158/0008-5472. CAN-13-1407.
54. Inda MM, Bonavia R, Mukasa A, Narita Y, Sah DW, Vandenberg S, Brennan C, Johns TG, Bachoo R, Hadwiger P, Tan P, Depinho RA, Cavenee W, et al. Tumor heterogeneity is an active process maintained by a mutant EGFR-induced cytokine circuit in glioblastoma. Genes Dev. 2010; 24:1731-45. doi: 10.1101/gad.1890510.
55. Nishikawa R, Sugiyama T, Narita Y, Furnari F, Cavenee WK, Matsutani M. Immunohistochemical analysis of the mutant epidermal growth factor, deltaEGFR, in glioblastoma. Brain Tumor Pathol. 2004; 21:53-6. doi: 56. Nathanson DA, Gini B, Mottahedeh J, Visnyei K, Koga T,
57. Avraham R, Yarden Y. Feedback regulation of EGFR signalling: decision making by early and delayed loops. Nat Rev Mol Cell Biol. 2011; 12:104-17. doi: 10.1038/ nrm3048.
58. Stockhausen MT, Kristoffersen K, Stobbe L, Poulsen HS. Differentiation of glioblastoma multiforme stem-like cells leads to downregulation of EGFR and EGFRvIII and decreased tumorigenic and stem-like cell potential. Cancer Biol Ther. 2014; 15:216-24. doi: 10.4161/cbt.26736.
59. Ligon KL, Huillard E, Mehta S, Kesari S, Liu H, Alberta JA, Bachoo RM, Kane M, Louis DN, Depinho RA, Anderson DJ, Stiles CD, Rowitch DH. Olig2-regulated lineage-restricted pathway controls replication competence in neural stem cells and malignant glioma. Neuron. 2007; 53:503-17. doi: 10.1016/j.neuron.2007.01.009.