Pushover Analysis on RCC Structure for Zone IV
and Zone V
Mohd Azaz1, Syed Sohailuddin2, Aquib Ansari3, Mohd Atif4, Mohd Ameenuddin5
1, 2, 3, 4, 5
Anjuman College of engineering & technology, Nagpur Maharashtra, India
Abstract: this paper emphasizes on pushover analysis on reinforced concrete structure. In which G+10 building was subjected to push in x and push in y direction. Analysis was done in sap2000 15. Based on the performance point obtain from the examination we get to know that the structure will do well or not during seismic activities. If the performance points obtain from the examination are within collapse able range the structure will perform well. The Graph of pushover curve has been plot in terms of base shear - roof displacement .The slope of pushover curve gradually changes with increase of the lateral displacement of the building. This is due to the progressive development of plastic hinges in beams and columns throughout the structure.
Keywords: pushover, sap2000 15, reinforced concrete, lateral displacement & plastic hinges.
I. INTRODUCTIONTOPUSHOVER
The term earthquake can be used to explain any kind seismic event which may be either natural or initiate by humans, which generates seismic waves. Earthquake generally occurs by split of geological faults but they can also occur due some natural as well as un natural behavior like volcanic activity, mine blasts, landslides and nuclear tests. A sudden discharge of energy in the earth’s crust creates seismic wave which in the end results into earthquake. Pushover analysis is an fairly accurate method in which the structure is subjected to endlessly growing lateral forces with invariant height wise distribution until the target displacement is reached. Pushover analysis consists of chain of sequential elastic analysis, superimposed to approximate a force-displacement curve of the overall structure. Two or three dimensional model which includes bilinear or tri-linear load-deformation figure of all lateral force resisting elements is first created and gravity loads are applied primarily. An already recognized lateral load pattern which is distributed along the building height is then applied. The lateral forces are augmented until some members of the structure yields. Then changes are made in the structural model to lessen the stiffness of yielded members and lateral forces are again augmented until some other members yield. The process is carry on until a control displacement at the top of building reach a certain level of deformation or structure become unstable. The roof displacement is plot with base shear to obtain the global capacity curve.
Pushover analysis can be performed as force-controlled. In force-controlled pushover practice, full load combination is applied. Also, in force-controlled pushover method some numerical problems that affects the accuracy of the results which occur since target displacement may be associated with minute positive or negative lateral stiffness because of the development of mechanisms and p-delta effects.
Pushover analysis has been preferred method for seismic performance assessment of structure by the major rehabilitation guidelines and codes because it is conceptually and computationally easy. Pushover analysis permit tracing the series of yielding and breakdown on member and structural level as well as the growth of overall capacity curve of the structure.
II. PUSHOVERANALYSISOFSTRUCTURE
procedure named Modal Pushover Analysis (MPA) on case study frames. Pushover results are judge against with the 'exact' values of response parameters obtained from the experimental outcome to evaluate the accurateness of software.
III. PERFORMANCEBASEDDESIGNFORNONLINEARSTATICPUSHOVERANALYSIS
Create a model on the software of G+10 building. Assign different properties to material and fix the acceptance criteria for pushover hinges. The program consists of several default hinge properties that are based on ATC-40 for concrete members and FEMA-365 for steel members. Locate the pushover hinges by selecting numbers of frame and assign them one or more hinge properties. Then define the pushover load cases.
IV. RESULTS
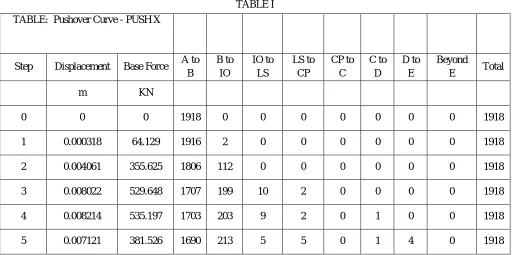
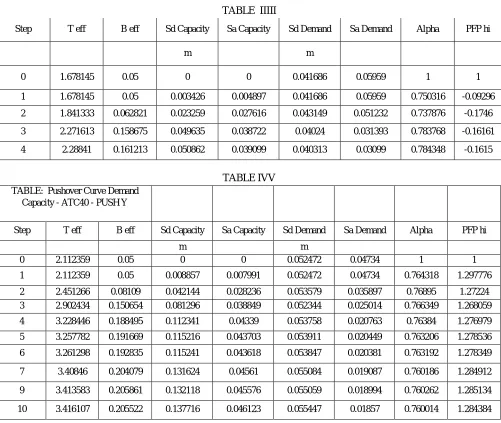
The figure 1 and figure 2 shows the hinges formation in the structure when subjected to pushover analysis in x and y direction in zone IV. Table 1 and 2 displacement – base force data in x and y direction. Table 3 and 4 shows demand capacity data for push in x and y direction for zone IV.
Fig1: Hinge formation diagram zone IV- PUSH X Fig2: Hinge formation diagram zone IV –PUSH Y
[image:3.612.51.563.469.724.2]TABLE I TABLE: Pushover Curve - PUSH X
Step Displacement Base Force A to B B to IO IO to LS LS to CP CP to C C to D D to E Beyond E Total
m KN
0 0 0 1918 0 0 0 0 0 0 0 1918
1 0.000318 64.129 1916 2 0 0 0 0 0 0 1918
2 0.004061 355.625 1806 112 0 0 0 0 0 0 1918
3 0.008022 529.648 1707 199 10 2 0 0 0 0 1918
4 0.008214 535.197 1703 203 9 2 0 1 0 0 1918
TABLE III
TABLE IIIII
Step T eff B eff Sd Capacity Sa Capacity Sd Demand Sa Demand Alpha PFP hi
m m
0 1.678145 0.05 0 0 0.041686 0.05959 1 1
1 1.678145 0.05 0.003426 0.004897 0.041686 0.05959 0.750316 -0.09296
2 1.841333 0.062821 0.023259 0.027616 0.043149 0.051232 0.737876 -0.1746
3 2.271613 0.158675 0.049635 0.038722 0.04024 0.031393 0.783768 -0.16161
4 2.28841 0.161213 0.050862 0.039099 0.040313 0.03099 0.784348 -0.1615
[image:4.612.54.566.75.777.2] [image:4.612.57.558.300.723.2]TABLE IVV TABLE: Pushover Curve Demand
Capacity - ATC40 - PUSH Y
Step T eff B eff Sd Capacity Sa Capacity Sd Demand Sa Demand Alpha PFP hi
m m
0 2.112359 0.05 0 0 0.052472 0.04734 1 1
1 2.112359 0.05 0.008857 0.007991 0.052472 0.04734 0.764318 1.297776
2 2.451266 0.08109 0.042144 0.028236 0.053579 0.035897 0.76895 1.27224
3 2.902434 0.150654 0.081296 0.038849 0.052344 0.025014 0.766349 1.268059
4 3.228446 0.188495 0.112341 0.04339 0.053758 0.020763 0.76384 1.276979
5 3.257782 0.191669 0.115216 0.043703 0.053911 0.020449 0.763206 1.278536
6 3.261298 0.192835 0.115241 0.043618 0.053847 0.020381 0.763192 1.278349
7 3.40846 0.204079 0.131624 0.04561 0.055084 0.019087 0.760186 1.284912
9 3.413583 0.205861 0.132118 0.045576 0.055059 0.018994 0.760262 1.285134
10 3.416107 0.205522 0.137716 0.046123 0.055447 0.01857 0.760014 1.284384
TABLE: Pushover Curve - PUSH Y
Step Displacement Base Force A to
B B to IO IO to LS LS to CP CP to C C to D D to
E Beyond E Total
m KN
0 0.000076 0 1918 0 0 0 0 0 0 0 1918
1 0.011419 106.589 1915 3 0 0 0 0 0 0 1918
2 0.053542 378.91 1755 163 0 0 0 0 0 0 1918
3 0.143381 598.405 1515 388 15 0 0 0 0 0 1918
4 0.147243 620.952 1510 391 17 0 0 0 0 0 1918
5 0.169614 704.505 1476 412 25 4 0 0 1 0 1918
Fig3:- Hinge formation diagram zone V –PUSH X Fig4:- Hinge formation diagram zone V –PUSH Y
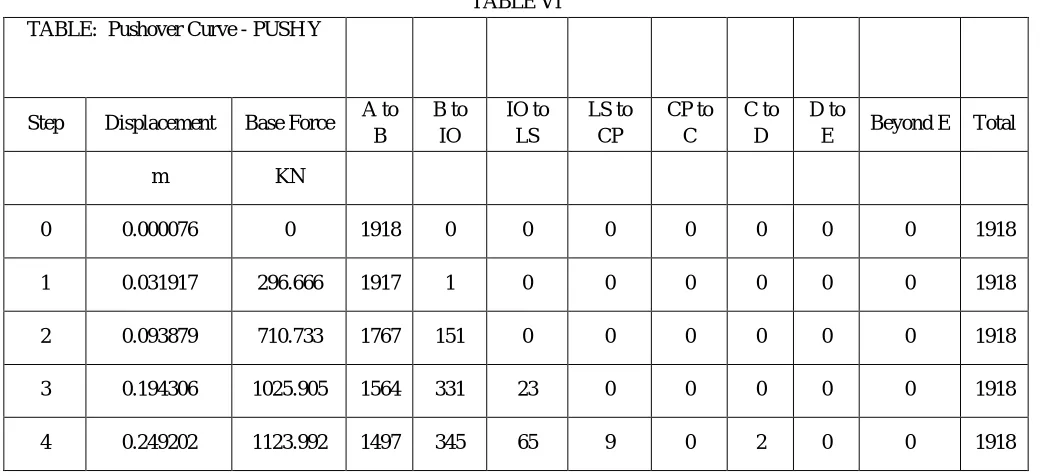
The figure 3 and figure 4 shows the hinges formation in the structure when subjected to pushover analysis in x and y direction in zone V. Table 5 and 6 displacement – base force data in x and y direction. Table 7 and 8 shows demand capacity data for push in x and y direction for zone V.
TABLE V -TABLE: Pushover Curve - PUSH X
Step Displacement Base Force A to B
B to IO
IO to LS
LS to CP
CP to C
C to D
D to E
Beyond
E Total
m KN
0 0 0 1918 0 0 0 0 0 0 0 1918
1 0.001246 250.956 1916 2 0 0 0 0 0 0 1918
2 0.00297 500.285 1882 36 0 0 0 0 0 0 1918
3 0.010204 962.771 1764 147 7 0 0 0 0 0 1918
4 0.010594 1005.77 1750 158 4 5 0 1 0 0 1918
TABLE VI TABLE: Pushover Curve - PUSH Y
Step Displacement Base Force A to B B to IO IO to LS LS to CP CP to C C to D D to
E Beyond E Total
m KN
0 0.000076 0 1918 0 0 0 0 0 0 0 1918
1 0.031917 296.666 1917 1 0 0 0 0 0 0 1918
2 0.093879 710.733 1767 151 0 0 0 0 0 0 1918
3 0.194306 1025.905 1564 331 23 0 0 0 0 0 1918
4 0.249202 1123.992 1497 345 65 9 0 2 0 0 1918
TABLE VII TABLE: Pushover Curve Demand
Capacity - ATC40 - PUSH X
Step T eff B eff Sd Capacity Sa Capacity Sd Demand Sa Demand Alpha PFP hi
m m
0 1.678145 0.05 0 0 0.041686 0.05959 1 1
1 1.678145 0.05 0.013407 0.019165 0.041686 0.05959 0.750316 -0.09296
2 1.703442 0.056176 0.02814 0.03904 0.041093 0.05701 0.734282 -0.10555
3 1.945942 0.104884 0.068437 0.072757 0.039444 0.041933 0.758245 -0.1491
4 1.996169 0.11904 0.074625 0.075392 0.038902 0.039302 0.764416 -0.14197
TABLE VIII TABLE: Pushover Curve Demand
Capacity - ATC40 - PUSH Y
Step T eff B eff Sd Capacity Sa Capacity Sd Demand Sa Demand Alpha PFP hi
m m
0 2.112359 0.05 0 0 0.052472 0.04734 1 1
1 2.112359 0.05 0.024652 0.022241 0.052472 0.04734 0.764318 1.297776
2 2.362894 0.085939 0.073562 0.05304 0.050801 0.036629 0.767827 1.277222
3 2.835519 0.151611 0.153875 0.077045 0.051026 0.025549 0.762999 1.263242
V. RESULTS FOR PUSHOVER CURVES AND DEMAND CAPACITY CURVES FOR ZONE IV AND ZONE IV
The graphs of displacement versus base shear are plotted for push in x and y direction for zone IV and V.
Chart 1:- pushover curve zone IV- Push-X
Chart 2:- pushover curve zone IV- Push-Y
Chart 4:- pushover curve zone V- Push-Y
The graphs of demand capacity versus spectrum capacity are plotted in for push in x and y direction for zone IV and zone V.
Chart 3: Demand capacity curve zone VI- Push-X
Chart 5: Demand capacity curve zone V- Push-X
Chart 6: Demand capacity curve zone V- Push-Y
VI. COMPARISONOFPUSHOVERCURVES
The comparison of pushover curves for Push X and Push Y are plotted for seismic zone IV and V.
Chart 7: Comparison of Pushover Curve V
VII.PERFORMANCE LEVEL OF STRUCTURE AND RANGE OF PLASTIC HINGES FORMATION IN THE
STRUCTURE
The performance of the building depends on many factors one of the major factor are the structural and non-structural elements. The structure is subjected to roof displacement and the performance of structure is shown below by plotting the force versus deformation. Five letters A, B, C, D and E are generally used to define force deflection behavior of the hinge and these point are given as
Chart 7: Load vs. Deformation
The performance level (IO, LS and CP) a structural element is represented in load versus deformation curve as shown below,
A. A to B -Elastic state, Point ‘A’ corresponds to the unloaded condition
B. Point ‘B’ corresponds to the onset of yielding. B to IO below immediate occupancy,
C. IO and LS – between immediate occupancies and life safety LS to CP-between life safety and collapse prevention
D. CP and C--- between collapse prevention and ultimate capacity Point C corresponds to ultimate capacity.
E. C and D- between ultimate capacity and residual strength Point D correspond to residual strength
F. D to E- between residual strength and collapse. Point E corresponds to collapse.
VIII. CONCLUSION
A. The pushover analysis is a useful tool for assessing the inelastic strength and deformation demands and for exposing design weakness. The pushover analysis is a relatively simple way to explore the non-linear behaviour of the structure
changed with increase of the lateral displacement of the building. This is due to the progressive formation of plastic hinges in beams and columns throughout the structure.
C. It is observed that the structural elements of the three upper floors have not entered in the plastic zone in contrast to some structural elements in the lower floors.
D. From the results obtained in x-direction and y- direction there are nearly 5 to 6 elements exceeding the limit level between life safety (LS)and collapse prevention(CP), as shown in Table. This means that the building not requires retrofitting.
E. It was found that the seismic performance of studied building is adequate according in X-X direction and in Y-Y direction because all elements were not reached the Immediate Occupancy (IO) level.
F. The main output of a pushover analysis is in terms of response demand versus capacity. If the demand curve intersects the capacity envelope near the elastic range, then the structure has a good resistance. If the demand curve intersects the capacity curve with little reserve of strength and deformation capacity, then it can be concluded that the structure will behave poorly during the imposed seismic excitation and need to be retrofitted to avoid future major damage or collapse.
REFERENCES
[1] Agarwal A. (2012): Seismic Evaluation of Institute Building, Bachelor of Technology Thesis, National Institute of Technology Rourkela. [2] Agarwal P., Shrikhande M. (2004): Earthquake Resistant Design of Structures, PHI Publication.
[3] Bodige N., Ramancharla P. K. (2012): Pushover Analysis of RC Bare Frame: Performance Comparison between Ductile and Non-ductile Detailing, Report No: IIIT/TR/2012/-1, Urban Safety of Mega Cities in Asia (USMCA)
[4] Faella C., Martinelli E., Nigro E. (2002): Steel and concrete composite beams with flexible shear connection: “exact” analytical expression of the stiffness matrix and applications, Computers & Structures - COMPUT STRUCT, vol. 80, no. 11, pp. 1001-1009, 2002
[5] Fardis M. N. (2009): Seismic Design, Assessment and Retrofitting of Concrete Buildings, Springer Publication.
[6] Griffith M. C., Pinto A. V. (2000):“Seismic Retrofit of RC Buildings - A Review and Case Study”, University of Adelaide, Adelaide, Australia and European Commission, Joint Research Centre, Ispra Italy.
[7] Goel R. K. (2008): Evaluation of Current Nonlinear Static Procedures for Reinforced Concrete Buildings, The 14th World Conference on Earthquake Engineering October 12-17, 2008, Beijing, China.
[8] Kadid A., Boumrkik A. (2008): Pushover Analysis of Reinforced Concrete Frame Structures, Asian Journal of Civil Engineering (Building and Housing) Vol. 9, No. 1(2008) Pages 75-83
[9] Krawinkler H., Seneviratna G.D.P.K. (1998): Pros and Cons of a Pushover Analysis of Seismic Performance Evaluation, Engineering Structures, Vol.20, 452-464.
[10] Lawson R.S., Reinhorn A.M., Lobo R.F. (1994): Nonlinear Static Pushover Analysis -Why, When and How? Proceedings of the 5th US National Conference on Earthquake Engineering Chicago, Vol. 1, 283-292.
[11] Monavari B., Massumi A., Kazem, A (2012): Estimation of Displacement Demand in RC Frames and Comparing with Target Displacement Provided by FEMA-356, 15th World Conference on Earthquake Engineering, 24th to 28th September, 2012, Lisbon, Portugal.
[12] [12] Mouzzoun M., Moustachi O., Taleb A. (2013): Seismic Damage Prediction of Reinforced Concrete Buildings Using Pushover Analysis, International Journal of Computational Engineering Research (ijceronline.com) Vol. 3 Issue. 1, January 2013.
[13] Mouzzoun M., Moustachi O., Taleb A., Jalal S. (2013): Seismic performance assessment of reinforced concrete buildings using pushover analysis, IOSR Journal of Mechanical and Civil Engineering (IOSR-JMCE); ISSN: 2278-1684 Volume 5, Issue 1 (Jan. - Feb.2013), PP 44-49.
[14] Mwafy A. M., Elnashai A. S. (2001): Static Pushover versus Dynamic Analysis of RC Buildings, Engineering Structures, Vol. 23, 407-424.
[15] Otani S. (2000): Seismic Vulnerability Assessment of Reinforced Concrete Buildings ,Faculty of Engineering, University of Tokyo, Series B, Vol., XLVII, October 2000, pp. 528.
[16] Pillai S. U., Menon D. (2009): Reinforced Concrete Design, TMH Publication.
[17] Poluraju P., NageswaraRao P. V. S. (2011): Pushover analysis of reinforced concrete frame structure using SAP 2000, International Journal of Earth Sciences and Engineering, ISSN 0974-5904, Volume 04, No 06 SPL, pp. 684-690.
[18] Rai, Durgesh C. (2005): “Seismic Evaluation and Strengthening of Existing Buildings”IIT Kanpur and Gujarat State Disaster Mitigation Authority.