Technology (IJRASET)
Performance Enhancement in Optimal Placement
and Sizing of Wind Based DG in Distribution
System Using Firefly Optimization Technique
Antrunt Jaffrin R1, Peyapprakash K2
1,2
PG Scholar, Electrical and Electronics Engineering, Regional Campus of Anna University, Coimbatore, Tamilnadu, India
Abstract-Proper placement of DG in distribution system is still very challenging issues for obtaining their maximum potential benefits. This paper suggest a multi objective fire fly algorithm based performance model of Wind Turbine Generation Unit placement suggest for power loss reduction and voltage stability improvement of radial distribution system. This paper reflects the effectiveness of WTGU model in DG placement problem formulation. Voltage Stability Factor has been used in this paper which can quantify the voltage stability levels of buses in the distribution system.
Keywords-Voltage stability factor, Distributed generation, firefly algorithm
I. INTRODUCTION
With growing load demand in the distribution network, it provisions of potential scope for research in terms of analyzing the distribution network to meet the demand with the present infrastructure. Shortage of distribution power carrying capabilities and increased interest in application of green technology can be use of Distributed Generation (DG) [1]. DG units are mainly energized by wind, solar and fuel cell. There are a more number of DG technologies available in the market today and a few are still at the research and development stage. In the available technologies, wind and solar based DG technologies are going to dominate the electricity market because of their free environment characteristics and abundant availability of resources.
Normally the structure of distribution system is radial because of their simplicity. Most of the radial distribution system suffers with high power losses because of high resistance and reactance ratios. The overall efficiency of the system can be improved by using DG units. It is very necessary to determine the optimal location for sitting of DGs. DG devices can be strategically placed in power systems for reinforcing grid, minimizing power losses and on-peak operating costs, improving voltage profiles and load factors and improving system integrity, reliability, and efficiency [2]. Installing DG units at non-optimal places may result in an increase in system losses, implying an increase in cost of system and therefore having an opposite effect to what is desired. Moreover, if multiple DG units are installed, optimal approach for placement of DGs [3] in order to maintain the stability and reliability of the system.
In case of placement of multiple DGs, the problem of optimal placement of DGs is already solved by optimization techniques such as Genetic Algorithm (GA) [4], Particle Swarm Optimization (PSO) technique [5] Artificial Bee Colony (ABC) optimization [6] and Ant Colony optimization [7]. In this paper, a new swarm intelligence approach that utilizes Firefly algorithm (FA) to determine the optimal DG unit’s size and location in order to minimize the total system power loss and voltage stability improvement is proposed. By using FA, the size and location of DG can be determined simultaneously.
II. PROBLEM FORMULATION
A. Formulation of voltage stability measurement
Technology (IJRASET)
2 1 2 1 2 1 2 m m m iV
Q
P
I
(1)Where
P
m1,Q
m1 andV
m1 are the active load, reactive load and bus voltage magnitude at bus ‘m
1
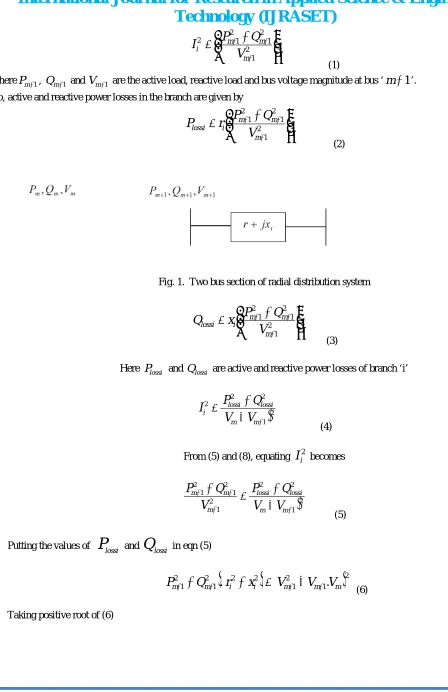
’. So, active and reactive power losses in the branch are given by [image:3.612.51.499.51.743.2]
2 1 2 1 2 1 m m m i lossiV
Q
P
r
P
(2)Fig. 1. Two bus section of radial distribution system
2 1 2 1 2 1 m m m i lossiV
Q
P
x
Q
(3)Here
P
lossi andQ
lossi are active and reactive power losses of branch ‘i’
21 2 2 2
m m lossi lossi iV
V
Q
P
I
(4)From (5) and (8), equating
I
i2 becomes
21 2 2 2 1 2 1 2 1
m m lossi lossi m m mV
V
Q
P
V
Q
P
(5)Putting the values of
P
lossi andQ
lossi in eqn (5)
21 2 1 2 2 2 1 2
1 m
.
i i m m.
mm
Q
r
x
V
V
V
P
(6)
Technology (IJRASET)
i m m m mZ
V
V
V
S
1.
2 1 1 (7) 1 m
S
is the magnitude of complex power at receiving end .For critical power flowing at receiving end.0
.
1 2 1 1 1
i m m m m mZ
V
V
V
dV
dS
(8)For stable operation of the system
2
0
0
11
1
m m m
m
ie
V
V
dV
dS
(9)
Voltage stability factor for any bus ‘m+1’ is designated as
m m
m
V
V
VSF
1
2
1
(10)At voltage collapse point VSF become zero and that will be occurred when magnitude receiving end bus voltage become half of magnitude of sending end bus voltage. The value of the VSF of buses nearer to zero, the system is more vulnerable.
Voltage stability condition of the whole distribution system can be proved summing the values of VSF of all the load buses. So,
1 1 12
k m m mtotal
V
V
VSF
(11)
‘k’ is the total number of buses in the system and
V
1 is the magnitude of substation voltage. The higher value ofVSF
total indicates more voltage stable operation.2) Performance modeling of wind based generation
Power generation of Wind Turbine Generation Unit (WTGU) depends on their model and resource such as wind speed [9]. In this section modeling of WTGU is discussed to understand wind based DG placement technique in better way.
1) Performance model of WTGU
Depending on the rotational speed WTGUs can be broadly classified into two types namely fixed speed WTGU and variable speed WTGU. Commonly variable speed WTGU is used in which real power output varies wind speed. For a typical WTGU, the output electrical power generation is given by
Technology (IJRASET)
p w rated
Av
C
P
0
.
5
3(13)
Where A is the swept area of rotor;
is the density of air;v
w is wind speed andC
pis the power co-efficient.III. FIREFLY OPTIMIZATION TECHNIQUE
Firefly Algorithm is a meta-heuristic algorithm inspired from behavior of fireflies’ swarm [10]. This algorithm is based on attractiveness and light intensity [11]. The firefly algorithm is made using the following assumptions:
Fireflies are affected by the attractiveness and brightness as they are unisex.
The attractiveness increases as the brightness of the firefly increases and it decreases as the distance from each other increases.
The firefly move in random when there is on brighter one
The brightness of the firefly depends on the shape of the objective function
These rules are used to get the optimal value of the objective function.
A. Firefly Algorithm
Objective function A(x),
x
(
x
1,...
x
d)
TGenerate initial population of fire flies
x
i,
i
1
,...
n
Light intensity
I
i atx
idetermined byA
x
iDefine light absorption coefficient
while (t<Max Generation)
for i=1; n all n fire flies
for j=1; i all n fire flies
if
I
j
I
i
More fire fly I towards j in d-dimension; end ifAttractiveness varies with distance
r
viaexp
r
Evaluate new solution and update light intensity end for jend for i
Rank the fire flies and find the current best end while
Post process results and visualization
Technology (IJRASET)
maximum number of iteration, total loss of the system (eqn. 14 ), total VSF of the system(eqn. 15)
n
i
i i
total
Ploss
Qloss
Sloss
1
2 2
(14)
1 11
2
k
m
m m
total
V
V
VSF
(15)
Step 2: Randomly place the DG unit in distribution system and calculate generation of real (eqn. 16) and reactive power (eqn. 17) of DG units using the below equations.
cos
*
*
,i i i DGI
DG
P
(16)
Q
DG,i
I
i*
DG
i*
1
cos
2
(17)Using newton raphson power flow solution calculates voltage magnitude of buses.
Step 3: Check the each bus voltage magnitude by below equation
|
V
i,bus|
1
.
05
p
.
u
(18)If above equation satisfied means compute and store the values of total loss (eqn) and total VSF (eqn). If above equation not satisfied, increase the iteration and increase the DG units until reach the maximum number of DG units and repeat the step 2
Step 4: Continue the process until reach maximum number of DG unit. Update the total loss and total VSF of the Distribution system.
Step 5: Check for maximum number of iteration. If satisfied store the location of DG at the bus and number of DG unit at connected bus. If not satisfied, go to step 2.
Step 6: calculate the optimal size of DG for the results obtained from step 5 using below equation.
For WTGU,
max ,
1
,
*
i
i n
n
w i i
wind
n
P
DG
(19)Stop the process.
V. RESULTS AND DISCUSSIONS
Technology (IJRASET)
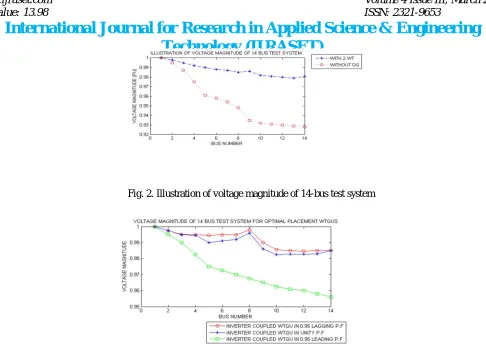
[image:7.612.64.550.21.369.2]Fig. 2. Illustration of voltage magnitude of 14-bus test system
Fig. 3. Voltage magnitude of 14-bus system for optimal placement of WTGUs in 0.95 lagging, leading and unity p.f mode
Utilities may be interested to locate WTGU at certain number of buses. Considering the fact, detail allocation of WTGU from minimum penetration to maximum is experimented.
After placed the WTGU in found weak bus system the voltage stability factor of bus was increased and total loss of the bus system can be minimized.
Total VSF has been increased up to 3.24%, total power loss minimized up to 45.237% comparatively initial total loss and VSF. The placement result shown in Table 1
14-Bus system
No.of connection bus
Location at bus(no.of WTGU)
Total VSF
Improvement in voltage stability (%)
Total loss(KVA)
Power loss minimization (%)
1 Bus-4(5) 13.4521 2.46 62.122 38.342
2 Bus-4(4),
Bus-7(3)
[image:7.612.185.411.238.366.2]13.5643 3.24 52.464 45.237
Table 1. Optimal location and number of WTGU units at unity power factor for 14-bus system along with voltage stability improvement and power loss reduction.
VI. CONCLUSION
Technology (IJRASET)
Optimal placement of WTGUs has been investigated on 14-bus radial distribution system.
REFRENCES
[1] Ackermann T, Andersson G, Soder L. (2001),’Distributed generation’: a definition. Electric Power Syst Res. Vol. 57, pp. 195–204.
[2] Carmen L.T. Borges, Djalma M. Falcao.(2006)’ Optimal distributed generation allocation for reliability, losses, and voltage improvement’.Electrical Power and Energy Systems Vol. 28 pp. 413–420.
[3] T. K. A. Rahman, S. R. A. Rahim, and I. Musirin, "Optimal allocation and sizing of embedded generators," in Power and Energy Conference, 2004. PECon 2004. Proceedings. National, 2004, pp. 288-294.
[4] E. Haesens, M. Espinoza, B. Pluymers, I. Goethals, V. V. Thong, J. Driesen, R. Belmanss, B. de Moor. (2005)’ Optimal placement and sizing of distributed generator units using genetic optimization algorithms’, Electrical Power Quality and Utilisation. Journal. Vol. 11, pp. 97-104.
[5] Wong, L.Y., Rahim, S.R.A. Sulaiman, M.H. Aliman, (2010),'Distributed generation installation using particle swarm optimization ', Power Engineering and Optimization Conference (PEOCO), 2010 4th International pp.159 – 163.
[6] Abu-Mouti, El-Hawary, M. (2011)’ Optimal Distributed Generation Allocation and Sizing in Distribution Systems via Artificial Bee Colony Algorithm’, Power Delivery, IEEE Transactions Vol. 26, pp.2090 – 2101.
[7] H. Falaghi and M. R. Haghifam, "ACO Based Algorithm for Distributed Generation Sources Allocation and Sizing in Distribution Systems," in Power Tech, 2007 IEEE Lausanne, 2007, pp. 555-560.
[8] Partha Kayal, C.K. Chanda. (2013),'Placement of wind and solar based DGs in distribution system for power loss minimization and voltage stability improvement’, Electrical Power and Energy Systems Vol. 53 pp. 795–809.
[9] Divya KC, Rao PSN. Models for wind turbine generating systems and their application in load flow studies. Electric Power Syst Res 2006; 76:844–56. [10] X.-S. Yang, "Firefly algorithms for multimodal optimization, “Stochastic Algorithms: Foundation and Applications SAGA 2009, vol. 5792, pp. 169-178, 2009. [11] Firefly Algorithm for constrained optimization by Xin-She Yang. Retrieved on January 1st, 2012 [Online]. Available: