The birth of the Epitranscriptome: deciphering the
function of RNA modifications
Yogesh Saletore, Kate Meyer, Jonas Korlach, Igor D Vilfan, Samie Jaffrey
and Christopher E Mason
Saletore et al. Genome Biology 2012, 13:175 http://genomebiology.com/2012/13/10/175 (31 October2012)
!
'
'
.#'
-)((*
)((*
)("(*
%$
Introduction
Techniques for sequencing RNA and DNA pioneered by Fred Sanger and others in the 1960s [1] and 1970s [2] began to reveal the biochemical recipes for storing bio-logical information in organisms and laid the foun da tion for modern genomics. Yet, decades before the fi rst nucleic acid was sequenced, various chemical modi fi ca-tions of DNA had already been described, such as 5-methylcytosine [3] and 5-hydroxy-methylcytosine [4], now dubbed the 5th [5] and 6th [6] base of genetics; in total, several dozen DNA modifi cations have been reported [7]. Th ese modifi cations, along with histone modi fi cations, are now recognized as important regula tory mechanisms for controlling gene expression and function [8].
Fortunately, it is now relatively easy to characterize these modifi ed DNA bases, which form part of the ‘epi’-genome (epi, on top), for any organism with a fi nished genome, given the widespread availability of high-through put techniques, especially those based on next-generation sequencing (NGS). Various NGS approaches are being used in the National Institutes of Health (NIH)’s Epigenomics Roadmap [9] and in the BLUEPRINT
Project [10]. Similarly, cell-specifi c, post-translational modi fi cations of proteins, sometimes referred to collect-ively as the ‘epiproteome’ [11], are essential mechanisms necessary for the regulation of protein activity, folding, stability and binding partners. Elucidating the roles of protein and DNA modifi cations has had a major impact on our understanding of cellular signaling, gene regu-lation and cancer biology [12].
However, our understanding of an additional regulatory layer of biology that rests between DNA and proteins is still in its infancy; namely, the multitude of RNA modi-fi cations that together constitute the ‘Epitranscriptome’. Th ere are currently 107 known RNA base modifi cations, with the majority of these having been reported in tRNAs or rRNAs [13]. Outside the 5’ cap, the role of modifi ca-tions in mRNA is unclear [14,15]. One RNA modifi cation,
N6-methyladenosine, or methyl-6-adenosine (m6A), has
been observed in a wide variety of organisms, including viruses [16], yeast [17], plants [18], humans [19,20] and mice [19,20], and exhibits dynamic changes in response to a variety of stimuli in yeast [21]. Older studies using purifi ed polyadenylated RNA from mammalian cells showed that m6A was the most abundant
post-trans-criptional modifi cation in polyadenylated RNA [14], which contemporary doctrine considered to be synony-mous with mRNA. However, it is now known that poly-adenylation occurs not only on mRNAs, but also in other RNAs, such as rRNAs and long intergenic noncoding RNAs (lincRNAs). Th us, it was historically unclear exactly how m6A existed in mRNAs and, if so, whether it
was restricted to a select few transcripts or prevalent throughout the transcriptome.
Previous methods for investigating the prevalence of m6A were laborious and involved incubating cells with 14C-radiolabeled methionine (the precursor for the
endogenous methyl donor, S-adenosylmethionine), follow-ing which the incorporation of methyl groups into RNAs could be quantifi ed. Th ese early studies detected methy-lated bases in ribosomal RNA (rRNA) [22], small RNA fractions [23-27]and in mRNAs [28]. However, these methods were limited by their inability to identify the specifi c mRNAs that contained m6A. Indeed, m6A had
previously been detected in vivo for only a single
Abstract
Recent studies have found methyl-6-adenosine in thousands of mammalian genes, and this modifi cation is most pronounced near the beginning of the 3’ UTR. We present a perspective on current work and new single-molecule sequencing methods for detecting RNA base modifi cations.
Keywords epigenetics, epigenomics, epitranscriptome, m6A, methyl-6-adenosine, methyladenosine, N
6-methyladenosine, RNA modifi cations
© 2010 BioMed Central Ltd
The birth of the Epitranscriptome: deciphering the
function of RNA modifi cations
Yogesh Saletore
1,2,3, Kate Meyer
4, Jonas Korlach
5, Igor D Vilfan
5, Samie Jaff rey
4and Christopher E Mason
1,2,*
OPINION
*Correspondence: [email protected]
1Department of Physiology and Biophysics, Weill Cornell Medical College,
New York, NY 10065, USA
Full list of author information is available at the end of the article
mammalian mRNA (bovine prolactin [29]), and the specific sites of m6A incorporation had been established
for only two RNAs: prolactin [29] and Rous sarcoma virus RNA [30,31]. The methods used to map these m6A
sites were technically challenging and, more importantly, required a pre-ordained focus on a particular transcript, rather than a global approach that could detect sites of adenosine methylation in all mRNAs. Moreover, adeno-sine methylation is invisible, insofar as both methylated and non-methylated adenosines readily base pair with T or U, and both are reverse transcribed to T, further hindering the study of m6A and its role in biology.
However, a renewed interest in m6A has recently
emerged, partially due to the finding that the fat mass- and obesity-associated (FTO) gene encodes a brain- and hypothalamus-enriched m6A demethylase that is
responsible for converting m6A to adenosine [32]. Defects
in this enzyme result in significant alterations in energy use and metabolism, and mutations in FTO have recently been linked to a higher risk for Alzheimer’s disease and decreased brain mass [33,34]. These studies suggest that m6A may have a physiological role in cellular signaling
and neurodegeneration. Recent advances in NGS tech-nology, in addition to the availability of antibodies that recognize m6A, have enabled the development of global
approaches for studying m6A. Recently, two groups have
independently developed high-throughput methods for rapid characterization of m6A sites across the
transcrip-tome. Methods such as methyl-RNA-immunoprecipi-tation-sequencing (MeRIP-seq) [19] or m6A-seq [20],
which combine immunoprecipitation (IP) of methylated RNAs using an m6A-specific antibody, with NGS, have
finally opened the door to global methods for studying the epitranscriptome and its dynamics.
Mapping the epitranscriptome
Although MeRIP-seq and m6A-seq were developed
independently [19,20], both are very similar in the initial RNA preparation and IP steps. The larger differences between the two protocols lie in their downstream compu tational methods rather than in sample prepara-tion, which in both cases followed methods similar to existing chromatin IP-seq (ChIP-seq), insofar as they performed IP with an m6A-specific antibody. Table 1
shows the similarities and differences between the MeRIP-seq and m6A-seq protocols.
Both datasets produced qualitatively similar results, with m6A peaks in introns, 5’ UTRs, exons, splice
junc-tions, ncRNAs and intergenic regions, indicating that m6A is a widespread and wide-ranging RNA modification.
The MeRIP-seq study also identified peaks in lincRNAs. The genomic features for which m6A was particularly
enriched are listed in Table 1; the main discrepancy between the two studies in this regard concerned the
enrichment of m6A at transcription start sites (TSSs),
which was observed by m6A-seq, primarily in a single cell
line (Figure 1a). An explanation for this discrepancy may be the different window used to define the TSS. A comparison between mouse and human data in both studies showed a high conservation of specific m6A sites
across the two species. Finally, digesting samples with various RNases prior to MeRIP-seq demonstrated that m6A sites were mostly present at internal sites within
mRNAs and were absent from polyA tails.
In addition to sequencing, the MeRIP-seq study also used immunoblotting to investigate m6A, demonstrating
that m6A is present in mouse heart, lung, brain, liver and
kidney tissues, with a particular enrichment in brain, liver and kidney. High levels of m6A were found in HepG2
and MCF7 cells, in contrast to lower levels detected in other human cancer cell lines (PC3 and PC9). The dynamic nature of m6A was confirmed by comparing
embryonic with adult tissue, which showed that m6A
levels increase over the course of development. The m6
A-seq study also found m6A to be a dynamic modification,
finding that its distribution changed in response to a variety of external stimuli (ultraviolet, interferon gamma, hepatocyte growth factor and heat shock), although as many as 70 to 95% of the peaks were static.
Experiments leveraging the depletion of the METTL3 subunit responsible for methylating adenosines were used in the m6A-seq study to explore the modification’s
function. A statistically significant increase in the abun-dance of alternatively spliced transcripts was observed as a result of this depletion, with the alternatively spliced exons and introns showing an enrichment for m6A peaks.
However, a permutation analysis of splice junction-localized m6A sites in the MeRIP-seq study data did not
find a statistically significant enrichment of m6A peaks in
the proximity of splice junctions [19]. Moreover, an analysis of the total mapped bases from the MeRIP-seq samples versus the control, non-IP RNA samples showed that fewer bases mapped to splice junctions in the IP samples (Additional file 1). Elucidating whether m6A
functions in splicing and, if so, whether this is direct or indirect through the regulation of splicing factor-encoding transcripts, will require further investigation. In light of the MeRIP-seq data, we suggest that m6A is
not likely to cause an overall increase in the global amount of transcript splicing, but it may modify splicing for certain classes of genes, and particularly for genes with alternative, internal exons [20].
Challenges of epitranscriptomic site detection
There are many factors to consider when computing the m6A enrichment for a site. For example, the definition of
depth can all impact the degree of enrichment dis-covered. Given that epitranscriptomics is a nascent field, computational analysis methods are only now emerging. Here, we explore the impact of these factors on detecting and quantifying m6A.
A comparison of the raw peaks found in the MeRIP-seq and m6A -seq studies showed surprisingly little overlap,
even with a single base threshold (Table 2). However, the different cell types used, as well as slightly different RNA handling methods, likely account for some of these peak differences [19,20]. Another technical contributor to the low overlap may be erroneous methylation calls, given that the false discovery rate (FDR) for both methods was 5 to 7%. The overlap notably improved when bases in transcripts with low expression levels were excluded (Table 3). These complications notwithstanding, the total number of m6A sites identified encompassed the majority
of human genes and almost one-third of mouse genes (Table 2).
We re-analyzed the datasets from both studies in order to determine the effect of the peak-calling method on the apparent m6A distribution in the transcriptome and
found two discrepancies. By comparing peak-calling methods, we observed that the presence of the 5’ UTR peak in the m6A-seq dataset was attenuated when that
study’s peak-caller was replaced by MeRIPPeR [35] from the MeRIP-seq study. This reduction indicates that each of the two peak-calling algorithms may have different sensitivities and specificities.
We also note that the 5’ UTR m6A signal in the original
peak sets used a definition of a TSS that was 150 bp, and that the signal was primarily derived from larger genes, as measured by exon number (Figure 2); a potential m6A
enrichment within these genes can be seen at the end of the first intron and at the beginning of the following exon (Figure 2). Since the distribution of the m6A sites is
non-uniform (in the sense that enrichment is dependent on the number of exons in a gene and that on the context of an exon within a gene), a useful method to examine m6A
localization, or any epitranscriptomic change, may be to separate the genes into their sub-geographies (Figure 3).
m6A mapping is heavily impacted by the read depth and by the choice of peak detection and alignment methods
To further investigate the analytic dependency of m6A
peak detection, we examined the m6A site detection as a
function of alignment method, antibody and read depth. Part of the challenge of MeRIP-seq analysis is a reliance on other IP-seq analysis methods, developed for chromatin IP-seq (ChIP-seq). ChIP-seq experiments are designed to characterize histone and DNA-transcription factor interactions. Existing ChIP-seq peak-finders take advantage of inherent properties of the data to assist in finding peaks, many of which do not apply in the case of finding m6A sites in RNA. For example, each
fragmented RNA molecule pulled-down by an m6A
[image:4.612.63.542.99.371.2]antibody has the potential to harbor far more methylation
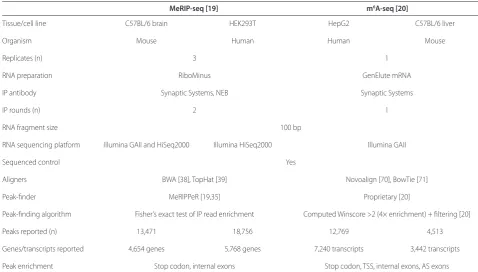
Table 1. Comparison of MeRIP-seq and m6A-seq
MeRIP-seq [19] m6A-seq [20]
Tissue/cell line C57BL/6 brain HEK293T HepG2 C57BL/6 liver
Organism Mouse Human Human Mouse
Replicates (n) 3 1
RNA preparation RiboMinus GenElute mRNA
IP antibody Synaptic Systems, NEB Synaptic Systems
IP rounds (n) 2 1
RNA fragment size 100 bp
RNA sequencing platform Illumina GAII and HiSeq2000 Illumina HiSeq2000 Illumina GAII
Sequenced control Yes
Aligners BWA [38], TopHat [39] Novoalign [70], BowTie [71]
Peak-finder MeRIPPeR [19,35] Proprietary [20]
Peak-finding algorithm Fisher’s exact test of IP read enrichment Computed Winscore >2 (4× enrichment) + filtering [20]
Peaks reported (n) 13,471 18,756 12,769 4,513
Genes/transcripts reported 4,654 genes 5,768 genes 7,240 transcripts 3,442 transcripts
sites than the maximum number of protein binding sites expected for the equivalent ChIP-seq fragment, and so the m6A sites are more challenging to resolve. ChIP-seq
peak fi nders use diff erent methods and heuristics to fi nd peaks, attempting to balance fi nding weak peaks with maintaining a low FDR and resulting in a diverse group of peak sets [36,37]. Th e same is true for m6A peaks, as the
MeRIP-seq study used Fisher’s exact test and the m6
A-seq study derived a window score based on peak enrichment.
Each of the multiple methods for aligning reads to a transcriptome has its own set of advantages and chal-lenges. A genome-based aligner, such as BWA [38], can be used when a genome sequence is available, but introduces added complexity when reads map to multiple transcript variants, and suff ers from being unable to align reads to genomic regions that are absent from a pre-defi ned reference. Alternatively, a gap-based aligner, such as TopHat [39] or GSNAP [40], can be used, with the advantage that these algorithms are designed for trans-criptomes and so can map reads across both known and novel splice junctions. However, these methods tend to
be slower and can introduce many false splice sites, leading to poorly aligned reads. Th e ability of an aligner to handle errors typical of RNA-seq, which diff er to those seen in DNA sequencing, is another factor to consider. A common source of error in RNA-seq is the random hexamer priming used in cDNA synthesis, which intro-duces a bias in the nucleotide distribution at the begin-ning of reads [41]. One possible solution to this particular error is to trim the reads, an approach that was employed in the m6A-seq study.
To examine the eff ect of aligner on the detection of m6A peaks, we analyzed processed HEK293T MeRIP-seq
data using three aligners (BWA [38], TopHat 2 [39] and GSNAP [40]), and then called peaks with MeRIPPeR [35]. We observed a slight increase in the number of 5’ UTR peaks when using the transcriptome aligners GSNAP and TopHat 2 relative to the number called when using BWA (Additional fi le 2). More importantly, there was a signifi -cant increase in the number of individual peaks: MeRIPPeR found 19,617 peaks using BWA, 45,738 with GSNAP and 135,706 using TopHat 2, all at the same FDR (0.05). Th ese results indicate that the alignment method selected has a signifi cant impact on the number of peaks identifi ed in a MeRIP-seq dataset.
To eff ectively gauge the infl uence of read depth on m6A
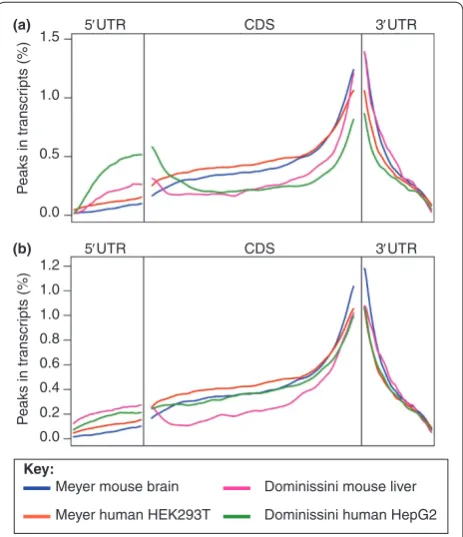
[image:5.612.67.299.89.358.2]site detection, we used a sub-sampling titration analysis of the aligned reads. We found that peak detection is heavily dependent on read depth (Additional fi le 3a), with some aligners showing a nearly linear increase in peaks as a function of depth. Th e number of genes in which these peaks were found also increased with read depth, albeit less dramatically (Additional fi le 3b), with Figure 1 . Peak distribution. (a) We plotted the distribution of the
peaks reported across gene bodies by the MeRIP-seq and m6
A-seq studies. Note the very well defi ned enrichment for peaks near the stop codon and in the 3’ UTR. The m6A-seq HepG2 peaks also
show a peak in the 5’ UTR. (b) The distribution of peaks across the transcriptome using the BWA-based MeRIPPeR pipeline [35] on the data from both groups. Data from [19] and [20]. CDS, coding sequence.
0.0 0.5 1.0 1.5
(a) 5′UTR CDS 3′UTR
P
eaks in tr
anscr
ipts (%)
0.8 1.0 1.0 1.2
0.0 0.2 0.4 0.6
(b) 5′UTR CDS 3′UTR
P
eaks in tr
anscr
ipts (%)
Meyer mouse brain
Key:
[image:5.612.313.545.101.151.2]Meyer human HEK293T Dominissini human HepG2 Dominissini mouse liver
Table 2. O verlap of genes with m6A peaks
Total genes Common MeRIP-seq m6A-seq
Organism with m6A genes only only
Human 15,160 4,808 3,249 7,103
Mouse 7,627 2,031 3,870 1,726
The total number of genes that overlap with m6A sites in at least one of the
two datasets (‘total genes with m6A’) is shown for both human and mouse. The
overlap between the two datasets (‘common genes’) is small. The number of genes reported in one dataset only for each of the datasets is also shown.
Table 3. O verlap of commonly expressed genes with m6A
sites
Genes Expressed
expressed genes with Common MeRIP- m6A-seq
Organism (RPKM ≥0.2) m6A genes seq only only
Human 19,621 7,228 3,568 1,212 2,448
Mouse 22,698 5,955 1,927 2,616 1,412
The total number of genes, excluding those with low expression (RPKM <0.2), that overlap with m6A sites in at least one of the two datasets (‘expressed genes
with m6A’) is shown for both human and mouse. The overlap between the two
[image:5.612.313.546.230.288.2]the number of genes continually increasing as a function of depth. While a specifi c point in a transcript might be correctly called as an m6A site, it is not known if the site
is methylated in all copies of that transcript [19]. Th e percentage of transcripts at which a site is methylated may be quantifi ed as the stoichiometry of m6A. It is likely
that the new peaks detected with increasing read depth are low in m6A stoichiometry and hence more
challeng-ing to detect at lower read depths. From these data, we extrapolate that, given enough tissues, cell types and conditions, it is possible that almost all genes may be marked, at some point, by m6A.
We next sought to establish whether m6A peak calls
vary with the antibody used, by separately plotting peaks obtained with the two diff erent antibodies in the MeRIP-seq study. Both antibodies had the same peak distribution across gene bodies (Additional fi le 4), indicating that the choice of antibody, at least for the two tested, should not impact the global distribution of m6A sites.
m6A motif analysis
A primary motif [AG]ACU was discovered within m6A
peaks by both studies, each of which used a diff erent motif-fi nding algorithm, and both analyses suggest that the A in the canonical motif is the methylated site - agreeing with prior work in m6A sequence specifi city
[42,43]. Both groups found the motif to be highly enriched in peak regions compared with negative control regions. If the A in the motif is indeed the m6A, then
application of this information to m6A-seq or MeRIP-seq
datasets could enable the mapping of m6A sites at single
base pair resolution. We used a motif pattern-matching algorithm from FIRE [44] to fi nd the [AG]ACU motif in the MeRIP-seq mouse dataset (Methods), and subse-quently applied the assumption that the A in each motif is equivalent to an m6A site, to identify m6A sites in all
the datasets. We identifi ed 21,004 m6A sites from 10,488
m6A-seq HepG2 peaks, 46,293 from 17,071 MeRip-seq
HEK293T peaks, 9,124 from 4,054 m6A-seq mouse liver
Figure 2 . Peak distribution across the transcriptome. Thepeak distribution depicted is the average across the entire transcriptome. Peaks are mapped to transcripts and assigned to the following transcriptomic features: 1 kB upstream from the TSS and downstream from the transcription end site, 5’ and 3’ UTRs, coding segments (CDS), and exon and intron segments. In the bottom row, peaks mapping to transcripts with four or more exons are shown, with the fi rst, penultimate and last exons separated into individual boxes, as are their neighboring introns. The remaining exons and introns are shown in the middle boxes as a contiguous segment. Genes with only two or three exons are shown in the middle row and single exon genes are shown in the top row. Data from [19] and [20].
0.4 0.5 0.6 0.7
0.0 0.1 0.2 0.3
0.4 0.5 0.6 0.7
0.0 0.1 0.2 0.3
1 CDS exon genes
−1 kB 5′UTR CDS 3′UTR +1 kB
−1 kB 5′UTR +1 kB
Last CDS 3′UTR 1st
CDS 1st lntron
Middle CDS
Last lntron
0.4 0.5 0.6 0.7
0.0 0.1 0.2 0.3
−1 kB 5′UTR +1 kB
Last CDS 3′UTR 1st
CDS lntron1st lntron2nd MiddleCDS Middlelntron
Last lntron 2nd
CDS [N-1]thIntron [N-1]thCDS
2-3 CDS exon genes
4+ CDS exon genes
Meyer mouse brain Key:
[image:6.612.70.546.90.420.2]peaks, and 37,459 from 12,664 MeRIP-seq mouse brain peaks. Only about 5 to 15% of the peaks lacked the motif sequence and the distribution of these putative single base-resolution m6A sites across gene bodies is very
similar to the peak distribution (Figure 1a).
However, we did not observe an enrichment of m6A
sites in the 5’ UTR, and the coding sequence profi le is fairly fl at until the peak reaches the proximity of the stop codon. Th is could indicate that the identifi ed [AG]ACU motif is specifi c to those peaks near the stop codon, or that the peak enrichment near the 5’ UTR does not refl ect a true increase in the number of actual m6A sites.
To test whether the motif was specifi c to stop codon-proximal regions, we performed a FIRE [44]motif fi nder analysis of the 5’ UTR peaks that were present in the MeRIP-seq mouse liver dataset, since this dataset was not enriched for this motif in this genomic region. Nonetheless, FIRE found a [CG]ACU motif, though not the strongest motif, indicating that it is not specifi c to the stop codon peaks, and thus likely a global motif for m6A,
but perhaps weakly represented in the 5’ UTR.
Single-molecule approaches to RNA modifi cations
Single-molecule sequencing has the potential to provide base-level resolution of m6A sites, without the need for
motif-based inference. Th e most commonly found platform for this method of sequencing currently on the market is the single-molecule, real-time (SMRT) tech-nology (Pacifi c Biosciences). SMRT sequencing uses thousands of zero-mode waveguides (ZMWs) to capture an enzyme in real time, traditionally a DNA polymerase, as it incorporates fl uorescent nucleotides into a polymer [45]. Th is method of molecular monitoring has the
advantage of detecting both genetic and epigenetic information simultaneously, since the patterns of base incorporation by the polymerase are contingent upon the steric and sequence contexts of the bases present in the template [46]. Specifi cally, if a modifi ed base is present on the template, the biophysical dynamics of DNA poly-merase movement and base incorporation are aff ected, creating a unique kinetic signature before, during and after base incorporation, and thus enabling identifi cation of specifi c DNA modifi cations [47].
Here, we report a novel application of this technology, which can be used to detect modifi ed bases within RNA, including m6A sites. To characterize m6A sites in RNA at
single-nucleotide resolution, we used a reverse transcrip-tase as the enzyme within a ZMW, instead of a DNA polymerase, and this substitution allowed the direct obser-vation of cDNA synthesis in real time. While base incor-porations during reverse transcription typically occur at standard speeds, the incorporation of synthetically designed m6A sites showed that there is a signifi cant
increase in the inter-pulse duration (IPD) when a methy-lated adenosine is present in the RNA template, relative to the IPD for a standard adenosine (Figure 4). To our knowledge, this represents the fi rst demonstration of a reverse transcriptase-based kinetic signature that can directly detect modifi ed RNA. However, current single-molecule technology is not without its own challenges. First and foremost, reverse transcriptases stutter when incorporating bases, complicating the accurate reading of homonucleotide stretches and the base resolution of m6A
therein. Second, the current throughput is too low for transcriptome-wide approaches. Notwithstanding these caveats, the SMRT technology has the clear potential to detect an underlying epitranscriptomic change in a native RNA template.
Similarly, Oxford Nanopore Technologies (ONT) and other companies are developing nanopore-based sequen-cing technologies, which use nanopore-forming proteins to sequence DNA by attaching an application-specifi c integrated circuit to the membrane upon which the nanopore rests. In principle, observations of any modi-fi ed DNA or RNA base could be made during transit of the molecule through the nanopore, and some observa-tions have already been made with nanopores that allow detection of 5hmC [48]. While all of these technologies are still under development, we note that all direct-observation methods, in principle, have the potential to detect m6A and other epitranscriptomic modifi cations.
Beyond m6A: mapping the full epitranscriptome
As mentioned previously, m6A is only one of many
[image:7.612.65.300.89.268.2]known epitranscriptomic modifi cations, the majority of which are located in tRNA and rRNA transcripts. We used data from the RNA Modifi cation Database to Figure 3 . Distribution of [AG]ACU motif sites. The [AG]ACU
motif was used to fi nd potential m6A sites within peaks, and the
distribution of these potential sites across gene bodies plotted. Data from [19] and [20].
0.0 0.5 1.0 1.5 2.0
2.5 5′UTR CDS 3′UTR
P
eaks with [A
G]A
CU motif
in tr
anscr
ipts (%)
Key:
Meyer mouse brain Meyer human HEK293T
Figure 4 . Single-molecule sequencing of RNA to detect epitranscriptomic changes. SMRT sequencing with the Pacifi c Biosciences RS shows longer times (inter-pulse distances) to incorporate m6A versus standard adenosines. (a) Experimental design for using a DNA primer in
a reverse transcription reaction. Sequencing of the unmodifi ed template shows, in a single-molecule sequencing trace, base incorporation via a reverse transcriptase-mediated cDNA synthesis reaction. (b) Shows sequencing as with (a), but using an RNA template with m6A instead of
normal adenosines. Incorporation of thymines (T) show signifi cant delay (longer inter-pulse distances). A.U. stands for normalized arbitrary units in fl uorescence measurement. (c) Exponential fi t of experimentally observed inter-pulse distances (IPDs). (d) Shows the diff erence between the average IPDs for native As and m6As. The average IPD in each case is the revers e of the exponential decay rate. The error bars indicate the range
around each average IPD that includes 83% of the observed IPDs (that is, ±½ of standard deviation of the exponential fi t). We used an Ansari-Bradley test in Matlab to confi rm that the distribution functions were diff erent (P = 0.0043).
80 0 20 40 60 80 100 120 140
Fluorescence intensity (a.u.)
Time (s)
0 20 40 60 80 100 120 140
Fluorescence intensity (a.u.)
Time (s) T
AA C TT G C A
T
AA C TT G C A
(a)
(b)
RNA Template 3′-TGATCCTAGATCGCGATTCATATGGTCCAACACTTAGAACGTCACAAATC-5′ cDNA 5′- AATCTTGCA
DNA primer: GCGCTAAGTATACCAGGTTGTG
100 120 140 160 180
80 100 120 140 160 180
200 220 240
RNA Template 3′-TGmATCCTmAGmATCGCGmATTCmATmATGGTCCmAmACmACTTmAGmAmACGTCmACmAmAmATC-5′
cDNA 5′- AA TCTTGCA
60
1– Normalized cumulative count
0.0 0.2 0.4 0.6 0.8 1.0
m6A
native A
0 5 10 15
(c)
Native A m6A
Average IPD (s)
0 1 2 3 4
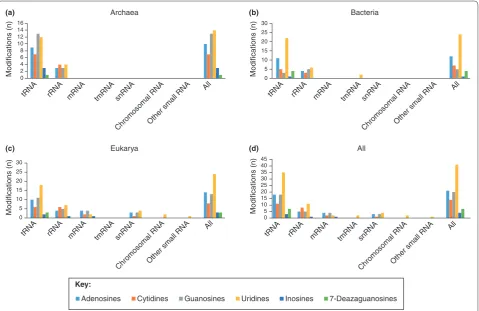
summarize the catalog of known RNA modifications by species, RNA type and base (Figure 5) [13].
Interestingly, the enzyme commonly known as DNA methyltransferase-2 (DNMT2) [Swiss-Prot: O14717] was shown to methylate cytosine 38 of tRNAAsp [49], and with
such high specificity that it was renamed tRNA aspartic acid methyltransferase 1 (TRDMT1). More recently, two more tRNAs were found to be methylated by TRDMT1, and it was also observed that the methylation protects the tRNA from stress-induced cleavage and improves its stability [50,51]. Several tRNA nucleoside modifications have been shown to control frame shifting and codon binding during translation. These types of modifications often occur in the crucial 7 bp anticodon stem and loop (ASL) region that binds to mRNA codons in ribosomes, and are hypothesized to affect the stability and codon binding affinity during translation by controlling the overall shape of the loop and its dynamics [52-54]. Taken together, a pattern emerges in which RNA modifications in multiple RNA species act as a critical regulatory layer of RNA biology.
Many RNA modifications would benefit from a more global and cross-species characterization than is present in the existing literature. For example, studies in
Escherichia coli and yeast have shown that nucleotide modifications in rRNA lie in functionally significant regions, with a possible role in the regulation of trans-lation [55]. Another example is methytrans-lation in plant rRNAs, where the modification is thought to help main-tain rRNA stability, possibly in order to susmain-tain ribosomal function during dramatic changes in temperature [56]. Interestingly, rRNA modifications in trypanosomes were shown to be mediated by small nucleolar RNAs (snoRNAs) [57], and changes in pseudouridylation of rRNA in mice, induced by mutations in DKC1 [Swiss-Prot: Q9ESX5], led to the onset of dyskeratosis con-genital, resulting in an increase in tumor susceptibility [58].
[image:9.612.68.548.89.400.2]Taken together, these studies demonstrate the possible significance and functional importance of (r/t/m/mi/sno/ linc)RNA modifications and begin to sketch out what might be called a transcriptomic regulome, where various species of coding and noncoding [59] RNAs, as well as their modified epitranscriptomic variants, compete with, coordinate and control each other during normal cellular processes, from the birth of a transcript until the production of its subsequent protein product or localiza-tion of its cellular target.
Figure 5. Known types of RNA modifications. Known modifications to RNA bases are grouped by RNA type, base and species: (a) archaea; (b) bacteria; (c) eukarya; (d) all species. Data are compiled from the RNA Modification Database [13].
Adenosines Cytidines Guanosines Uridines Inosines 7-Deazaguanosines
0 2 4 6 8 10 12 14 16
Modifications (n)
Modifications (n) Modifications (n)
Modifications (n)
Archaea
0 5 10 15 20 25 30
Bacteria
0 5 10 15 20 25 30
Eukarya
0 5 10 15 20 25 30 35 40 45
All
(b) (a)
(d) (c)
Key:
tRNA rRNA mRNA tmRNA snRNA
Chromosomal RNAOther small RNA All tRNA rRNA mRNA tmRNA snRNA
Chromosomal RNAOther small RNA All
tRNA rRNA mRNA tmRNA snRNA
Chromosomal RNAOther small RNA All tRNA rRNA mRNA tmRNA snRNA
Conclusions
Characterizations of m6A across the transcriptome show
that m6A is present in the majority of mammalian genes,
and is highly enriched at the beginning of the 3’ UTR and near the stop codon. Yet, many peaks exist in intergenic regions or in introns, and there is some evidence that m6A functions in the regulation of splicing or other
modifications that take place in the processing of RNA into a mature transcript. Since m6A distribution has
already been shown to undergo developmental changes and differences in cancer cell lines, it is also possible that epitranscriptomic signatures may be used to stratify various states of disease, just as in epigenetics [60]. Despite these advances, the complete purpose and molecular function of m6A is still unknown.
Nonetheless, some reasonable hypotheses can be pro-posed from the existing data. The enrichment of m6A
sites near the stop codon suggests that the modification could play some role in regulating translation termi-nation, potentially by altering translation efficiency or ribosome occupancy. In addition, m6A may mark
trans-cripts for shuttling to RNA granules or for other mecha-nisms that will preserve the RNA for later use. Just as the number of known modifications of RNA has rapidly expanded (currently 107), the number of known RNA-binding proteins similarly keeps growing, and it is possi-ble that some of these may be responsipossi-ble for altering the function of m6A within RNAs, either directly or through
the regulation of FTO or METTL3. Such interactions could occur at any point of transcription, post-trans-criptional modification or translation, with different consequences at each stage in the life of an mRNA. Finally, it is also possible that some RNA binding proteins may be m6A site scanners that bind selectively to either
methylated or unmethylated RNA, and as such would be regulated by the epitranscriptomic state of an RNA.
Two additional avenues warrant consideration when discussing possible regulatory functions of m6A. First,
even though an inverse spatial relationship was observed between m6A peaks and microRNA (miRNA) binding
sites in 3’ UTRs [19], it is notable that brain tissue is enriched for both highly expressed miRNAs and m6
A-containing genes, which suggests that miRNAs might influence the methylation of a targeted mRNA. In addition, recent work has shown an interplay of mRNA methylation and the reduction of Dicer activity, thus decreasing miRNA maturation rates [61]. Second, m6A
has already been shown to inhibit RNA editing in certain cases [62], implying that m6A may serve as the
long-sought balancing mechanism for the prevention of RNA editing [63]. If it is the case that m6A prevents RNA
editing from occurring, then evidence for this should be apparent in a diminished overlap between m6A and the
target RNA editing sites. So far, this appears to be true
[19], but the number of sites examined is too low to be definitive yet. If upheld with additional experiments, these feedback and regulatory loops may help explain the genesis and changes in RNA editing sites and miRNA levels, and provide additional mechanisms for controlling gene expression and RNA function.
In summary, the high-throughput and single-molecule methods described here represent the dawn of new research into a novel, RNA-based regulatory layer in cells, which adds yet another component of regulatory complexity to the central dogma of molecular biology (Additional file 5). The high conservation of specific m6A
sites across mouse and humans, as well as the general increase in PhyloP conservation scores of the m6A sites
themselves [19], both indicate that m6A is under strong
evolutionary selection pressure, and thus may represent a critical modification for many organisms. Even though previous evidence indicates that m6A is an RNA
modification present in all species, it has so far only been examined on a transcriptome-wide basis in two species (human and mouse), and observed in mRNAs only in eukaryotes, leaving open a wide area of research for many eukaryotic and prokaryotic systems. Just as the protein translation code and epigenetic code have slowly accreted into a cogent framework for information transfer and regulation within the cell, and between generations, these data indicate that an important epitranscriptome code is emerging. Notably, this dynamic code already appears to greatly expand the function and regulatory potential of all information contained within the many species of RNA present in a cell.
Methods
Sequence data were realigned to the genome using BWA [38], TopHat 2 [39] or GSNAP [40]. BWA was run using default parameters, and GSNAP and TopHat 2 were inputted with known RefSeq transcript definitions and run with novel splice junction finding turned on. The aligned files were converted to bam files using SamTools [64], filtering out reads with Phred quality scores under 20. BEDTools [65] was used to compute genome proper-ties, such as coverageBed to compute genome coverage and RPKM (using a Perl script) and intersectBed to determine peak overlaps. Subsampling was accomplished using Picard’s DownSampleSam [66].
Peak-finding was accomplished using MeRIPPeR [35] and transcriptome profile plots were generated using Jenotator: Java Genome Annotator [67]. A custom R script was used for plotting the transcriptome profile plot and Excel 2013 was used to plot the other bar charts. r-make was used to generate genome annotation plots [68]. Motif regions were extracted using ChIPseeqer’s ChIPseeqerMotifMatch [69] and individual m6A sites
Additional files
Abbreviations
FDR, false discovery rate; IP, immunoprecipitation; m6A, methyl-6-adenosine;
MeRIP-seq, methylated RNA immunoprecipitation and sequencing; RPKM, reads per kilobase of exon model per million mapped reads; SMRT, single-molecule real-time; UTR, untranslated region; ZMW, zero-mode waveguide.
Competing interests
YS, KM, SJ, and CEM declare that they have no competing interests. IDV and JK are full-time employees at Pacific Biosciences, a company commercializing single-molecule, real-time nucleic acid sequencing technologies.
Acknowledgements
We wish to acknowledge the invaluable contribution of the WCMC Epigenomics Core Facility. Supported by a Starr Cancer Consortium grant
(I4-A442) (CEM, YS), National Institutes of Health grants I4-A411, I4-A442, and 1R01NS076465-02 (CEM) and NINDS NS56306 (SRJ), and the Tri-Institutional Training Program in Computational Biology and Medicine (YS).
Author details
1Department of Physiology and Biophysics, Weill Cornell Medical College,
New York, NY 10065, USA. 2The HRH Prince Alwaleed Bin Talal Bin Abdulaziz
Alsaud Institute for Computational Biomedicine, Weill Cornell Medical
College, New York, NY 10065, USA. 3Tri-Institutional Training Program in
Computational Biology and Medicine, New York, NY10065, USA. 4Department
of Pharmacology, Weill Cornell Medical College, New York, NY 10065, USA.
5Pacific Biosciences, 1380 Willow Rd, Menlo Park, CA 94025, USA
Published: 31 October 2012
References
1. Brownlee GG, Sanger F, Barrell BG: Nucleotide sequence of 5S-ribosomal
RNA from Escherichia coli. Nature 1967, 215:735-736.
2. Sanger F, Air GM, Barrell BG, Brown NL, Coulson AR, Fiddes JC, Hutchison CA,
Slocombe PM, Smith M: Nucleotide sequence of bacteriophage phi X174
DNA. Nature 1977, 265:687-695.
3. Johnson TB, Coghill RD: Researches on pyrimidines. C111. The discovery of
5-methyl-cytosine in tuberculnic acid, the nucleic acid of the tubercle bacillis. J Am Chem Soc 1925, 47:2838-2844.
4. Wyatt GR, Cohen SS: A new pyrimidine base from bacteriophage nucleic
acids. Nature 1952, 170:1072-1073.
5. Ryan L, Ecker JR: Finding the fifth base: genome-wide sequencing of
cytosine methylation. Genome Res, 2009, 19:959-966.
6. Münzel M, Globisch D, Carell T: 5-Hydroxymethylcytosine, the sixth base of
the genome. Angewandte Chemie International Edition 2011, 50:6460-6468.
7. Korlach J, Turner SW: Going beyond five bases in DNA sequencing. Curr
Opin Struct Biol 2012, 22:251-261.
8. Miyanari Y, Torres-Padilla M-E: Control of ground-state pluripotency by
allelic regulation of Nanog. Nature 2012, 483:470-473.
9. Chadwick LH: The NIH Roadmap Epigenomics Program data resource.
Epigenomics 2012, 4:317-324.
10. Blueprint Epigenome [http://www.blueprint-epigenome.eu]
11. Dai B, Rasmussen TP: Global epiproteomic signatures distinguish
embryonic stem cells from differentiated cells. Stem Cells 2007,
25:2567-2574.
12. Akalin A, Garrett-Bakelman FE, Kormaksson M, Busuttil J, Zhang L, Khrebtukova I, Milne TA, Huang Y, Biswas D, Hess JL, Allis CD, Roeder RG, Valk PJM, Löwenberg B, Delwel R, Fernandez HF, Paietta E, Tallman MS, Schroth GP,
Mason CE, Melnick A, Figueroa ME: Base-pair resolution DNA methylation
sequencing reveals profoundly divergent epigenetic landscapes in acute myeloid leukemia. PLoS Genet 2012, 8:e1002781.
13. Agris P, Crain P, Rozenski J, Fabris D, Vendeix F: The RNA Modification
Database [http://rna-mdb.cas.albany.edu/RNAmods/]
14. Desrosiers RC, Friderici KH, Rottman FM: Characterization of Novikoff
hepatoma mRNA methylation and heterogeneity in the methylated 5’ terminus. Biochemistry 1975, 14:4367-4374.
15. Wei C-M, Gershowitz A, Moss B: Methylated nucleotides block 5’terminus
of HeLa cell messenger RNA. Cell 1975, 4:379-386.
16. Moss B, Gershowitz A, Stringer JR, Holland LE, Wagner EK: 5’-Terminal and
internal methylated nucleosides in herpes simplex virus type 1 mRNA.
J Virol 1977, 23:234-239.
17. Bodi Z, Button JD, Grierson D, Fray RG: Yeast targets for mRNA methylation.
Nucleic Acids Res 2010, 38:5327-5335.
18. Nichols JL: N6-methyladenosine in maize poly(A)-containing RNA. Plant Sci
Lett 1979, 15:357-361.
19. Meyer KD, Saletore Y, Zumbo P, Elemento O, Mason CE, Jaffrey SR:
Comprehensive analysis of mRNA methylation reveals enrichment in 3’ UTRs and near stop codons. Cell 2012, 149:1635-1646.
20. Dominissini D, Moshitch-Moshkovitz S, Schwartz S, Salmon-Divon M, Ungar L, Osenberg S, Cesarkas K, Jacob-Hirsch J, Amariglio N, Kupiec M, Sorek R,
Rechavi G: Topology of the human and mouse m6A RNA methylomes
revealed by m6A-seq. Nature 2012, 485:201-206.
21. Clancy MJ, Shambaugh ME, Timpte CS, Bokar JA: Induction of sporulation in
Saccharomyces cerevisiae leads to the formation of N6-methyladenosine in mRNA: a potential mechanism for the activity of the IME4 gene. Nucleic Acids Res 2002, 30:4509-4518.
Additional file 1. Alignment of reads to various gene categories. The percentage of bases mapping to each category was plotted for three m6A samples and three matching control samples from the
MeRIP-seq study’s human HEK293T dataset. The controls are samples sequenced prior to the IP and the high number of 3’ UTR reads represents control regions that do not contain m6A peaks, as well
as the fact that most peaks fall right between the last CDS and the beginning of the 3’ UTR.
Additional file 2. Effect of aligner on peak detection. Realigning the MeRIP-seq HEK293T data using three different aligners, with MeRIPPeR as the peak caller, shows that the peak distribution is dependent on the aligner chosen. Using TopHat 2 increases the number of 5’ UTR peaks detected.
Additional file 3. Peak and transcript detection as a function of read depth.(a) Increasing the number of aligned reads sampled from three different aligners (BWA, GSNAP and TopHat 2) shows an increased peak detection (linear regression R2 = 0.83). Reads were
sampled from aligned reads of the MeRIP-seq HEK293T sample 2 dataset. (b) The number of transcripts that contain peaks for each of the subsampled levels. While increasing the read depth results in a dramatic increase in the number of peaks, the number of transcripts shows a much slower increase, indicating that increasing the read depth likely finds peaks with lower m6A stoichiometry.
Additional file 4. Antibody peak distribution. Peak distribution shown across gene bodies for each individual antibody, with the SySy antibody shown as a solid line and the NEB antibody shown as a dashed line. The distributions suggest that the two antibodies produce similar binding profiles. The NEB antibody does show a slightly higher peak in the 5’ UTR for the HEK293T sample 3, but the sample is a separate biological replicate and there is no SySy run for comparison, so the distribution could also be attributed to some change in the biological sample itself.
22. Iwanami Y, Brown GM: Methylated bases of ribosomal ribonucleic acid from HeLa cells. Arch Biochem Biophys 1968, 126:8-15.
23. Epstein P, Reddy R, Henning D, Busch H: The nucleotide sequence of nuclear
U6 (4.7 S) RNA.J Biol Chem 1980, 255:8901-8906.
24. Desrosiers R, Friderici K, Rottman F: Identification of methylated nucleosides
in messenger RNA from Novikoff hepatoma cells. Proc Nat Acad Sci U S A
1974, 71:3971-3975.
25. Levis R, Penman S: 5’-Terminal structures of poly(A)+ cytoplasmic
messenger RNA and of poly(A)+ and poly(A)− heterogeneous nuclear RNA of cells of the dipteran Drosophila melanogaster. J Mol Biol 1978,
120:487-515.
26. Wei CM, Gershowitz A, Moss B: 5’-Terminal and internal methylated
nucleotide sequences in HeLa cell mRNA. Biochemistry 1976, 15:397-401.
27. Bringmann P, Lührmann R: Antibodies specific for N6-methyladenosine
react with intact snRNPs U2 and U4/U6. FEBS Lett 1987, 213:309-315.
28. Horowitz S, Horowitz A, Nilsen TW: Mapping of N6-methyladenosine
residues in bovine prolactin mRNA. Proc Nat Acad Sci U S A 1984,
81:5667-5671.
29. Chen-Kiang S, Nevins JR, Darnell JE Jr: N-6-methyl-adenosine in adenovirus
type 2 nuclear RNA is conserved in the formation of messenger RNA. J Mol
Biol 1979, 135:733-752.
30. Beemon K, Keith J: Localization of N6-methyladenosine in the Rous
sarcoma virus genome. J Mol Biol 1977, 113:165-179.
31. Kane SE, Beemon K: Precise localization of m6A in Rous sarcoma virus RNA
reveals clustering of methylation sites: implications for RNA processing.
Mol Cell Biol 1985, 5:2298-2306.
32. Jia G, Fu Y, Zhao X, Dai Q, Zheng G, Yang Y, Yi C, Lindahl T, Pan T, Yang Y-G, He C: N6-Methyladenosine in nuclear RNA is a major substrate of the obesity-associated FTO. Nat Chem Biol 2011, 7:885-887.
33. Benedict C, Jacobsson JA, Rönnemaa E, Sällman-Almén M, Brooks S, Schultes
B, Fredriksson R, Lannfelt L, Kilander L, Schiöth HB: The fat mass and obesity
gene is linked to reduced verbal fluency in overweight and obese elderly men. Neurobiol Aging 2011, 32:1159.e1-5.
34. Keller L, Xu W, Wang HX, Winblad B, Fratiglioni L, Graff C: The obesity related
gene, FTO, interacts with APOE, and is associated with Alzheimer’s disease risk: a prospective cohort study. J Alzheimers Dis 2011, 23:461-469.
35. Saletore Y, Mason CE: MeRIPPeR [http://meripper.sourceforge.net/]
36. Rye MB, Sætrom P, Drabløs F: A manually curated ChIP-seq benchmark
demonstrates room for improvement in current peak-finder programs.
Nucleic Acids Res 2011, 39:e25.
37. Wilbanks EG, Facciotti MT: Evaluation of algorithm performance in
ChIP-Seq peak detection. PLoS One 2010, 5:e11471.
38. Li H, Durbin R: Fast and accurate long-read alignment with
Burrows-Wheeler transform. Bioinformatics 2010, 26:589-595.
39. Trapnell C, Pachter L, Salzberg SL: TopHat: discovering splice junctions with
RNA-Seq.Bioinformatics 2009, 25:1105-1111.
40. Wu TD, Nacu S: Fast and SNP-tolerant detection of complex variants and
splicing in short reads.Bioinformatics 2010, 26:873-881.
41. Hansen KD, Brenner SE, Dudoit S: Biases in Illumina transcriptome
sequencing caused by random hexamer priming. Nucleic Acids Res 2010,
38:e131.
42. Harper JE, Miceli SM, Roberts RJ, Manley JL: Sequence specificity of the
human mRNA N6-adenosine methylase in vitro. Nucleic Acids Res 1990,
18:5735-5741.
43. Wei C-M, Moss B: Nucleotide sequences at the N6-methyladenosine sites
of HeLa cell messenger ribonucleic acid. Biochemistry 1977, 16:1672-144.
Elemento O, Slonim N, Tavazoie S: A universal framework for regulatory
element discovery across all genomes and data types. Mol Cell 2007,
28:337-350.
45. Eid J, Fehr A, Gray J, Luong K, Lyle J, Otto G, Peluso P, Rank D, Baybayan P, Bettman B, Bibillo A, Bjornson K, Chaudhuri B, Christians F, Cicero R, Clark S, Dalal R, Dewinter A, Dixon J, Foquet M, Gaertner A, Hardenbol P, Heiner C,
Hester K, Holden D, Kearns G, Kong X, Kuse R, Lacroix Y, Lin S, et al.: Real-time
DNA sequencing from single polymerase molecules. Science 2009,
323:133-138.
46. Flusberg BA, Webster DR, Lee JH, Travers KJ, Olivares EC, Clark TA, Korlach J,
Turner SW: Direct detection of DNA methylation during single-molecule,
real-time sequencing. Nat Methods 2010, 7:461-465.
47. Song CX, Clark TA, Lu XY, Kislyuk A, Dai Q, Turner SW, He C, Korlach J: Sensitive
and specific single-molecule sequencing of 5-hydroxymethylcytosine. Nat Methods 2011, 9:75-77.
48. Wanunu M, Cohen-Karni D, Johnson RR, Fields L, Benner J, Peterman N, Zheng
Y, Klein ML, Drndic M: Discrimination of methylcytosine from
hydroxymethylcytosine in DNA molecules. J Am Chem Soc 2011, 133:486-492. 49. Goll MG, Kirpekar F, Maggert KA, Yoder JA, Hsieh C-L, Zhang X, Golic KG,
Jacobsen SE, Bestor TH: Methylation of tRNAAsp by the DNA
methyltransferase homolog Dnmt2. Science 2006, 311:395-398.
50. Schaefer M, Pollex T, Hanna K, Tuorto F, Meusburger M, Helm M, Lyko F: RNA
methylation by Dnmt2 protects transfer RNAs against stress-induced cleavage. Genes Dev 2010, 24:1590-1595.
51. Tuorto F, Liebers R, Musch T, Schaefer M, Hofmann S, Kellner S, Frye M, Helm M,
Stoecklin G, Lyko F: RNA cytosine methylation by Dnmt2 and NSun2 promotes
tRNA stability and protein synthesis. Nat Struct Mol Biol 2012, 19:900-905.
52. Urbonavièius J, Qian Q, Durand JMB, Hagervall TG, Björk GR: Improvement of
reading frame maintenance is a common function for several tRNA modifications. EMBO J 2001, 20:4863-4873.
53. Agris PF: Bringing order to translation: the contributions of transfer RNA
anticodon-domain modifications. EMBO Rep 2008, 9:629-635. 54. Dao V, Guenther R, Malkiewicz A, Nawrot B, Sochacka E, Kraszewski A,
Jankowska J, Everett K, Agris PF: Ribosome binding of DNA analogs of tRNA
requires base modifications and supports the “extended anticodon”. Proc Natl Acad Sci U S A 1994, 91:2125-2129.
55. Decatur WA, Fournier MJ: rRNA modifications and ribosome function.
Trends Biochem Sci 2002, 27:344-351.
56. Brown JW, Echeverria M, Qu LH: Plant snoRNAs: functional evolution and
new modes of gene expression. Trends Plant Sci 2003, 8:42-49.
57. Liang X-H, Uliel S, Hury A, Barth S, Doniger T, Unger R, Michaeli S: A
genome-wide analysis of C/D and H/ACA-like small nucleolar RNAs in Trypanosoma brucei reveals a trypanosome-specific pattern of rRNA modification. RNA
2005, 11:619-645.
58. Ruggero D, Grisendi S, Piazza F, Rego E, Mari F, Rao PH, Cordon-Cardo C,
Pandolfi PP: Dyskeratosis congenita and cancer in mice deficient in
ribosomal RNA modification. Science 2003, 299:259-262.
59. Stolc V, Gauhar Z, Mason C, Halasz G, van Batenburg MF, Rifkin SA, Hua S,
Herreman T, Tongprasit W, Barbano PE, Bussemaker HJ, White KP: A gene
expression map for the euchromatic genome of Drosophila Melanogaster.
Science 2004, 306:655-660.
60. Akalin A, Garrett-Bakelman FE, Kormaksson M, Busuttil J, Zhang L, Khrebtukova I, Milne TA, Huang Y, Biswas D, Hess JL, Allis CD, Roeder RG, Valk PJ, Löwenberg B, Delwel R, Fernandez HF, Paietta E, Tallman MS, Schroth GP,
Mason CE, Melnick A, Figueroa ME. Base-pair resolution DNA methylation
sequencing reveals profoundly divergent epigenetic landscapes in acute myeloid leukemia. PLoS Genet 2012, 8:e1002781.
61. Xhemalce B, Robson SC, Kouzarides T: Human RNA methyltransferase
BCDIN3D regulates microRNA processing.Cell 2012, 151:278-288.
62. Veliz EA, Easterwood LM, Beal PA: Substrate analogues for an RNA-editing
adenosine deaminase: mechanistic investigation and inhibitor design. J Am Chem Soc 2003, 125:10867-10876.
63. Li M, Wang IX, Li Y, Bruzel A, Richards AL, Toung JM, Cheung VG: Widespread
RNA and DNA sequence differences in the human transcriptome. Science
2011, 333:53-58.
64. Li H, Handsaker B, Wysoker A, Fennell T, Ruan J, Homer N, Marth G, Abecasis
G, Durbin R: The sequence alignment/map format and SAMtools.
Bioinformatics 2009, 25:2078-2079.
65. Quinlan AR, Hall IM: BEDTools: a flexible suite of utilities for comparing
genomic features. Bioinformatics 2010, 26:841-842. 66. Picard [http://picard.sourceforge.net/]
67. Saletore Y, Mason C: Jenotator: Java Genome Annotator [http://jenotator.
sourceforge.net/]
68. Zumbo P, Li S, Mason C: r-make [http://physiology.med.cornell.edu/faculty/
mason/lab/r-make/]
69. Giannopoulou E, Elemento O: An integrated ChIP-seq analysis platform
with customizable workflows. BMC Bioinformatics 2011, 12:277.
70. Novocraft: Novoalign [http://www.novocraft.com/]
71. Langmead B, Trapnell C, Pop M, Salzberg S: Ultrafast and memory-efficient
alignment of short DNA sequences to the human genome. Genome Biol
2009, 10:R25.
doi:10.1186/gb-2012-13-10-175
Cite this article as: Saletore Y, et al.: The birth of the Epitranscriptome: deciphering the function of RNA modifications.Genome Biology 2012,

![Figure 3 . Distribution of [AG]ACU motif sites. The [AG]ACU motif was used to fi nd potential m6A sites within peaks, and the distribution of these potential sites across gene bodies plotted](https://thumb-us.123doks.com/thumbv2/123dok_us/8654000.868500/7.612.65.300.89.268/figure-distribution-potential-distribution-potential-sites-bodies-plotted.webp)