International Journal of Emerging Technology and Advanced Engineering
Website: www.ijetae.com (ISSN 2250-2459, ISO 9001:2008 Certified Journal, Volume 6, Issue 2, February 2016)
40
Evaluation of Parametric Significance in Friction Welding
Process for AA7020 and Zr705 Alloy using Finite Element
Analysis
Chennakesava R Alavala
Professor, Department of mechanical Engineering, JNT University Hyderabad, India
Abstract—The purpose of this work was to assess friction
welding of AA7020 and Zr705 alloy. Finite element analysis was adopted to analyze the friction welding process. The process parameters were frictional time, frictional pressure, rotational speed and forging pressure. The joints were eva-luated for their strength, bulk deformation, penetration and flange formation. The heat affected zone and metal flow across the weld joints were also studied. For friction welding of AA7020-T6 and Zr705 alloy, the forging pressure should be less than the frictional pressure or equal.
Keywords— AA7020-T6, Zr705alloy, frictional time, frictional pressure, rotational speed and forging pressure, friction welding.
I. INTRODUCTION
Friction welding has received much attention in the field of manufacturing technology because it allows material combinations to be joined than with any other welding process [1, 2]. Friction welding was applied to join mild steel and austenite stainless steel [3], 1050 mild steel and 1050 Al alloy [4], 2024Al alloy and UNS C23000 brass [5], 2024Al alloy and AISI 1021 steel [6], UNS C23000 brass and AISI 1021 steel [7], and AA7020-T6 and Ti-6Al-4V alloy [8].
Zirconium 705 alloy is alloyed with Niobium to increase its strength and improve its formability. As a rule, all metallic engineering materials which are forgeable can be friction welded. But, zirconium cannot be fusion-welded to most other common construction metals such as copper, nickel, or iron. Zirconium forms brittle intermetallic compounds with these alloys - compounds that result in cracking. The quality of a weld is most often judged by the strength of the weld and the strength of the material around it. For zirconium components in addition to the strength of the weld, the corrosion performance is very important.
The foremost difference between the welding of similar materials and that of dissimilar materials is that the axial movement is unequal in the latter case whilst the similar materials experience equal movement along the common axis.
This problem arises not only from the different coefficients of thermal expansion, but also from the distinct hardness values of the dissimilar materials to be joined. The coefficient of thermal expansion of the AA7020 and Zr705 alloy, respectively are 23.1 and 6.3 µm/m-oC. The Brinell hardness values of the AA7020 and Zr705 alloy are 105 and 235. For this reason an extensive study is required to choose appropriate process parameters for friction welding of the AA7020 and Zr705 alloy. In recent years, finite element analysis (FEA) was applied to investigate the performance of welding processes [9, 10].
This investigation was carried out to study the influence of process parameters on weld strength, bulk deformation and metal flow during the conventional friction welding of the AA7020-T6 and Zr705 alloy. The experiments were planned using Taguchi techniques; the frictional welding was modeled using FEA.
II. FINITE ELEMENT ANALYSIS
In this study, ANSYS WORKBENCH (15.0) software was used in the coupled deformation and heat flow analysis during friction welding of the AA7020-T6 and Zr705 alloy. An axisymmetric 3D model of the AA7020-T6 and Zr705 alloy s of 25.4 mm diameter and 100 mm length were made using ANSYS workbench as shown in figure 1. Tetrahedron elements were used to mesh the AA7020-T6 and Zr705 alloy rods [11]. The rotating part (AA7020-T6) and the non-rotating part (Zr705 alloy) were meshed with 3298 elements / 14904 nodes and 3672 elements / 16493 nodes correspondingly.
International Journal of Emerging Technology and Advanced Engineering
Website: www.ijetae.com (ISSN 2250-2459, ISO 9001:2008 Certified Journal, Volume 6, Issue 2, February 2016)
[image:2.612.64.281.135.206.2]41 Figure 2: The boundary conditions.
The boundary conditions are mentioned in figure2. First the transient thermal analysis was carried out keeping the Zr705 alloy rod stationary and the AA7020-T6 rod in rotation. The coefficient of friction 0.2 was applied at the interface of the AA7020-T6 and Zr705 alloy rods. The convection heat transfer coefficient was applied on the surface of two rods. The heat flux calculations were imported from ANSYS APDL commands and applied at the interface. The temperature distribution was evaluated. The thermal analysis was coupled to the static structural analysis. For the structural analysis the rotating (AA7020-T6) rod was brought to stationary and the forging pressure was applied on the Zr705 alloy rod along the longitudinal axis. The Zr705 alloy rod was allowed to move in the axial direction. The structural analysis was carried out for the principle stresses and strains, equivalent stress and equivalent strain, and bulk deformation. The contact analysis was also carried out to estimate the depth of penetration and sliding of the material at the interface.
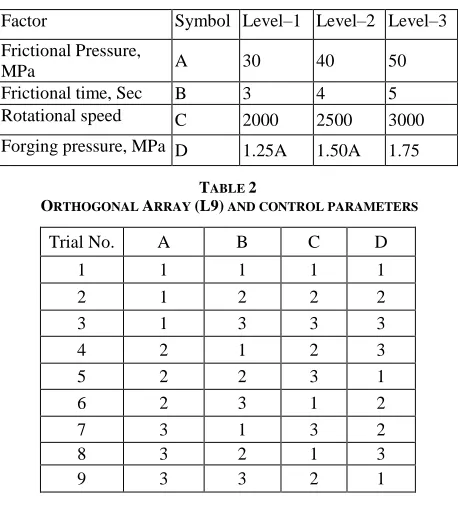
TABLE 1
PROCESS PARAMETERS AND LEVELS
Factor Symbol Level–1 Level–2 Level–3
Frictional Pressure,
MPa A 30 40 50
Frictional time, Sec B 3 4 5 Rotational speed C 2000 2500 3000
Forging pressure, MPa D 1.25A 1.50A 1.75
TABLE 2
ORTHOGONAL ARRAY (L9) AND CONTROL PARAMETERS
Trial No. A B C D
1 1 1 1 1
2 1 2 2 2
3 1 3 3 3
4 2 1 2 3
5 2 2 3 1
6 2 3 1 2
7 3 1 3 2
8 3 2 1 3
9 3 3 2 1
The modeling and analysis of the friction welding was carried out as per the design of experiments using Taguchi techniques. The process parameters and their levels are given table-1. The three levels of forging pressure were 1.25, 1.50 and 1.75 times of frictional pressure. The orthogonal array (OA), L9 was selected for the present work. The parameters were assigned to the various columns of O.A. The assignment of parameters along with the OA matrix is given in table 2.
III. RESULTS AND DISCUSSION
The experiments were repeated twice with two meshing conditions to keep errors minimum in the finite element analysis. the results obtained from the finite element analysis was verified experimentally on the selective trial. The statistical Fisher’s test was carried out to find the acceptable all process parameters at 90% confidence level.
A. Influence of Parameters on Temperature Distribution
Table – 3 gives the ANOVA (analysis of variation) summary of temperature distribution. Even though all the process parameters could satisfy the Fisher's test at 90% confidence level, only frictional pressure and rotational speed made major contribution in the total variation of temperature. The frictional pressure (A) and rotational speed (C) conferred, respectively, 55.15% and 38.53% of the total variation in the temperature. The contribution of frictional time (B) was negligible. Forging pressure (D) had a little influence of 6.25%.
TABLE 3
ANOVA SUMMARY OF THE TEMPERATURE DISTRIBUTION
Source Sum 1 Sum 2 Sum 3 SS v V F P
A 7750.77 10943.1 14174.4 3438627 2 1719314 12054.7 55.15
B 11037.07 10872.5 10958.7 2258.65 2 1129.33 7.92 0.03
C 8278.07 13647 10943.2 2402159 2 1201079 8421.2 38.53
D 11119.47 16013201 32868.3 390020 2 195010 1367.3 6.25
e 1283.64 9 142.626 1.00 0.04
T 38185.38 16048663 68944.6 6234349 17 100
Note: SS is the sum of square, v is the degrees of freedom, V is the variance, F is the Fisher’s ratio, P is the percentage of contribution and T is the sum squares due to total variation.
[image:2.612.56.285.461.719.2] [image:2.612.322.565.500.612.2]International Journal of Emerging Technology and Advanced Engineering
Website: www.ijetae.com (ISSN 2250-2459, ISO 9001:2008 Certified Journal, Volume 6, Issue 2, February 2016)
42
[image:3.612.67.278.215.342.2]The conditions of trial 9 gave the highest temperature (2845.10oC) generation and trial 1 gave the lowest temperature (887.37oC) generation in the rods. For trial 9, the frictional pressure and time were, respectively, 50 MPa and 5 sec; whereas these were 30 MPa and 3 sec respectively for the trial 1 (figure 4).
[image:3.612.321.563.271.535.2]Figure 3. Influence of frictional pressure on temperature.
[image:3.612.66.275.369.515.2]Figure 4. Influence of frictional time on temperature.
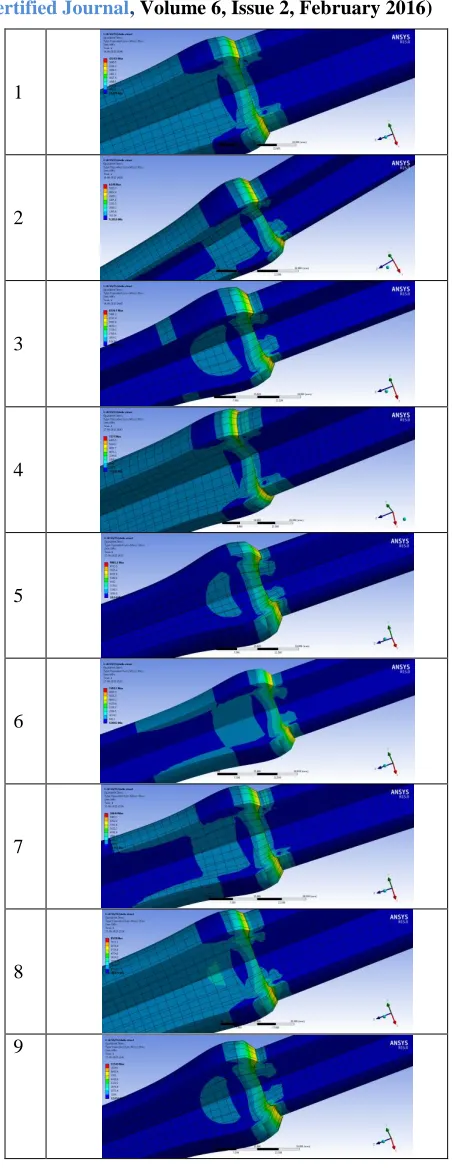
Figure 5: Temperature distribution during different trials.
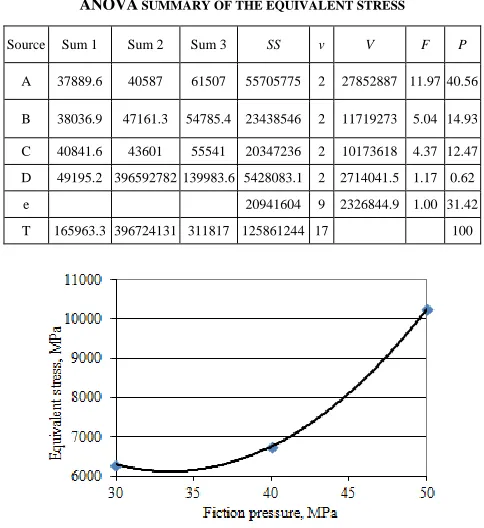
B. Influence of Parameters on Equivalent Stress
The ANOVA summary of the equivalent stress is given in Table 4. The process parameters which were acceptable through Fisher's test at 90% confidence level were frictional pressure (A), friction time (B) and rotational speed (D). The forging pressure was rejected as the Fisher's ratio was less than 3.01. The contributions of frictional pressure (A), friction time (B) and rotational speed (D) were, respectively, 40.56%, 14.93% and 12.47% towards the total variation of effective stress.
TABLE 4
ANOVA SUMMARY OF THE EQUIVALENT STRESS
Source Sum 1 Sum 2 Sum 3 SS v V F P
A 37889.6 40587 61507 55705775 2 27852887 11.97 40.56
B 38036.9 47161.3 54785.4 23438546 2 11719273 5.04 14.93
C 40841.6 43601 55541 20347236 2 10173618 4.37 12.47
D 49195.2 396592782 139983.6 5428083.1 2 2714041.5 1.17 0.62
e 20941604 9 2326844.9 1.00 31.42
[image:3.612.55.281.538.678.2]T 165963.3 396724131 311817 125861244 17 100
Figure 6. Influence of frictional pressure on equivalent stress.
[image:3.612.346.534.565.693.2]International Journal of Emerging Technology and Advanced Engineering
Website: www.ijetae.com (ISSN 2250-2459, ISO 9001:2008 Certified Journal, Volume 6, Issue 2, February 2016)
43
[image:4.612.329.555.121.706.2]The equivalent stress increased with increase of the frictional pressure, frictional time and rotational speed as shown in figure 6, 7 and 8. It can also be observed from figure 9 that the stress induced in the heat affected zone (HAZ) was higher in all the welds than that in the parent metal. This was due to recrystallization in the HAZ. The stresses induced in the HAZ were of thermal stresses due to frictional heat and of structural stresses owing to applied frictional pressure, frictional time and rotating speed. This is because the frictional heat is a function of pressure applied on the rods, contact time of the rods and the rotating speed of the rotational member. The residual stresses must be relieved by the heat treatment otherwise the joints may fail. The microstructure in the HAZ is observed to be fine as depicted in figure 9. There was severe plastic deformation across the interface between AA7020 and Zr705 alloy due to heat and pressure.
Figure 8. Influence of rotational speed on equivalent stress.
Figure 9. Linearized maximum principle stress induced in weld rods.
1
2
3
4
5
6
7
8
9
[image:4.612.63.269.339.444.2] [image:4.612.70.267.467.703.2]International Journal of Emerging Technology and Advanced Engineering
Website: www.ijetae.com (ISSN 2250-2459, ISO 9001:2008 Certified Journal, Volume 6, Issue 2, February 2016)
44
The conditions of trial 9 had induced the highest effective stress (11545 MPa) and trial 1 had induced the lowest effective stress (4325 MPa) in the rods as shown in figure 10. During friction heating stage any surface irregularities are removed, the temperature increases in the vicinity of the welded surfaces, and an interface of visco-plastic aluminum is formed. During forging pressure stage there is significant thermo-plastic deformation of aluminum in the contact area. In result of this is formation of a flange-like flash. The process of welding takes place due to the plastic and diffusion effects.
C. Influence of parameters on bulk deformation
The ANOVA summary of the directional deformation is given in table 5. The major contributions were of frictional pressure (50.43%) and forging pressure (36.86%) towards variation in the bulk deformation. The contribution of frictional time was 10.34% towards variation in the bulk deformation. The influence of rotational speed was negligible (1.08%).
TABLE 5
ANOVA SUMMARY OF THE BULK DEFORMATION
Source Sum 1 Sum 2 Sum 3 SS v V F P
A 4.64 5.97 7.78 0.82 2 0.41 334.69 50.43
B 6.86 6.10 5.42 0.17 2 0.085 69.39 10.34
C 6.25 6.28 5.86 0.02 2 0.01 8.16 1.08
D 4.89 5.86 18.39 0.6 2 0.3 244.89 36.86
e 0.011 9 0.00123 1.00 1.29
T 22.65 24.21 37.45 1.62 17 100
Figure 11. Influence of frictional pressure on equivalent stress.
The bulk deformation increased with increase of frictional and forging pressures as shown in figure in the frictional pressure and frictional time as shown in figure 11 & 12.
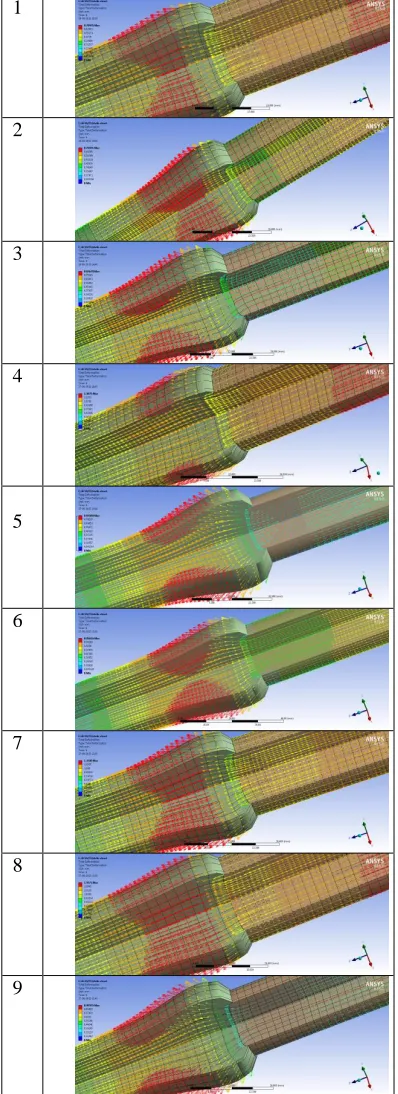
[image:5.612.53.288.385.648.2]The deformation was found to decrease with increase of frictional time as shown in figure 13. In the first numerical iteration the external load would generate uniform pressure on the contact surface and consequently linearly changing heat flux. For the next iteration the pressure distribution on contact surface was calculated Using ANSYS workbench. It was observed that the deformation concentrates mainly near the frictional surface. The extruded shape gradually was formed near the welded joint during the welding process. The extruded shape was asymmetric, as shown in figure 14. The tendency of flange formation was higher with AA7020 than with Zr705 alloy. This was due to difference in the thermal conductivity and thermal expansion of the two materials. The bulk deformation was found to be maximum (1.557 mm) with conditions of trial 9; whereas it was 0.709 mm with the trial 1 as shown in figure 14. The axial shortening on the AA7020 side was more than that on Zr705 alloy side. Consequently, the material was moved outward forming the flange at the interface. The outward movement of AA7020 was higher than that of Zr705 alloy in proportion to their stiffness characteristics. The elastic module of AA7020 and Zr705 are, respectively, 71.0 GPa and 97.9 GPa. In both the materials the compressive stresses were observed. Thus, the AA7020 material has experienced weld flash at the interface. This is also due to the fact that melting point of AA7020 is lower than that of Zr705 alloy.
[image:5.612.347.530.445.561.2]Figure 12. Influence of forging pressure on equivalent stress.
[image:5.612.354.528.588.695.2]International Journal of Emerging Technology and Advanced Engineering
Website: www.ijetae.com (ISSN 2250-2459, ISO 9001:2008 Certified Journal, Volume 6, Issue 2, February 2016)
45
1
2
3
4
5
6
7
8
[image:6.612.308.580.136.561.2]9
Figure 14. Bulk deformation values under different trials.
Penetration, mm Sliding, mm
1
2
3
4
5
6
7
8
[image:6.612.71.270.138.685.2]9
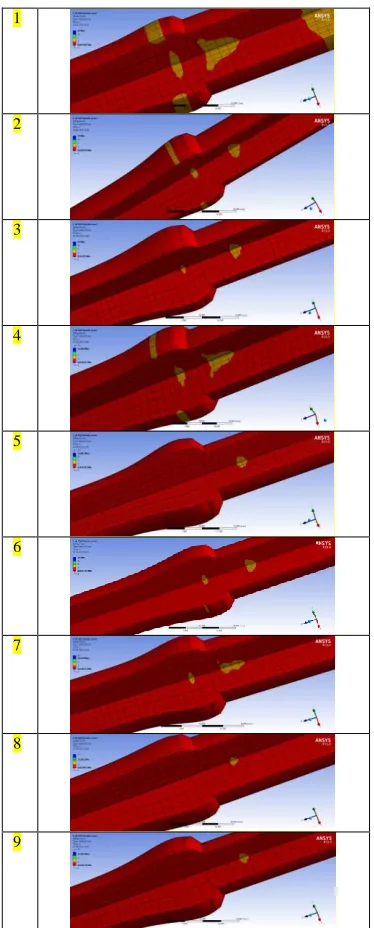
Figure 15. Penetration and sliding values under different trials.
D. Influence of Parameters on Penetration and Sliding
International Journal of Emerging Technology and Advanced Engineering
Website: www.ijetae.com (ISSN 2250-2459, ISO 9001:2008 Certified Journal, Volume 6, Issue 2, February 2016)
46
In the case of trail 7 and 9 the interface layer has produced a good metallic bond between AA7020-T6 and Zr705 alloy on account of deep penetration (figure 15). In trail 8 also a good penetration was observed. A closer look at the penetration and sliding images shows that the failure of good bonding has taken place largely by interface separation. Inconsistency of the weld results, were encountered with this combination of materials. One factor may be an uneven rate of heat generation.
1
2
3
4
5
6
7
8
[image:7.612.77.264.241.705.2]9
Figure 16. Safety factor of joints.
The safety factor was affected by the welding parameters. The safety factor was 0.064 for trial 1 conditions and it was least of 0.17 for trial conditions as shown in figure 16.
IV. CONCLUSIONS
This study shows that the AA7020-T6 and Zr705alloy is good if the operating conditions: frictional pressure of 35 MPa, frictional time of 4 sec, rotational speed of 1500 rpm and forging pressure of 31.25 MPa. For friction welding of AA7020-T6 and Zr705alloy, the forging pressure should be less than the frictional pressure or equal. For this condition of welding there was good penetration and sliding of materials at the welding interface resulting a good mechanical bonding. It is also recommended that the welded parts must be stress relieved using appropriate heat treatment process.
REFERENCES
[1] Milton, B. H., Stamford,. McKinley, W. E., Springdale, and Joseph, C. J. C., Norwalk and Conn. 1967. Friction Welding, USS 3,323,203, Patented.
[2] Li, W. and Wang, F. 2011. Modeling of continuous drive friction welding of mild steel. Materials Science and Engineering A, 528:5921-5926.
[3] Reddy, A. C. 2015. Fatigue Life Evaluation of Joint Designs for Friction Welding of Mild Steel and Austenite Stainless Steel. International Journal of Science and Research, 4(2): 1714-1719. [4] Reddy, A. C. 2015. Fatigue Life Prediction of Different Joint Designs
for Friction Welding of 1050 Mild Steel and 1050 Aluminum. International Journal of Scientific & Engineering Research, 6(4): 408-412.
[5] Srija, V. and Reddy, A. C. 2015. Finite Element Analysis of Friction Welding Process for 2024Al Alloy and UNS C23000 Brass. International Journal of Science and Research, 4(5): 1685-1690.
[6] Kumar, T.S. and Reddy, A. C. 2015. Finite Element Analysis of Friction Welding Process for 2024Al Alloy and AISI 1021 Steel. International Journal of Science and Research, 4(5):1679-1684. [7] Raviteja, A. and Reddy, A. C. 2015. Finite Element Analysis of
Friction Welding Process for UNS C23000 Brass and AISI 1021 Steel, International Journal of Science and Research, 4(5):1691-1696. [8] Reddy, A. C. 2015. Finite Element Analysis of Friction Welding
Process for AA7020-T6 and Ti-6Al-4V Alloy: Experimental Validation. International Journal of Science and Research, 4(8):947-952.
[9] Chennakesava R Alavala. 2016. Evaluation of parametric significance in friction welding process for AA2024 and Zr705 alloy using finite element analysis, International Journal of Engineering Research & Technology, 5(1): 84-89.
[10] Reddy, A. C. 2011.Analysis of welding distortion in seam and skip arc weldings using finite element method. International Journal of Mechanical Engineering Research & Development, 1(1):12-18. [11] Chennakesava R Alavala. 2008. Finite Element Methods: basic