International Journal of Emerging Technology and Advanced Engineering
Website: www.ijetae.com (ISSN 2250-2459, ISO 9001:2008 Certified Journal, Volume 5, Issue 5, May 2015)
410
An Application of Wavelet Transform and Artificial Neural
Network for Microarray Gene Expression based Brain Tumor
Sub-classification.
Supriya Patil
1,
G. M. Naik
2, K. R. Pai
31Research Scholar, 2 Professor and HOD, Electronics Dept., Goa University, India 3 Professor and HOD, ETC Dept., P. C. Engineering College, India
Abstract—Classification of tumor subtype is a critical issue in tumor diagnosis and treatment. A correct identification of tumor subtype enables appropriate treatment and leads to faster recovery of the patient. Conventional methods of tumor sub-classification largely depend on the physician’s knowledge and experience. The main intension of proposed method is to automate the customized approach of tumor sub-classification using DWT and ANN.
Keywords— Artificial Neural Network (ANN), Complementary DNA (cDNA), Discrete Cosine Transform (DCT), Discrete Wavelet Transform (DWT), Messenger
RNA(mRNA),Resilient Back Propagation Algorithm
(RPROP).
I. INTRODUCTION
Cancer is the uncontrolled growth of abnormal cells anywhere in biological body, caused by a series of mutations in genes [1]. There are number of types of cancers and every cancer has number of sub-types. Current morphological and clinical approaches that aim to sub-classify are not sufficient to identify all sub types of cancer. The cancer with same morphological image might respond diversely to same treatment. Therefore for the correct treatment identifying the cancer sub- type highly rely on the experience of the physician [1] [2].
Microarray technology helps in automation of cancer sub-classification. It is cutting edge technology in bioinformatics to monitor the expression levels of thousands of genes simultaneously [2] [3]. Microarrays applications vary from cancer diagnosis to human identification [4].Microarrays are predicted to be a normal diagnostic method in future much like today’s blood test [2].
The organization of paper is as follows: Section II shows the brain tumour classification, a brief review of microarray experiment is given in section III, followed by classification of brain tumor in section IV, section V shows system block diagram and details of feature extraction and classifier, section VI shows the result of classification.
II. BRAIN TUMOR CLASSIFICATION
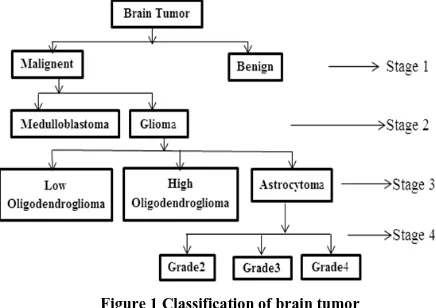
Basically there are hundreds of types of cancers and every type of cancer has number of subtypes. The classification of brain tumour taking into account the frequency of appearance of cancer subtype is as shown in figure(1).
[image:1.612.329.547.334.488.2]
Figure 1 Classification of brain tumor
III. MICROARRAY EXPERIMENT
Microarray technology has three crucial steps: microarray experiment, image processing and data analysis [3].
In microarray experiment first the mRNA is extracted from the normal cell and the cancerous cell. The mRNA is then converted into cDNA and labelled with different dyes (red, green).Following this step cDNA is hybridized onto microarray slide. The microarray slide is then excited with laser at suitable wavelength to detect red and green dyes. The final microarray image is stored as a file for further processing. The microarray image consists of thousands of spots. Each spot contains many copies of the same DNA sequence that uniquely represents a gene [3].
International Journal of Emerging Technology and Advanced Engineering
Website: www.ijetae.com (ISSN 2250-2459, ISO 9001:2008 Certified Journal, Volume 5, Issue 5, May 2015)
411 Therefore microarray image requires further processing before using it for cancer sub-classification. The major steps in microarray image processing are de-noising, gridding, segmentation and quantification.
The result of microarray image processing is microarray gene expression data. Every column of the data represents one sample and the row represents the ratio of intensity of red spot to green spot for a particular gene.
[image:2.612.72.267.237.308.2]IV. SYSTEM BLOCK DIAGRAM
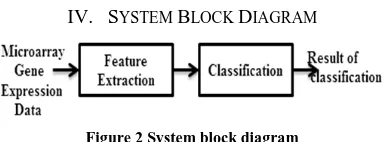
Figure 2 System block diagram
The system block diagram is as shown in figure (2). Microarray data have very high dimension. It is required to reduce the size of Microarray data before classification. Reduction in the Microarray data size is performed with the help of feature extraction techniques like DCT and DWT. The classification is performed using ANN.
3.1 Discrete Cosine Transform
Discrete cosine transform (DCT) is a function that maps the input signal from spatial domain to frequency domain. DCT transforms the input into linear combinations of weighted basis functions. These basis functions are the frequency component of the input data. They can be used for the feature extraction. DCT is known to be close to optimal in terms of its energy compaction capabilities.
The transform equation for DCT of a signal is given by formula:
For u=0,1,2,.,N-1.
Where
α(u)=1/√N for u=0
= √2/N for u=1…N-1
3.2 Discrete wavelet transform
Wavelet transform is one of the advanced techniques for feature extraction. It offers number of advantages like providing time and frequency information of the signal simultaneously, multi resolution analysis, inherent scaling, higher compression ratio etc. In the case of DWT, a time scale representation of the digital signal is obtained using digital filtering techniques.
There are many types of wavelets that are application specific: Haar, Daubechies, Coiflets, Symlets, Meyer, Mexican Hat etc. Every wavelet has two sets of related functions scaling function and wavelet function.
The DWT is computed by successive low pass and high pass filtering of the discrete time-domain signal. At each level the result of dyadic decimation of filtered data
produces two sets of coefficients: approximation
coefficients and detail coefficients. Approximation
coefficients represent the low frequency part of signal while as detailed coefficients represent the high frequency part of signal.
The DWT process is as shown in figure(3)
Figure 3 DWT process
The approximation coefficients sj(k) and detailed coefficients dj(t) are given as below:
and
.
Where
h(n) = low pass filter. g(n) = high pass filter
j = level of decomposition k = translation parameter.
The detailed coefficients do not contain useful information for classification. Hence detailed coefficients can be discarded. The approximation coefficients can be used for the purpose of classification.
3.3 Artificial Neural Network
International Journal of Emerging Technology and Advanced Engineering
Website: www.ijetae.com (ISSN 2250-2459, ISO 9001:2008 Certified Journal, Volume 5, Issue 5, May 2015)
412 It causes significant error in weight update formula especially for high values of inputs. The purpose of the resilient back propagation (Rprop) training algorithm is to eliminate the harmful effects of the magnitudes of the partial derivatives of error. It uses only the sign of the derivative to determine the direction of the weight update; the magnitude of the derivative has no effect on the weight
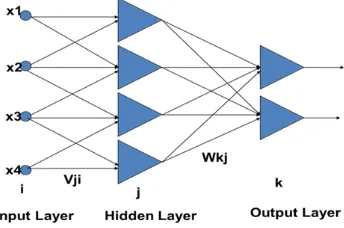
update. The network architecture for Resilient back
propagation algorithm is as shown in figure(4).
Figure 4 Neural network architecture.
The size of the weight change is determined by a separate update value. The update value for each weight and bias is increased by a factor delt_inc whenever the derivative of the performance function with respect to that weight has the same sign for two successive iterations. The update value is decreased by a factor delt_dec whenever the derivative with respect to that weight changes sign from the previous iteration. If the derivative is zero, the update value remains the same. Whenever the weights are oscillating, the weight change is reduced. If the weight continues to change in the same direction for several iterations, the magnitude of the weight change increases.
The Resilent back propagation algorithm is as shown in figure(5).
For all the weights and biases
{
If then
{
Δkj(t)=
minimum(
Δkj(t-1)*η+,
Δmax)
Δwkj(t)
= -
sgn Δkj(t)Δwkj(t+1)
=
wkj(t)+ Δwkj(t)}
else if then
{
Δkj(t) = maximum(Δkj(t-1)*η-, Δmin)Δwkj(t+1) = wkj(t) - Δwkj(t-1)
}
else if then
{
Δwkj(t) = - sgn Δkj(t)Δwkj(t+1) = wkj(t)+ Δwkj(t)
[image:3.612.319.535.136.564.2]}
}
Figure 5 Resilient Back Propagation Algorithm
Where 0 < η- < 1 < η+ Typically η+= 1.2, η-= 0.5,
Δkj= size of update = 0.1 initially, Δmin= 1e-6, Δmax= 1
,
Δkj(t)=η+*Δkj(t-1) ; if=
η-*Δkj(t-1);
if=
Δkj(t-1) ; elseV. IMPLEMENTATION
[image:3.612.73.245.246.360.2]International Journal of Emerging Technology and Advanced Engineering
Website: www.ijetae.com (ISSN 2250-2459, ISO 9001:2008 Certified Journal, Volume 5, Issue 5, May 2015)
413 VI. RESULT
TABLEI
Malignant and Benign Tumour: For 10 hidden nodes
Feature Extraction
Wavelet name
level Accuracy
Wavelet Transform
Db2 3,5,7,9, 11,13,16
100%
Db4 3,5,7,9, 11,13,16
100%
Sym2 3,5,7,9, 11,13,16
100%
Sym4 3,5,7,9, 11,13,16
100%
Bior1.3 3,5,7,9, 11,13,16
100%
Bior2.4 3,5,7,9, 11,13,16
100%
Discrete Cosine Transform 100%
TABLEII
Glioma, Lymphoma: For 10 hidden nodes
Feature Extraction
Wavelet name
level Accuracy
Wavelet Transform
Db2 3,5,7,9, 11,13,16
100%
Db4 3,5,7,9, 11,13,16
100%
Sym2 3,5,7,9, 11,13,16
100%
Sym4 3,5,7,9, 11,13,16
100%
Bior1.3 3,5,7,9, 11,13,16
100%
Bior2.4 3,5,7,9, 11,13,16
100%
Discrete Cosine Transform 97%
TABLEIII
Astrocytoma, Oligodendroglioma high grade, Oligodendroglioma low grade: at level 1
Feature Extraction Wavelet name No. of Hidden Nodes Accuracy Wavelet Transform
Db2 9 80%
Db4 30 89% Sym2 9 80% Sym4 8 63% Bior1.3 19 71% Bior2.4 21 74% Discrete Cosine Transform 65%
TABLEIV
Astrocytoma (Grade2,Grade3,Grade4): at level 1
Feature Extraction Wavelet name No. of Hidden Nodes Accuracy Wavelet Transform
Db2 8 68%
Db4 17 65%
Sym2 8 68%
Sym4 16 70%
Bior1.3 10 70% Bior2.4 8 60% Discrete Cosine Transform 37%
VII. CONCLUSION
At stage 1 and stage 2 of classification the difference in the intensity values of the signal is very large. Hence very few wavelet coefficients can be used to get to 100% classification accuracy. While as at stage 3 and stage 4 of classification the difference in the intensity values of the signal is very small. Hence classification becomes very difficult even after using large number of wavelet coefficients. DWT performs better than DCT due to the custom made filters and higher compression ratio.
REFERENCES
[1] Z. Zainuddin, O. Pauline, “Improved Wavelet Neural Network for Early Diagnosis of Cancer Patients Using Microarray Gene Expression Data”, Proc. IEEE. Int. Joint. Conf. Neural Network ,U.S.A, Pp. 3485-92, June 2009.
[2] X. Y. Zhang, F. Chen, Y. Zhang, S. C. Anger, M Akay, Z. Lu, M. M. Y. Waye and S. K. Tsui, “Signal Processing Techniques In Genomic Engineering”, Proc. IEEE, Vol. 90, No. 12, Pp.1822-33, Dec. 2002.
[3] X. H. Wang, Robert S. H. Istepanian and Y. H. Song ,”Microarray Image Enhancement by De-noising Using SWT” , IEEE Transactions on nano-bioscience, Vol. 2 , No. 4, Pp. 184-189, Dec. 2003.
[4] I. A. Fouad, F. Labib, A. Sharawy, M. Mabrouk, “Developing a New Methodology for De-noising and Gridding cDNA Microarray Images”, IEEE Cairo Int. Biomed. Engg. Conf., Egypt, Pp. 142-145 Dec.2012.
[5] ]http://learn.genetics.utah.edu/content/labs/microarray/ [6] www.ncbi.nih.gov.in,
[7] A. Daskalakis , D. Gavouras, P. Bougioukos and G. Nikiforidis , “Improving Gene Quantification by Adjustable Spot Image Restoration”, Bioinformatics, Vol. 23, No. 17, Pp.2265-72, 2007. [8] Inza. I., Larranaga P. Blanco R,.Cerrolaza A.J., “Filter versus
International Journal of Emerging Technology and Advanced Engineering
Website: www.ijetae.com (ISSN 2250-2459, ISO 9001:2008 Certified Journal, Volume 5, Issue 5, May 2015)
414 [9] C.H. Ooi and P. Tan, “Genetic algorithms applied to multi-class
prediction for the analysis of gene expression data,” Bioinformatics, Oxford University Press, Oxford, 2003, 19(1), Pp. 37-44.
[10] Li, J., Zhang, C. and Olihara, M., “A comparative study of feature selection and multiclass classification methods for tissue classification based on gene expression”, Bioinformatics, Oxford University Press, Oxford, 2004, 20(15), Pp. 2429-2437.
[11] Li. Jiangeng, D. Yanhua, R. Xiaogang, “A Novel Hybrid Approach to Selecting Marker Genes for Cancer Classification Using Gene Expression Data”, IEEE Conf. ,Pp. 264-267,2007
[12] S. Li, C. Liao, J. Kwok, “Wavelet Based Feature Extraction for Microarray Data Classification”, IEEE Int. Conf. on Neural Network, Canada, Pp.5028-5033, July 2006.
[13] A. M. Sarhan, “Cancer Classification Based On Microarray Gene Expression Data Using DCT And ANN”, Journal of Theoretical and Applied Information Technology Pp.208-216,2005-2009.
[14] V. Kumar, J. Sachdeva, I. Gupta, N. Khandelwal, C.K. Ahuja, “Classification Of Brain Tumors Using PCA-ANN”, IEEE World Congress on Information and Communication Technologies, Pp.1079-1083,2011.
[15] Martin Riedmiller Heinrich Braun, Institut fur Logik, Komplexitat und Deduktionssyteme ,“A Direct Adaptive Method for Faster Backpropagation Learning:The RPROP Algorithm” ,1993 IEEE. [16] Supriya Patil, G. M. Naik, K. R. Pai, “ Survey of Microarray Data
Processing for Cancer Sub- Classification”,International Journal of Emerging Technology and Advanced Engineering, Pp.110-113,February 2014.