International Journal of Emerging Technology and Advanced Engineering
Website: www.ijetae.com (ISSN 2250-2459,ISO 9001:2008 Certified Journal, Volume 4, Issue 3, March 2014)
129
Object Detection Using Probabilistic Graph Model
Gajendra Singh Chandel
1, Ravi Singh
2Abstract-- We propose a Probabilistic Graph based Model for interactive image segmentation. A multilayer
probabilistic Graph is constructed from an
oversegmentation of the image to model the relationships among super pixel regions, edge segments and vertices. We used an iterative procedure to merge several regions based on the probability of the regions. Regions are merged until the user is satisfied with the segmentation. Each node’s probability is updated after each iteration. With the help of proper user intervention the input image is segmented in short time period. We evaluate the proposed model on many images in the database. The results demonstrate that the Graphical model can be used for interactive image segmentation (IS). The results also shows that the proposed method has good accuracy and efficiency for both segmenting the image and extraction of the object from the segmented image.
Index Terms- Graphical Model, interactive image segmentation (IS), image segmentation, region merging.
I. INTRODUCTION
Image segmentation is an important subject in the field of image processing and computer vision. It still remains as a challenge when the image involves complex natural scenes. Great efforts have been made to develop more advanced techniques in recent years. The process of partitioning a digital image into multiple regions or sets of homogeneous pixels is called image segmentation. Actually, partitions are different objects in image which have the same texture or colour. The result of image segmentation is a set of regions that collectively cover the entire image, or a set of contours extracted from the image. All the pixels in a region are similar with respect to some characteristics or computed property, such as colour, intensity, or texture. Adjacent regions are significantly different with respect to the same characteristics. This technique has a variety of applications including computer vision, image analysis, medical image processing, remote sensing and geographical information system. Image segmentation is based on two basic properties, first intensity values involving discontinuity that means sudden or abrupt changes in intensity as edges and second similarity that means partitioning a digital image into regions according to some pre-defined likeness criterion. Many approaches have been proposed earlier which includes region growing [1], normalized cuts [2], clustering [3], grab-cut method [4], active contours [5], and MRF (Markov Random Field) based approaches [6] etc. All these approaches are data driven approaches.
The data driven approaches may not produce satisfactory results in segmentation when there are shadow, low contrast areas, occlusion, cluttering and noise present in the image. When these things are present in the image than prior knowledge is very necessary for segmenting the given image for producing satisfactory results. These methods incorporate the prior information in a deterministic manner, ignoring various uncertainties associated in the image segmentation process and making very difficult to take user‟s intervention into the segmentation process. There are two basic types of graphical models: the undirected graphical model and the directed acyclic graphical model. The undirected graphical model can represent noncasual relationships among the random variables [7]. MRF models have been widely used for image segmentation. They incorporate the spatial relationships among neighbouring labels as a Markovian prior. This prior can encourage the adjacent pixels to be classified into the same group. As an extension to MRFs, the Conditional Random Field (CRF) [8] is another type of undirected graphical model that has become increasingly popular. While both MRF and CRF models can effectively capture noncasual relationships they cannot model the directed relationships. This problem can be solved by another type of graphical model, i.e., the directed acyclic graphical model such as Bayesian Network (BN) [9] [10].
The automatic segmentation approaches may also fail even though they use prior information in segmentation process. The main reason behind this is the complexity of segmentation of image in real applications. The complexity is due to the several reasons like shadow, low contrast areas, occlusion, cluttering and noise in the image. These reasons make the segmentation process quite difficult and challenging. The use of interactive image segmentation process is the solutions of such problems. In the interactive image segmentation the proper user‟s intervention is required for segmentation process. Because user gives the clue for segmenting the image in the process the results are more improved and satisfactory. We develop a graphical model for segmentation that can incorporate various probabilistic relationships and apply it to the segmentation problem. Our model captures the natural causal relationships among three entities in image segmentation: regions, edges, and vertices (i.e., the junctions).
International Journal of Emerging Technology and Advanced Engineering
Website: www.ijetae.com (ISSN 2250-2459,ISO 9001:2008 Certified Journal, Volume 4, Issue 3, March 2014)
130
However, these approaches mainly exploit a limited type of user interventions. The user typically gives hard constraints by fixing the labels of certain pixels or group of pixels, without considering the uncertainties in the user‟s intervention. Other types of user‟s interventions are rarely used in these works.II. RELATED WORK
Eric N. Mortensen and Jin Jia [15] proposed a BN model with two layers for image segmentation, which captures the relationships between edge segments and their vertices. Given a user input seed path, they use minimum path spanning tree (MPST) graph search to find the most likely object boundaries. They also encode statistical similarity measure between the adjacent regions of an edge into its a priori probability therefore implicitly integrating region information.
In the early study [16] they use the similar BN model for both automatic and interactive segmentation. Their approach can find multiple non-overlapping closed contours before any given user‟s intervention. The intervention will serve as an evidence to help select a single closed contour that covers the object of interest.
Lei Zhang, Zhi Zeng, and Qiang Ji [17] proposed a method to extend the Chain Graph (CG) model. CG is a hybrid Probabilistic Graphical Model (PGM) which Contains both directed and undirected links. Its representation is powerful enough to capture heterogeneous relationships among image entities. For CG they first oversegment the image into superpixels and find out different heterogeneous relationships among image entities (superpixels, vertices or junctions, edges, regions etc.) They construct the CG model with parameterized links with derived Joint Probability Distribution (JPD). These links are represented by either potential function or conditional probabilities.They first create a Directed Master Graph then create undirected sub-graphs for some terms in the JPD of Directed Master Graph. They segment the image into two parts foreground and background. In the end they apply probabilistic inference in the foreground to find out most probable explanation.
Kittipat Kampa, Duangmanee Putthividhya and Jose C. Principe [18] design a probabilistic unsupervised method called Irregular Tree Structure Bayesian Network (ITSBN). The ITSBN is constructed according to the similarity of image regions in an input image. ITSBN is a Directed acyclic graph (DAG) with two disjoint sets of random variables hidden and observed. The original image is oversegmented in multiscale hierarchical manner then they extract features from the input image corresponding to each superpixel. According to these superpixels ITSBN is built for each level. After applying the learning and inference algorithms the segmented image is produced.
Fei Liu, Dongxiang Xu, Chun Yuan and William Kerwin [19] combined the BN (Bayesian Network) and MRF (Markov Random Field) to form an image segmentation approach. The BN generates a probability map for each pixel in the image and then MRF prior is incorporated to produce the segmentation. It is an interactive image segmentation method. First each pixel will be individually assigned a probability value to be each given class. According to such probability map, BN provides a mechanism to convert the problem from feature space to image domain and they consider the prior knowledge on the image model and the spatial relationships between pixels, they use MRF based model to produce the segmentation results.
Costas Panagiotakis, Ilias Grinias, and Georgios Tziritas [20] proposed a framework for image segmentation which uses feature extraction and clustering in the feature space followed by flooding and region merging techniques in the spatial domain, based on the computed features of classes. They use a new block-based unsupervised clustering method which ensures spatial coherence using an efficient hierarchical tree equipartition algorithm. They divide the image into different-different blocks based on the feature description computation. The image is partitioned using minimum spanning tree relationship and mallows distance. Then they apply K-centroid clustering algorithm and Bhattacharya distance and compute the posteriori distributions and distances and perform initial labelling. Priority multiclass flooding algorithm is applied and in the end regions are merged so that segmentation results are produced.
III. PROPOSED FRAMEWORK
For interactive image segmentation, we need a model that can conveniently take the user‟s intervention and according to the user intervention it produces the segmentation result. We propose a Graphical Model based on the regions (superpixels), edges, vertices (junctions) and the relationships between these image entities for interactive image segmentation.
We start from the top left corner of the image and take the first pixel from each region. The pixel represents that whole region. Now we find out the connectivity of regions to each other. We take the first pixel and check for the connected regions and the first pixels of those regions. Now we connect all the pixels to each other.
International Journal of Emerging Technology and Advanced Engineering
Website: www.ijetae.com (ISSN 2250-2459,ISO 9001:2008 Certified Journal, Volume 4, Issue 3, March 2014)
131
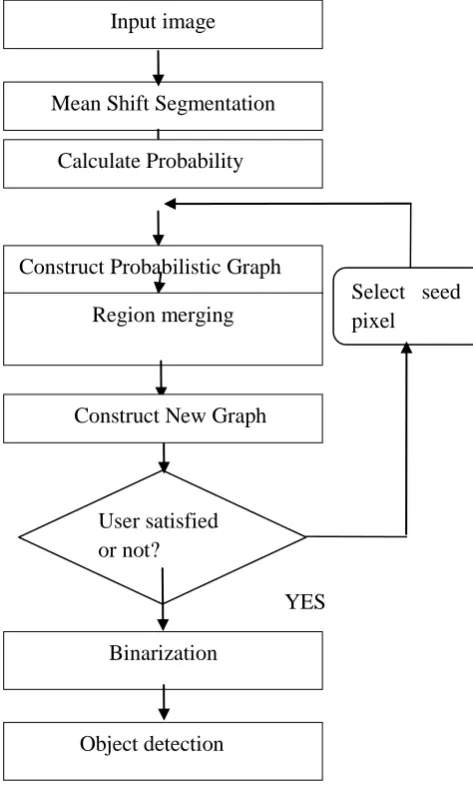
Here we calculate the probability of each region for merging with the other regions on the basis of colour histogram. We use an iterative and interactive approach for the segmentation of the image. User start the process and the model starts merging the regions, at the same time graph is generated to show the connectivity of the regions and the probability of regions to merging with the other regions.NO
[image:3.595.46.283.232.626.2]YES
Fig. 4.1 Flowchart Probabilistic Graph Model
After first iteration some regions that are most probable merged with each other and results a new graph with less regions and fewer pixels and connectivity. Probability is calculated for each iteration. The calculated probability is the probability of the pixel to merge with other pixels in the graph. This process continues until the user is satisfied or there are no region remains in the image. Once the user is satisfied it can stop the process.
The final segmentation result is obtained by the user intervention. The user can also interact with the final segmented image to extract the object of interest from the image.
IV. MAGE SEGMENTATION FAMEWORK
4.1 Constructing Superpixels
We use the Graphical Model as the basic framework for image segmentation. We construct the Graphical model from an oversegmentation of the image. The edge map in the oversegmentation consists of superpixel regions.
Fig.2.(a) Original Image Fig.2(b) Oversegmentation of image
If I is set of all image pixels, then by applying segmentation we get different unique regions like
{ R1, R2, R3,…, Rn } which when combined formed
„I‟. Basic formulation is as follows:
(a)
n∪
R
i = I where Ri ∩ Rj = ∅i=1,n
(b)
Ri is a connected region, i=1, 2….n.(c)
P(Ri) = TRUE for i=1, 2.. n.(d)
P(Ri∪ Rj ) = FALSE for i ≠ j.Where P(Ri) is a logical predicate defined over the
points in set Ri.
Condition (a) indicates that segmentation must be complete; every pixel in the image must be covered by segmented regions. Segmented regions must be disjoint. Condition (b) requires that points in a region be connected in some predefined sense like 4-neighbourhood or 8-neighbourhood connectivity. Condition (c) deals, the properties must be satisfied by the pixels in a segmented region e.g. P(Ri) = TRUE if all
pixels in Ri have the same gray level. Last condition (d)
indicates that adjacent regions Ri and Rj are different in
the sense of predicate P.
Mean Shift Segmentation
Calculate Probability
Construct Probabilistic Graph
Region merging
User satisfied
or not?
Binarization
Construct New Graph
Input image
Object detection
International Journal of Emerging Technology and Advanced Engineering
Website: www.ijetae.com (ISSN 2250-2459,ISO 9001:2008 Certified Journal, Volume 4, Issue 3, March 2014)
132
4.2 Graph Construction
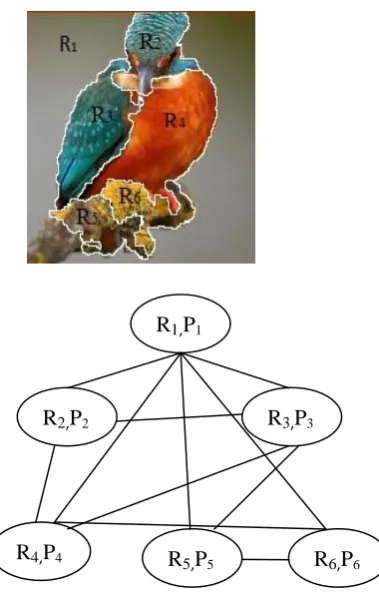
We construct the graph corresponding to the segmented image which represents the relationship between the different image regions. An edge in the graph shows the connectivity of the regions to each other. Here R1, R2, R3, R4, R5 and R6 are the regions in the
segmented image and P1, P2, P3, P4, P5 and P6 are the
corresponding probabilities.
Region R1 is connected to R2 and R3, R2 is connected
to R4 and R5, R3 is connected to R4 and R6 and R4 and R5
are connected to each other. The probability corresponding to the region is the probability of merging with the other smaller regions.
[image:4.595.86.276.287.586.2]
Fig.3. Graph corresponding to given figure.
4.3 Probability Calcuation
Let V = {R1, . . . ,Rn} be a set of all regions and P(V)
denote the joint probability distribution over V.
Using the Fundamental Rule, P(V) can be written as
P(V) =
1 1
1
( | ,..., )
n
i i
i
P R R R
Thus, any region can be
represented as a product of conditionals, e.g., P(R1,R2,R3)=P(R3|R1,R2)P(R2,R1) = P(R3 |R1,R2)P(R2 |R1)P(R1)
4.4 Region Merging
We have many small regions available in the edge map. A region can be described in many aspects, such as the colour, edge [23], texture [24], shape and size of the region. Among them the colour histogram is an effective descriptor to represent the object colour feature statistics and it is widely used in pattern recognition [25] and object tracking [26] etc. Colour histogram is more robust than the other feature descriptors. This is because the initially segmented small regions of the desired object often vary a lot in size and shape, while the colours of different regions from the same object will have high similarity. Therefore, we use the colour histogram to represent each region. The RGB colour space is used to compute the colour histogram. We uniformly quantize each colour channel into16 levels and then the histogram of each region is calculated in the feature space of 16×16×16 = 4096 bins.
Fig. 4. Regions in the Image
[image:4.595.384.479.350.453.2]Here we choose to use the Bhattacharyya coefficient [25, 26, 27] to measure the similarity between R1and R2.
1 2
4096
1, 2 1
(
)
uR.
uR uR R
Hist Hist
Where HistR1 and HistR2 are the normalized histograms
of R1 and R2, respectively, and the superscript u
represents the uth element of them. Here ρ is the Bhattacharyya coefficient. The higher the Bhattacharyya coefficient between R1 and R2 , the higher the similarity
between them.
4.5 Constructing Mask
Once the regions are merged and the image with desired segments are generated we construct the mask of the image for extracting object of interest from it. For constructing the mask of the segmented image we convert it into the gray scale image. In the segmented gray scale image we assign value 255 to the pixels at the boundaries and 0 to the rest of the pixels in the image. This constructs the mask of the image.
R
1,P1
R
2,P2
R
3,P3
R
6,P6
International Journal of Emerging Technology and Advanced Engineering
Website: www.ijetae.com (ISSN 2250-2459,ISO 9001:2008 Certified Journal, Volume 4, Issue 3, March 2014)
133
4.6 Binarization Of Object Contour
Once the regions are merged and the image with desired segments are generated we construct the mask of the image for extracting object of interest from it. For constructing the mask of the segmented image we convert it into the gray scale image.
(a)Input image (b) Grey Scale image
(c) Image Mask
4.6 Object Extraction
For extraction of object of interest from the segmented image we use the mask and Boundary Fill algorithm. The object extraction from the image is also interactive. The user clicks on the desired region in the image. On the basis of the user click and the mask of the image the region‟s pixel‟s value set to the colour value in the image and the rest of the part of the image pixel‟s values are set to 0.
V. RESULT AND ANALYSIS
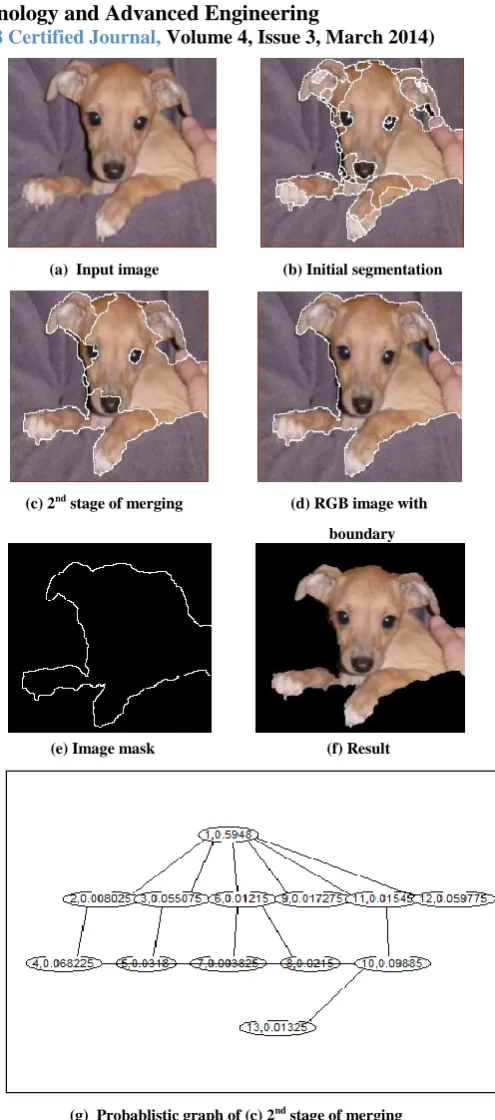
In order to examine this algorithm, the experimental results were under the software environment of Matlab 7.5.We tested the proposed model on several images in the database. The database includes many images of birds, horses and aeroplanes that have different appearances and poses and background includes more different kinds of scenes, which makes it challenging to segment these images. All of the images are first oversegmented using the mean shift method [28]. After the oversegmentation of image we construct the graph and find the probability. Then we perform similarity region merging to merge the regions on the basis of colour.
(a) Input image (b) Initial segmentation
(c) 2nd stage of merging (d) RGB image with
boundary
(e) Image mask (f) Result
[image:5.595.313.561.105.666.2](g) Probablistic graph of (c) 2nd stage of merging
International Journal of Emerging Technology and Advanced Engineering
Website: www.ijetae.com (ISSN 2250-2459,ISO 9001:2008 Certified Journal, Volume 4, Issue 3, March 2014)
134
(a) Input image (b) Result by Grabcut
(c) Result by Probabilistic Graph
Fig.4. Comparisons between the grabcut method and proposed method. First column: Inputimage; Second column: result produced by grabcut method; third column: Result produced by our method.
Our method is very simple as compared to the other existing methods of segmentation. The method is less time consuming and produced results quickly. Because it is interactive method so the time taken in the segmentation is totally depend on the user and input image. The segmentation speed mainly depends on the complexity of the constructed graphical model. Object extraction time is totally depending on the size of the object. We achieved encouraging results on these images. As to the images with small changes or similar colour of foreground and background, our algorithm will fail to achieve an ideal segmentation effect. Another kind of error is caused by the clutter. When the background (e.g., the shadow) has a similar appearance as the foreground, the proposed model may not be able to completely separate them.
VI. CONCLUSION
To summarize, we present a new interactive image segmentation framework based on a probabilistic graphical model. The proposed graphical model can systematically capture the relationships among different image regions to perform effective image segmentation. An image is first oversegmented to produce an edge map, from which a superpixel-based Graphical Model is constructed. Probability is calculated for each node present in the graph.
The model performs region-merging based on the colour histogram of the image. After region merging the new graph is constructed and new probability is calculated for each node in the graph. Maximum probability of a node shows that the region will be merged to other smaller regions present in the image and results in a bigger region. It is an iterative procedure and number of iterations depends on the user satisfaction. Finally, we want to point out that the application of the graphical model is not limited to image segmentation. It can find applications in many different computer vision problems including object tracking, object recognition etc. Our experimental results demonstrate the promising capability of the proposed Graphical model for effective interactive image segmentation
.
REFERENCES
[1] L. Vincent and P. Soille, “Watersheds in digital spaces: An efficient algorithm based on immersion simulations,” IEEE Trans. Pattern Anal. vol. 13, no. 6, pp. 583–598, Jun 1991.
[2] J. Shi and J. Malik, “Normalized cuts and image segmentation,” IEEE Trans. Pattern Anal. Mach. Intell., vol. 22, no. 8, pp. 888– 905, Aug. 2000.
[3] D. Comaniciu and P. Meer, “Mean shift: A robust approach toward feature space analysis,” IEEE Trans. Pattern Anal. Mach. Intell., vol. 24, no. 5, pp. 603–619, May 2002.
[4] Y. Boykov and M.-P. Jolly, “Interactive graph cuts for optimal boundary and region segmentation of objects in N-D images,” in Int.Conf. Comput. Vis., 2001, vol. 1, pp. 105–112.
[5] V. Caselles, R. Kimmel, and G. Sapiro, “Geodesic active contours,” Int. J. Comput. Vis., vol. 22, no. 1, pp. 61–79, Feb. 1997.
[6] S. Geman and D. Geman, “Stochastic relaxation, Gibbs distributions, and the Bayesian restoration of images,” IEEE Trans. Pattern Anal. Mach. Intell., vol. PAMI-6, no. 6, no. 6, pp. 721–741, Nov. 1984.
[7] L. Zhang and Q. Ji, “Image segmentation with a unified graphical model,” IEEE Trans. Pattern Anal. Mach Intell., vol. 32, no. 8, pp. 1406–1425, Aug. 2010.
[8] J. Lafferty, A. McCallum, and F. Pereira, “Conditional Random Fields: Probabilistic Models for Segmenting and Labeling Sequence Data,” Proc. Int‟l Conf. Machine Learning, pp. 282-289,2001.
[9] F.V. Jensen, “Bayesian Networks and decision Graph”, Springer-Verlag, 2001.
[10] J. Peral, “Probabilistic Reasoning in Intelligent System: Network of Plausible Inference”, Morgan-Kaufmann Publishers, 1998. [11] D. Freedman and T. Zhang, “Interactive graph cut based
segmentation with shape priors,” in Proc. IEEE Conf. Comput. Vis. Pattern Recognit., 2005, pp. 755-762.
[12] C. Rother, A. Blake, and V. Kolmogorov, “Grabcut: Interactive foreground extraction using iterated graph cuts,” in Proc. SIGGRAPH, 2004, pp. 309-314.
[13] Y. Li, J. Sun, C.-K. Tang, and H.-Y. Shum, “Lazy snapping,” in Proc. SIGGRAPH, 2004, vol. 23, no. 3, pp. 303-308.
[14] E. N. Mortensen and W. A. Barrett, “Intelligent scissors for image composition,” in Proc. SIGGRAPH, 1995, pp. 191-198. [15] E. N. Mortensen and J. Jia, “Real-time semi-automatic
International Journal of Emerging Technology and Advanced Engineering
Website: www.ijetae.com (ISSN 2250-2459,ISO 9001:2008 Certified Journal, Volume 4, Issue 3, March 2014)
135
[16] E. Mortensen and J. Jia, “A Bayesian network framework for real-time object selection,” in Workshop Percept. Org. Comput. Vis., 2004, p.44.
[17] Lei Zhang, Zhi Zeng, and Qiang Ji “Probabilistic Image Modeling With an Extended Chain Graph for Human Activity Recognition and Image Segmentation”, IEEE Transaction on Image Processing, VOL. 20, NO. 9, September 2011.
[18] Kittipat, Kampa, Duangmanee Putthividhya and Jose C. Principe, “Irregular Tree-Structured Bayesian Network for Image Segmentation.”, IEEE International Workshop on Machine Learning for Signal Processing, September 18-21, 2011. [19] F. Liu, D. Xu, C. Yuan, and W. Kerwin, “Image segmentation
based on Bayesian network-Markov random field model and its application on in vivo plaque composition,” in Int. Symp. Biomed. Imag., 2006, pp. 141-144.
[20] Costas Panagiotakis, Ilias Grinias, and Georgeios Tziritas “Natural Image Segmentaion Based on Tree Equipartition, Bayesian Flooding and Region Merging”, IEEE Transactions on Image Processing, Vol. 20, No. 8, August 2011.
[21] Lei Zhang and Qiang Ji, “A Bayesian Network Model for Automatic and Interactive Image Segmentation”, IEEE Transaction on Image Processing, VOL. 20, NO. 9, September 2011.
[22] Lei Zhang and Qiang Ji, “Image Segmentation with a Unified graphical model”, IEEE Transaction on Pattern Analysis and Machine Intelligence, VOL. 32, NO. 8, AUGUST 2010. [23] S. Birchfield, Elliptical head tracking using intensity gradients
and color histograms, in: Proceedings of IEEE Conference on Computer Vision and Pattern Recognition, 1998, pp. 232-237. [24] T.Ojala, M.Pietikainen, P.Maenpaa ,
Multiresolutiongray-scaleandrotation invariant texture classification with local binary patterns, IEEE Transactionson Pattern Analysis and Machine Intelligence, 2002, pp.971-987.
[25] M.J. Swain, D.H. Ballard, “Color indexing”, International Journal of Computer Vision Vol. 7 No. 1, 2002, pp. 11-32.
[26] D. Comaniciu, V. Ramesh, P. Meer, “Kernel-based object tracking”, IEEE Transactions on Pattern Analysis and Machine Intelligence, 2003, pp. 564-577.
[27] T. Kailath, “The divergence and Bhattacharyya distance measures in signal selection”, IEEE Transactions on Communications Technology, Vol. 15, No. 1, 1967, pp. 52-60.