USING VISUAL MANAGEMENT TO IMPROVE
TRANSPARENCY IN PLANNING AND CONTROL IN
CONSTRUCTION
Denise Ann Brady
School of the Built Environment
College of Science and Technology
University of Salford, Salford, UK
Submitted in Partial Fulfillment of the Requirements of the Degree of
Doctor of Philosophy
I
Table of contents
1 Introduction ... 1
1.1 Introduction ...1
1.2 Background on research problem ...1
1.2.1 The need for transparency in construction ...2
1.2.2 Visual management ...4
1.2.3 Holistic thinking ...6
1.3 Summary of research problem ...6
1.4 Research motivation ...8
1.5 Aims and objectives ...9
1.5.1 Research aim ...9
1.5.2 Research objectives ...9
1.6 Research process ...9
1.7 Content of thesis ...11
1.8 Chapter summary ...13
2 Literature review... 14
2.1 Introduction ...14
2.2 Lean production ...15
2.2.1 The TPS: tools and techniques ...16
2.3 The principle of transparency ...19
II
2.3.2 Creating transparency ...21
2.4 What is Visual Management? ...24
2.5 Application of Visual Management ...27
2.5.1 Visual tools identified by Galsworth ...28
2.5.2 Visual Management research in construction ...30
2.5.3 Visual tools from the TPS applied to construction ...31
2.5.4 Transparency and the traditional conversion model ...38
2.6 The traditional approach to Project Management ...38
2.6.1 The initiation process ...39
2.6.2 The planning process ...40
2.6.3 The execution process ...41
2.6.4 The monitoring and controlling processes ...42
2.6.5 The closing processes ...43
2.7 The deficiencies of the traditional approach ...43
2.7.1 Deficiencies in planning: “management-as-planning” ...43
2.7.2 Deficiencies in execution: “the dispatching model” ...44
2.7.3 Deficiencies in control: “the thermostat model” ...46
2.8 Lean in construction ...47
2.8.1 Benefits of Lean Construction ...48
2.9 Production planning and control in construction ...50
2.9.1 The critical path method (CPM) ...50
2.9.2 The line of balance method ...50
2.9.3 Simulation method ...51
III
2.9.5 Critical Chain Scheduling ...51
2.9.6 The Last Planner System ...52
2.9.7 Barriers to Last Planner implementation ...56
2.10 Summary and discussion of literature review ...59
2.10.1 There is a need for broader solutions for VM in construction ...60
2.10.2 Challenges in achieving a holistic view through broader solutions ...62
2.10.3 There is a need for transparency in the construction process ...64
2.10.4 The downside to transparency ...68
2.10.5 VM creates transparency in production planning and control ...69
2.10.6 Conclusions from the literature review informing this research ...70
2.11 Chapter summary ...71
3 Research method ... 72
3.1 Introduction ...72
3.2 Choice of method ...72
3.3 The Design Science approach ...74
3.4 Justification for the choice of research method ...75
3.5 Design Science outcomes ...79
3.5.1 A construct or concept ...79
3.5.2 A model ...79
3.5.3 A method ...79
3.5.4 An instantiation ...80
3.5.5 Design science steps ...80
IV
3.7 Data collection ...88
3.7.1 Documentation ...88
3.7.2 Semi-structured interviews ...88
3.7.3 Observation ...88
3.8 The research process in part 1 ...89
3.8.1 Case study 1: Background ...89
3.9 Research process in part 2 ...96
3.9.1 Case Study 2: Background ...97
3.10 Research process in part 3 ...99
3.10.1 Case Study 3: Background ...101
3.11 Chapter summary ...101
4 Development of the LCM model: Case Study 1 ... 102
4.1 Introduction ...102
4.2 Data collection ...102
4.3 Step 1: Clarification of the problem ...103
4.3.1 Communication issues in daily operations ...104
4.3.2 Inefficient decision making ...105
4.3.3 Poor process orientation ...105
4.3.4 No worker involvement in continuous improvement ...106
4.3.5 The site was disorganised and cluttered ...106
4.3.6 Waste in the form of high levels of inventory was evident ...108
4.3.7 Work was not carried out as planned ...108
V
4.3.9 There was no measurement of performance...111
4.3.10 Clarification and summary of the practical problem ...111
4.3.11 Discussion: a process lacking in transparency ...112
4.4 Step 2: Definition of objectives for the solution ...113
4.4.1 Improve the overall transparency of the construction process ...113
4.4.2 Ensure the flow of levelled work and a holistic view of the process ...114
4.4.3 Involve the construction worker more in the whole process ...115
4.4.4 Improve the logistics of the site ...116
4.4.5 Implement a simple quality control system ...116
4.4.6 Introduce a visual way of measuring performance ...117
4.4.7 Generate an interest in continuous improvement onsite ...117
4.5 Step 3: Develop solution ...118
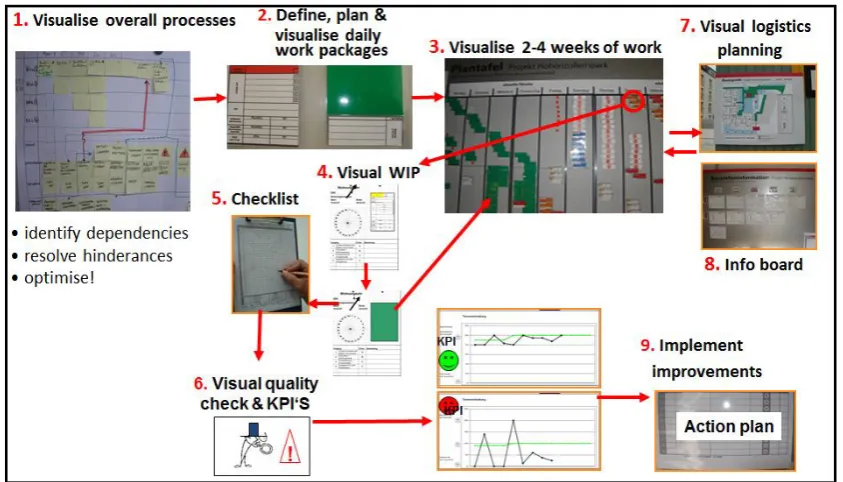
4.5.1 Visualise the overall construction process ...118
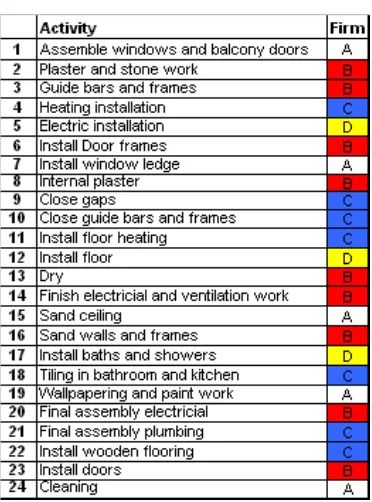
4.5.2 Define the standard process ...120
4.5.3 Define daily work packages for this flow ...121
4.5.4 Develop the main elements of the Visual Management Model ...122
4.6 Step 4: Demonstration of version 1 ...122
4.6.1 Description and application of version 1 during instantiation 1A ...123
4.7 Step 5: Initial evaluation of the model ...138
4.7.1 Limitations during the initial evaluation ...138
4.7.2 An improvement in the transparency of work and performance ...139
4.7.3 Recommendations for future application and improvements to model ...140
VI
5 Application of LCM to refurbishment construction: Case Study 2 ... 144
5.1 Introduction ...144
5.2 Data collection ...144
5.3 Further development (step 3: Design & Develop) ...147
5.4 Application of LCM to refurbishment (step 4: Demonstrate) ...148
5.4.1 Case study 2 ...148
5.4.2 Application of version 2 of the model in three phases ...151
5.4.3 Formative evaluation of version 2 ...162
5.5 Evaluation of utility and applicability (step 5) ...165
5.5.1 Limitations of the data ...166
5.5.2 Usefulness of the LCM instantiations ...166
5.5.3 Applicability of the LCM model based on instantiations 2A and 2B ...175
5.6 Chapter summary ...176
6 Observational study, Brazil ... 177
6.1 Introduction ...177
6.2 Data collection ...177
6.2.1 Visual Management practices at site 1 ...178
6.2.2 Visual Management practices at site 2 and 3 ...182
6.2.3 Data analysis ...195
6.2.4 Comparison to the LCM model ...200
VII
7 Application of LCM to power plant construction: Case Study 3 ... 204
7.1 Introduction ...204
7.2 Data collection ...204
7.3 Further development (step 3: Design & Develop) ...206
7.4 Application of LCM to power plant construction (Step 4: Demonstrate) ...208
7.4.1 Case study 3 ...208
7.4.2 Application of version 3 of the model in three phases (instantiation 3A) ...213
7.4.3 Formative evaluation of version 3 (step 4) ...234
7.5 Evaluation of utility and applicability (step 4) ...236
7.5.1 Limitations of the KPI data ...237
7.5.2 Usefulness of the LCM instantiations ...237
7.5.3 Applicability of the LCM model ...242
8 Summary of findings and contribution ... 248
8.1 Introduction ...248
8.2 Achievement of the aim and objectives of the work ...248
8.3 Objective 1: understanding the problem ...249
8.3.1 Lack of transparency in construction ...250
8.3.2 The need for transparency in construction ...251
8.3.3 Lack of systematic Visual Management solutions for creating transparency ...252
8.3.4 Barriers experienced during Last Planner implementation ...253
VIII
8.4.2 Visual elements of the model ...255
8.4.3 Method of implementation ...256
8.4.4 Demonstration of a systematic application of VM ...262
8.5 Objective 3: evaluation of the LCM instantiations ...270
8.5.1 Usefulness for improving daily planning through increased transparency ...270
8.5.2 Usefulness for improving constraint removal through increased transparency ..272
8.5.3 Usefulness for reducing waste ...273
8.5.4 Applicability of the model ...274
8.5.5 Findings from the observational study ...275
8.5.6 Limitations of the research ...276
8.6 Contribution ...278
8.6.1 Contribution to Visual Management ...278
8.6.2 Contribution to Project Management ...284
8.7 Theoretical significance ...291
8.7.1 Relationships between VM categories ...291
8.7.2 The critique of project management ...296
8.8 Further research ...298
8.9 Final comments ...299
References ... 300
Appendices ... 321
Appendix A: Lean application ...321
IX
A.2 Poor application of Lean: example ...322
A.3 Visual Management as a function of transparency ...322
A.4 Challenges of implementing Lean in construction ...323
A.4.1 Overcoming the challenges ...326
Appendix B: Data collection ...328
B.1 Interview questions for observational study in Brazil ...328
B.2 Focus groups ...330
Appendix C: Kaizen during LCM instantiation 1A ...334
C.1 Improvement of electrical assembly process for each apartment...334
C.2 Improvement of the floor heating process ...336
Appendix D: Example of Overall Process Map ...338
D.1 Example of section of OPA, instantiation 2B ...338
Appendix E: KPI data, case study 3 ...343
E.1 Findings from instantiations 3B-3E ...343
E.2 KPI data gathered during instantiation 3B, power plant B ...343
E.3 KPI data gathered during instantiation 3C, power plant C ...346
E.4 KPI data gathered during instantiation 3D, power plant D ...350
E.5 KPI data gathered during instantiation 3E, power plant E ...353
Appendix F: Relationship LCM and existing visual concepts ...356
F.1 Tezels taxonomy and LCM ...356
F.2 LCM and the Toyota Production System ...357
X
Publications
Brady, D., Tzortzopoulos, P. and Rooke, J. 2011, “An examination of the barriers to Last
Planner implementation”, In the proceedings of the 19th Annual Conference of the International Group for Lean Construction (IGLC), Lima, Peru.
Brady, D., Tzortzopoulos, P. and Rooke, J. 2012, “Using Design Science to further develop
Visual Management application in construction”, In the proceedings of the 20th Annual Conference of the International Group for Lean Construction (IGLC), San Diego, California,
U.S.A.
Brady, D., Tzortzopoulos, P. and Rooke, J. 2013, “The development of an evaluation
framework based on the Design Science approach”, In the proceedings of the 21st Annual
Conference of the International Group for Lean Construction (IGLC), Fortaleza, Brazil.
Brady, D., Tzortzopoulos, P., Rooke, J., Formoso, C. T. 2014, “A holistic method of applying
Visual Management to improve planning and control on construction sites”, In proceedings of
XI
List of Figures
Figure 1.1: Outline of research design………..10
Figure 2.1: The TPS house………16
Figure 2.2: Galsworth’s (2009) application framework for Visual Management……….30
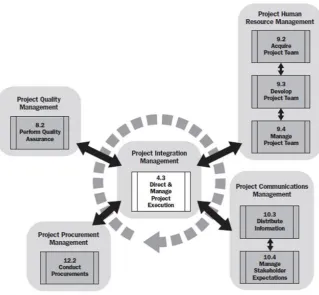
Figure 2.3: The closed loop of managerial processes in project management according to the PMBOK Guide (2000)………..39
Figure 2.4: The planning process, PMBOK guide (2009)………...40
Figure 2.5: The execution process, PMBOK guide (2009)………...41
Figure 2.6: The control process, PMBOK guide (2009)………...42
Figure 2.7: The lookahead window in the LPS, Ballard (2000)………...55
Figure 2.8: The Last Planner System with lookahead process……….55
Figure 2.9: A holistic understanding of waste………..61
Figure 2.10: Misunderstanding of Lean application……….63
Figure 2.11: Functional orientated structure of projects versus process orientated structure...66
Figure 3.1: Research process………....86
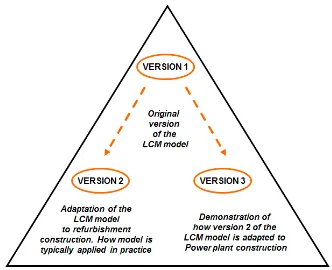
Figure 3.2: Three different versions of the LCM model………...87
Figure 3.3: The outcomes of LCM………...94
XII
Figure 3.5: Evaluation framework for the LCM model (elements 9-16)………..95
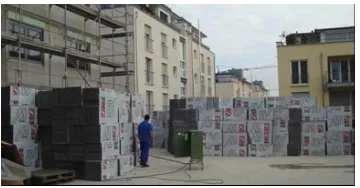
Figure 4.1: Construction of residential building in south Germany………...104
Figure 4.2(a): Chaotic storeroom………106
Figure 4.2(b): Material located in different rooms………..106
Figure 4.2(c): Inventory stored onsite making it difficult for workers to make their way around………..107
Figure 4.2(d): Storing large amounts of material onsite led to extra work for the construction workers who had to move it about………..107
Figure 4.2(e): Material damaged after rainfall………107
Figure 4.2(f): Disorganised storage of material onsite………107
Figure 4.2(g): Time intensive process of unloading large quantities of material that are not immediately needed………107
Figure 4.3: Percentage of activities on-time, too early and too late………108
Figure 4.4: Flow of work on a daily basis………...………110
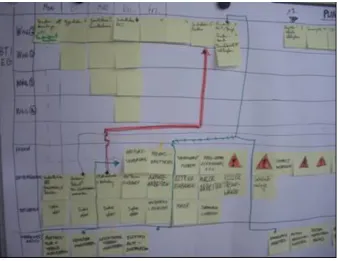
Figure 4.5: Overall Process Map (OPM)………119
Figure 4.6: The standard process for one apartment………...121
Figure 4.7: Version 1 of the LCM model………...123
Figure 4.8: Construction card………..125
XIII
Figure 4.10: The planning board process………127
Figure 4.11: The apartment clock…...………129
Figure 4.12: Process for use of apartment clock……….130
Figure 4.13: The apartment clock showing foreman requests………131
Figure 4.14: Checklist used by foreman……….132
Figure 4.15 (a): Measuring quality as a KPI………...133
Figure 4.15 (b): Measuring On-Time-Performance as a KPI……….134
Figure 4.16: Process for gathering KPI’s………134
Figure 4.17: The logistics board……….135
Figure 4.18: The logistics board process………136
Figure 4.19: Information board at construction site………137
Figure 4.20: The action plan………...138
Figure 5.1: Version 2 of the LCM model………....148
Figure 5.2: LCM area during instantiation 2A of the model, case study 2……….149
Figure 5.3: LCM area during instantiation 2B of the model, case study 2……….150
Figure 5.4 (a): Snapshot of Overall Process Map from instantiation 2A, case study 2……..153
Figure 5.4 (b): Snapshot of Overall Process Map from instantiation 2B, case study 2……..153
XIV
Figure 5.6: Planning board, instantiation 2B, case study 2………...158
Figure 5.7: Weekly meeting at the planning board………...158
Figure 5.8: Action plan (DP)………...159
Figure 5.9: Tracking implementation………..159
Figure 5.10: Infoboard displaying action plan from OPA, PP and DP, KPI’s, role description for the LCM instantiation………159
Figure 5.11: Infoboard displaying current PP, master plan, section of OPM and status of implemented actions………...160
Figure 5.12: Worker hanging card on plan before work………....161
Figure 5.13 (a) and (b): Visualisation of work in process on colour-coded plans (a) and site layout (b), case study 2………...161
Figure 5.14: Logistics board………...162
Figure 5.15: On-Time-Performance data, instantiation 2A, case study 2………...168
Figure 5.16: Quality data, instantiation 2A, case study 2………...169
Figure 5.17: On-Time-Performance data, instantiation 2B, case study 2………...169
Figure 5.18: Quality data, instantiation 2B, case study2………...170
Figure 5.19: Stability of Process Planning, instantiation 2B, case study 2……….171
Figure 5.20 (a): Status of implemented actions from the OPA, instantiation 2B…………...172
XV
Figure 5.20 (c): Status of implemented actions from the DP, instantiation 2B………..174
Figure 5.21: Overview of LCM instantiation to refurbishment construction……….176
Figure 6.1: Site visit 1, construction of distribution centre………...179
Figure 6.2: Visualisation of rainfall forecast………..179
Figure 6.3: Visualisation of work completion………180
Figure 6.4: Visualisation of flow of activities……….181
Figure 6.5: No. of frame size written on material………...181
Figure 6.6: Site visit 2 and 3, construction of residential buildings………...182
Figure 6.7: Visual overview of project plan………...183
Figure 6.8: Detailed project plan……….183
Figure 6.9: Short term plan and quality overview………..184
Figure 6.10: “Little stairs”………..185
Figure 6.11 (a) & (b): Visual plan for façade...185-186 Figure 6.12: Management of concrete………186
Figure 6.13: Crew control for services………187
Figure 6.14: Lookahead plan for constraints………..188
Figure 6.15: Quality control sheets……….188
XVI
Figure 6.17: Quality control………190
Figure 6.18: Cost control and completion………...190
Figure 6.19: Visualisation of site layout……….191
Figure 6.20: Performance of subcontractor……….192
Figure 6.21: Standard operating procedures………...192
Figure 6.22: Safety statistics………...193
Figure 6.23: Quality performance………...193
Figure 6.24: Visualisation of material type……….194
Figure 6.25 (a)-(d): Visualisation of brick laying process and JIT material delivery……….195
Figure 7.1: Version 3 of the LCM model………207
Figure 7.2 (a): Power plant A (sub-section)………209
Figure 7.2 (b): Power plant B………..211
Figure 7.2 (c): Power plant C………..211
Figure 7.2 (d): Power plant D……….212
Figure 7.2 (e): Power plant E (sub-section)………212
Figure 7.3: Overall Process Map for power plant A………...215
Figure 7.4: Power plant divided into sub-sections called cubes……….216
XVII
Figure 7.6: Working area 3.1.1………...218
Figure 7.7: Lifting unit 3.1.1.1………218
Figure 7.8: Example of original Process Planning tool………..220
Figure 7.9: Process Planning tool adapted for power plant sites………....220
Figure 7.10: Milestone 1: The tracking list for documentation………..221
Figure 7.11: Milestone 2: Tracking list for release of documentation 8 weeks before start of erection………222
Figure 7.12: Milestone 3: Detailed erection concept………..222
Figure 7.13: Milestone 4: Manufactoring static………..223
Figure 7.14: Milestone 5 – Availability of components……….223
Figure 7.15: Parts list in Excel………....224
Figure 7.16: Detailed planning form………...225
Figure 7.17: Snapshot of the Detailed Planning for working area 3.1.1……….225
Figure 7.18: The planning board……….227
Figure 7.19: Visualisation of work in process on plans……….228
Figure 7.20: Logistics board – visualised overview of crane capacity onsite……….229
Figure 7.21: Visualisation of plans and work areas in LCM area………...230
XVIII
Figure 7.23: Visualisation of KPI’s such as OTP and Quality. Description of roles and
responsibilities………..………..230
Figure 7.24: Construction card examples………...231
Figure 7.25: Construction card examples………...233
Figure 7.26: Overview of meetings as part of the LCM instantiations to power plant construction……….233
Figure 7.27: Summary of evaluation findings for elements 1-8……….241
Figure 7.28: Summary of evaluation findings for elements 9-16………..……….242
Figure 7.29: Summary of evaluation findings for LCM Instantiations………...242
Figure 7.30: The additional pre-planning steps as part of LCMs adaptation to power plant construction……….244
Figure 8.1: Final version of the LCM model………..254
Figure 8.2: Systematic application of Tezel’s classified elements using the LCM model....264
Figure 8.3: How each of the type of tools defined by Galsworth (1997) are demonstrated by the LCM model………...269
Figure 8.4: LCM – a systematic model of applying Visual Management………...279
Figure 8.5: Coordinated application of visual tools from the TPS using the LCM model….280 Figure 8.6: How the visual elements of the LCM model are applied to improve transparency and the flow of information in construction………...282
XIX
Figure C.2: Improvement of the floor heating installation process………337
Figure E.1: Overview of crane utility, Plant B………...344
Figure E.2: Overview OTP of assembly companies, Plant B……….345
Figure E.3: Reasons for low OTP, Plant B……….345
Figure E.4: Overall crane utility at plant C, block D………..346
Figure E. 5: Reasons for low crane utility at power plant C, Block D………...347
Figure E.6: On Time Performance, Plant C, Block D………348
Figure E.7: Reasons for low OTP, Plant C, block D………..348
Figure E.8. OTP, Plant C, Block E……….349
Figure E.9: Reasons for low OTP, Plant C, Block E………..350
Figure E.10: Crane utility, Plant D……….351
Figure E.11: Reasons for low crane utility, Plant D………...351
Figure E.12: OTP, plant D………..352
Figure E. 13: Reasons for low OTP, plant D………..352
Figure E.14: Overall crane utility, Plant E……….353
Figure E.15: On Time Performance, Plant E………..354
XX
List of Tables
Table 2.1: Overview of Last Planner implementations………...58
Table 3.1: Different approaches to Design Science………..81
Table 3.2: Overview of research process………..86
Table 4.1: Data gathered for case study 1………...103
Table 4.2: Snapshot of waste observed onsite………109
Table 4.3: Improvement points from initial evaluation of version 1………..142
Table 5.1: Data gathered for instantiation 2A, refurbishment construction………145
Table 5.2: Data gathered for instantiation 2B, refurbishment construction………146
Table 5.3: Summary of interviews conducted………147
Table 5.4: Summary of new elements in version 1 and 2………...165
Table 6.1: Data gathered during field trip, Brazil………...178
Table 6.2: Summary of interviews conducted….………...178
Table 6.3: Functions of visual tools observed on sites 1-3……….197
Table 6.4: Summary of observed Visual Management practices compared to LCM…202-203 Table 7.1: Power plant LCM instantiations………204
XXI
Table 7.3: Data gathered for instantiation 3B-3E, power plant………..206
Table 7.4: Summary of interviews conducted………..…………..206
Table 7.5: Summary of new elements of versions 1, 2 and 3 of the LCM model…………..236
Table 8.1: Visual tools classified by Tezel directly present in LCM……….263
Table 8.2: Visual tools classified by Tezel (2011) present indirectly in LCM………..263
Table 8.3: Elements of the LCM model representing more than one of Galsworths
categories………....293
Table A.1: The functions of Visual Management………..323
Table B.1: Basis for discussion during focus groups………..336
Table F.1: Tezel’s (2011) Taxonomy and the LCM model elements (direct)………....356
Table F.2: Tezel’s (2011) Taxonomy and the LCM model elements (indirect)………357
Table F.3: Relationship between elements of LCM model and categories identified by Tezel
XXII
Acknowledgements
There are many people that I wish to thank for their support, advice and encouragement which
made the completion of this PhD work possible. First and foremost, I am greatly indebted to
my supervisors Professor Dr. Patricia Tzortzopoulos-Fazenda and Dr. John Rooke for their
continuous guidance, invaluable discussions and inspiration during the five doctoral years.
I would also like to thank Professor Dr. Carlos Formoso at the Federal University of Rio
Grande do Sul (UFRGS) for making the research trip to Brazil possible. To all the staff and
students at the UFRGS who were relentless in their support and hospitality during my stay. In
particular, a special thanks to Daniela Viana and Dr. Cecília Gravina da Rocha for their time,
assistance and friendship.
I must also acknowledge a number of people that supported me in initiating this research and
for their valuable views and interest throughout. I am very grateful to Professor Dr. Lauri
Koskela for his words of encouragement and interest expressed in my work over the years. To
Professor Dr. Fritz Gehbauer whose advice and guidance I am grateful for, especially in the
early stages of the research and also to Professor Dr. Glenn Ballard for your inspiration and
time. I wish to express my gratitude to my fellow PhD colleagues, in particular Dr.
Clementinah Ndhlovu Rooke and Dr. Algan Tezel for the important discussions, input and
words of encouragement. In addition, I would like to acknowledge the high level of support
received from the research administrators at the Research Institute of the Built Environment,
which made carrying out this PhD outside the UK possible. In particular, many thanks to
Moira Mort, Rachel Liley, Cheryl Batley and Carol Gordon.
I am extremely grateful to Patrick Theis, Managing Director at DS-Consulting for his support.
The flexibility granted to conduct projects and carry out this research parallel, contributed
greatly to this work. The access given to industry examples of LCM application, was an
important source of data which enriched the overall work. I am also very thankful to the
XXIII
opinions which contributed to the findings. I would like to thank all my colleagues at
DS-Consulting, in particular many thanks to Patrick Winter and Benjamin Bermayer, for your
time and valuable insights.
Last but not least, I would like to thank my family. To my parents, Ann and Charles Brady,
for a lifetime of unconditional love, support and encouragement; I am eternally grateful. To
my sisters Andrea, Patricia and Janet, thank you for all the fun and keeping me in touch with
life. To my parents-in-law, Marliese and Josef Hackl, for your support I am very grateful.
Finally, I am indebted to my husband Joachim Hackl for being a constant source of support,
understanding and encouragement. Without you, none of this would be possible. To our sons,
XXIV
Abbreviations
BIM: Building Information Modelling
CAD: Computer Aided Design
CPM: Critical Path Method
DP: Detailed Planning
ICT: Information and Communication Technologies
IGLC: International Group of Lean Construction
JIT: Just In Time
KPI: Key Performance Indicator
LCM: Lean Construction Management
LPS: Last Planner System
MIT: Massachusetts Institute of Technology
OPA: Overall Process Analysis
OPM: Overall Process Map
OTP: On-Time-Performance
PM: Project Management
PPC: Percentage Plan Complete
XXV SOP: Standard Operating Procedure
TFV: Transformaton-Flow-Value
TOC : Theory of Constraints
TPS : Toyota Production System
TSSC: Toyota Production System Support Centre
VR: Virtual Reality
VSM: Value Stream Mapping
XXVI
Abstract
The principle of transparency is rarely evident on construction sites. Current practice shows
that instability in the execution phase is common, where activities, assumed to be feasible,
have be rescheduled initiating a chain of further readjustments and uncertainties. In
responding to these uncertainties, the lack of transparency in the construction process leads to
communication issues and inefficient decision-making. There is little transparency of
activities in the execution phase, making it difficult to foresee and communicate problems and
plan to resolve them.
The LCM model is a Visual Management Model based on the Lean concepts, designed to
improve transparency in production planning and control in construction. LCM is an acronym
for Lean Construction Management. The aim of this research work is the development of this
Visual Management Model, by clarifying its contribution to theory and practice. To address
this aim, the Design Science method is adopted in this investigation. Design Science is
applied to develop artefacts for solving problems with practical relevance and potential for
theoretical contributions. Outputs of the work include i) the LCM model itself ii)
instantiations of the LCM model to refurbishment and power plant construction
(demonstrating that the solution works) iii) an evaluation of the utility and applicability of the
model and iv) an explanation of its theoretical significance. The research focuses on three
case studies which were important for devising, further improving and evaluating the model.
This research provides a new model and associated method for applying Visual Management
for production planning and control in construction. The model demonstrates how visual tools
are systematically applied to manage information flow, support communication and to shed
light on the deficiencies of traditional project management. In addition, it demonstrates how
visual tools can be used to improve communication barriers and transparency when applying
1
1
Introduction
1.1
Introduction
This chapter provides a background on the research presented in this thesis. The first section
addresses the problem of a lack of transparency in the construction process and presents the
concept of Visual Management as a key approach for creating it. An overview of the
importance of the principle of transparency for the construction process is given. Since the
focus of this research is the development of a systematic Visual Management Model for
production planning and control in construction based on the Lean concepts, the importance
of broader solutions for application are addressed (Liker, 1997; Spear & Bowen, 1999; Lewis,
2008; Atkinson 2010; Liker, 2004; Boyle et al., 2010; Saurin et al., 2011). The significance of
holistic thinking for Visual Management application is also explained.
The remainder of the chapter presents the personal motivation for this research, the aim and
objectives of the research, an overview of the research process, the research contribution and
an overview of the thesis structure.
1.2
Background on research problem
The research problem addressed in this work is a lack of transparency in the construction
process (dos Santos et al., 1998). The traditional conversion model of understanding
production systems as a set of conversions of inputs to outputs (Koskela, 1992) contributes to
a lack of transparency in construction (dos Santos et al., 1998). The traditional method of cost
estimation is at the heart of this view. The building or structure is divided into its constituent
elements and for each element, the costs of needed materials and labor (conversion of input to
output) are estimated (Koskela, 1992). In the conversion model, it is assumed that the total
production process consists of a set of sub processes which convert an input to an output and
which can be realised and analysed in isolation from each other (Koskela, 1992). Since it is
assumed, that sub processes can be realised independently of one another, there appears to be
2
The lack of transparency in construction, stemming from the nature of the traditional
conversion model also leads to communication issues. Since work is assumed to flow from
the authorisation of a task, it is also assumed that the task is fully understood, started and
completed according to the plan once authorised (Koskela & Howell, 2002a). However, in
reality this is not the case. Inputs to tasks are often unavailable leading to uncertainty and
rescheduling of those tasks (Koskela & Howell, 2001). In addition, there is little feedback on
the causes of problems in the process since control is focused on time and cost rather than on
learning and improvement (Koskela & Howell, 2001).
Communication and transparency issues are also evident in the application of existing systems
for planning and control in construction based on the Lean concepts, such as the Last Planner
System (Alarcon & Conte, 2003; AlSehaimi et al., 2009; Kalsaas et al., 2009). These issues
occurred mainly where participants were not present at the regular meetings taking place
during implementation and missed important discussions and information relating to the
process.
The following section expands further on the need for transparency in the construction
process, which is addressed in this research work.
1.2.1
The need for transparency in construction
Two important findings from the literature review are 1) that the traditional conversion model
contributes to a lack of transparency and difficulties in communication in construction and
that 2) there is a need for increased transparency in construction to deal with the uncertainty
that exists, to better understand the complicated relationship between activities and interfaces,
thus anticipating and resolving problems earlier. The literature review on the critique of
Project Management reveals critical issues in production planning and control, which hinder
effective communication and the development of trust and team building between
organisations involved in the procurement process (Koskela, 1992, 1999, 2001; Howell &
3
The critical issues in production planning and control stem from several assumptions that are
made about the construction process. The need for transparency in the construction process is
disguised by these assumptions. The assumptions are:
that the execution process is unproblematic and linear: which means that the
execution phase commences on the basis that work can be carried out as planned
which in reality is not the case. It is assumed that plans are feasible, requiring no
transparency of how the execution process is carried out as no problems are
anticipated. This leads to re-scheduling and uncertainty during daily operations.
that one way communication is adequate for the creation of sound commitments: which means that there is little feedback on the feasibility of work in execution and daily issues in the construction process are discovered too late.
There is no transparency of information between planning and execution, which
makes it difficult to identify problems in execution earlier (Koskela & Howell,
2001).
that tasks can be carried out as planned with no need for root cause analysis on problems: which means that there is no focus on understanding the sources of problems and encouraging a learning cycle for future projects. This assumption
has been criticised in the literature (Johnston & Brennan, 1996) since it is not
generally possible to maintain a complete and up-to-date representation of the
current circumstances and the plan to change them. As a result of this assumption,
there is no transparency of the execution process as the need to split the work
down and question its feasibility against the current environment is not
recognised. More meaningful, lower level plans do not exist and therefore
informal systems of management arise which are geared towards handling
uncertainty and interdependence (Koskela & Howell, 2001). Transparent, lower
level plans are needed however, so that the execution process can be adapted
according to the current status of the production system. Without transparency in
the execution processes however, it is difficult to observe and react to the current
4
The need for transparency in the construction process can be classified into three main areas:
to facilitate a holistic view of the entire process and to implement flow: in
order to observe the construction process as a flow of activities and to achieve a
holistic view of the overall process, a high capability of handling vast amounts of
information is required. In order to overcome the difficulties associated with this
additional information, production activities in construction must become more
transparent. The application of the principle of transparency is a key concept for
making the flow model viable (dos Santos et al., 1998).
to support continuous improvement: in order to identify higher levels of improvements and understand what effect those improvements have on the overall
process, it is necessary to make the process and information flow between the
different interfaces transparent, and
to build trust and motivate process participants: construction companies
usually have few visual mechanisms to inspire, instruct or motivate workers to
carry out their jobs more effectively, efficiently and safely (dos Santos et al.,
1998).
The following section addresses the concept of Visual Management as a key approach for
creating transparency and discusses important findings on Visual Management from the
literature review.
1.2.2
Visual management
Visual Management is a core foundational element of the Toyota Production System and
plays a key role in the creation of transparency (Liker, 1997; Formoso et al., 2002). Various
definitions of Visual Management can be found in the literature but it can be described as a
management strategy for organisational control, measurement and improvement which uses
5
creating transparency (Greif, 1991; Ho & Cicmil, 1996; Liker, 1997; Imai 1997; Tomkins &
Smith, 1998; Chua et al., 1999; Pries 2003).
An important characteristic of transparent processes is that they radiate relevant information
in a physical way, facilitating communication, decision-making and promoting
self-management (Bowen & Lawler, 1992; Galsworth, 1997; Bauch, 2004; Nijhof et al., 2009).
Transparent processes build trust among parties and generate value (Sirota et al., 2005;
Berggren & Bernshteyn, 2007; Crumpton, 2011). An important goal of Visual Management
application is to make information easily accessible so that process participants can act in a
purposeful way (Liker, 1995; Imai, 1997; Tomkins & Smith, 1997; Chua et al., 1999;
Koskela, 2001). Various authors (Galsworth, 1997; dos Santos & Powell, 1998; Formoso et
al., 2002) call for the use of visual tools and methodologies to increase transparency on
construction sites, reduce information processing time and human errors, add different layers
of information on workplace elements and promote self-management.
An important finding from the literature review on Visual Management application in
construction is that most examples of Visual Management applications in construction are not
systematic in nature, but mainly based on individual tools taken from manufacturing and
applied in an isolated way to parts of the construction process (Arbulu et al., 2003; Picchi &
Granja, 2004; Kemmer et al., 2006; Jang & Kim, 2007; Tommelein, 2008; Saurin et al.,
2008). Tezel (2011) also observed the application of different individual visual tools existing
on construction sites in Brazil and called for broader applications of Visual Management to
construction. Broader applications of Visual Management help to identify crucial interactions
and to recognise what the consequences of optimising one part of a process has on the whole.
There is a need for broader solutions that can be applied to achieve a process view of the
critical interfaces of the construction process and to support two-way communication, so that
sound commitments can be created.
The following section presents the concept of holistic thinking, which is an important element
6
1.2.3
Holistic thinking
When applying a Visual Management Model based on the Lean concepts to the construction
process, a significant element to consider it the idea of holistic thinking. Holistic thinking
focuses attention on both structure and process, viewing a situation or organisation from a
higher standpoint, which takes interactions between the individual parts into account. A
holistic view of the process is facilitated by the application of systematic solutions. Jackson
(2006) argues that holistic thinking is needed today in order to deal with the increased
complexity, change and diversity in organisations, where problems rarely present themselves
individually but come related to other problems in richly interconnected situations. This is
especially true for construction where a project is characterised as a complex, dynamic
phenomenon in a complex and non-linear setting (Williams, 1997; Bertelsen, 2002).
The literature review reveals that the application of Lean is often confused with the
implementation of a tool or a set of tools in practice. A failure exists in recognising that Lean
application requires focusing on the entire system (Liker,1997; Spear & Bowen, 1999; Lewis,
2008; Atkinson 2010; Liker, 2004; Boyle et al., 2010; Saurin et al., 2011). It is hugely
important to focus on the entire process when applying a Visual Management solution based
on the Lean concepts, so that a true understanding of waste is achieved and higher levels of
improvements are identified. Holistic thinking is essential for the application of Visual
Management to the construction process, considering the interrelationship of all practices in
order to improve overall levels of quality, productivity, integration and waste reduction, over
all functional areas and along the supply chain (Boyle et al., 2010).
1.3
Summary of research problem
This research work focuses on the problem of a lack of transparency in the construction
process (dos Santos et al., 1998). It is argued that the traditional approach to project
management has led to a functional view of the construction process with little transparency
of information on interdependencies between the different interfaces. This lack of
transparency contributes to the fact that production systems in construction often operate well
7
searching, wandering, and waiting for tools, material and information instead of performing
value-adding operations. This work argues that there is a need for transparency in the
construction process to deal with the uncertainty that exists, to better understand the
complicated relationship between activities and interfaces, thus anticipating and resolving
problems earlier.
The lack of transparency in the construction process also leads to communication issues.
Since it is assumed that work flows from the point of authorisation in execution (Koskela &
Howell, 2002 a), there is little information on the feasibility of that work in practice. This
work argues that feedback on feasibility is necessary for the creation of sound commitments
(Winograd & Flores, 1983) and there is a need for structures to facilitate this feedback process
by making relevant information transparent. Similarly, communication and transparency
issues are also evident in the application of existing systems for planning and control in
construction based on the Lean concepts, such as the Last Planner System (Alarcon & Conte,
2003; AlSehaimi et al., 2009; Kalsaas et al., 2009). This work proposes that by using visual
tools to manage the information process and making the most important information available
at all times in a central area, communication and transparency issues in production planning
and control can be improved.
A further problem that is addressed by this research is the lack of systematic Visual
Management solutions existing to improve transparency in the production planning and
control of construction projects. Most examples of Visual Management application in
construction are not systematic in nature, but mainly based on individual tools taken from
manufacturing and applied in an isolated way to parts of the construction process (Arbulu et
al., 2003; Picchi & Granja, 2004; Kemmer et al., 2006; Jang & Kim, 2007; Tommelein, 2008;
Saurin et al., 2008). While these isolated applications provide valuable contributions, it is
argued that a more comprehensive approach could lead to a deeper understanding of Visual
Management in construction and better applications of Lean concepts. A holistic view of the
process, facilitated by broader solutions, focuses attention on both structure and process
taking interactions between key interfaces into account. A holistic view of processes is needed
in construction today in order to deal with the increased complexity, change and diversity
8
related to other problems in richly interconnected situations (Williams, 1997; Bertelsen, 2002;
Jackson, 2006).
1.4
Research motivation
This section explains the researcher’s personal motivation for this research. This research work is an important part of the researcher’s Lean journey which began in 2002. Between
2002 and 2007, the researcher was involved in the implementation of approximately 100 Lean
projects of various types in manufacturing throughout Europe and in Malaysia. The projects
were conducted based on the Lean concepts of the Toyota Production System. During these
years, one important observation made by the researcher was the significant role Visual
Management played in creating transparency and facilitating continuous improvement.
In 2007, the researcher joined a company based in Germany, focusing on the Project
Management and optimisation of real estate projects. The following years were spent
understanding the nature of construction projects and developing ways of how the Lean
concepts could be adapted and applied to the specifics of construction projects. The first case
study project in practice in 2007, led to the initial development of the LCM1 model by the
researcher, in her role as a consultant with the company. LCM is a Visual Management Model
for improving production planning and control in construction by creating transparency in the
overall construction process. In 2009, the researcher began this PhD research, which focuses
on the formalisation of the development of the LCM model; clarifying the models practical
and theoretical significance. The unique situation to be able to research and implement the
LCM model parallel in projects, led to a deeper understanding of the underpinnings of both
the models practical and theoretical significance.
1 At the time of writing “the LCM method” as is known in practice, has been renamed to LSP “Lean Site
9
1.5
Aims and objectives
1.5.1
Research aim
The aim of this research is the development of a Visual Management Model for production
planning and control in construction.
1.5.2
Research objectives
In order to achieve the aim of the research, three objectives were defined:
To understand the problem of a lack of transparency in production planning and
control and Visual Management application in construction.
To formalise the initial development of the model and associated method.
To test the applicability of the model and formally evaluate its instantiations.
1.6
Research process
Figure 1.1 presents an outline of the research process and a summary of the main activities
undertaken. The research is carried out in three parts which follow the steps of the process
model for Design Science application proposed by Peffers et al. (2007): 1) problem
identification, 2) define objectives for a solution, 3) design & develop, 4) demonstrate, 5)
evaluate, 6) communicate and includes feedback cycles between the steps as shown by the
10
[image:37.595.144.447.69.329.2]
Figure 1.1: Outline of research process
Part 1 represents the first stage of the research, beginning where a solution had been
developed in practice by the researcher and the research process begins by the researcher
“working backwards” to apply rigor to this process (Peffers et al., 2007). The goal of part 1 is
to formally explain and clarify the development of the LCM model in practice by applying the
six steps of Peffers et al. (2007) process model for Design Science retroactively. The initial
development of the model is analysed and reflected upon by building an explanation of the
process using the case study method. An important focus of part 1 was clearly defining the
problem identified in practice and deepening the knowledge of this problem through a
synthesis of the literature. Part 1 also included an initial reflection on and evaluation of the
first application of version 1 to the construction project to access if an improvement in
transparency was achieved and to make recommendations for the future application and
improvement of the model. An evaluation framework was developed as basis for the
11
The aim of parts 2 and 3 of the research is the further development, application and evaluation
of the model. In part 2, the applicability of the LCM model to refurbishment construction is
demonstrated and evaluated based on important criteria from the Design Science literature
and the objectives of the model. Part 2 follows Peffers et al. (2007) steps 3-6; design and
development, demonstrate, evaluate and communicate. The objective of step 3, design and
development is to show how the LCM model was further developed and to explain what new
elements are part of this further development. The objective of the demonstration (step 4) is
to form an explanation of how the further improved LCM model was applied to refurbishment
construction. A key focus of this stage of the research is an evaluation of the model (step 5)
and its application and adaptation by both third parties and the researcher to two
refurbishment projects. During part 2, the researcher also conducted a research trip to Brazil
to carry out an observational study of the Visual Management practices evident on sites in
there, to establish how these relate to the LCM model.
Likewise in part 3, the applicability of the LCM model to power plant construction is
demonstrated and evaluated. Part 3 represents the final stage of the research where the LCM
model is further developed and applied to five power plant construction projects. Part 3, like
part 2 is structured around Peffers et al. (2007) steps 3-6; design and development,
demonstrate, evaluate and communicate. The further development and demonstration of the
applicability of the model to a different type of construction and the evaluation of its
effectiveness and utility are an important focus of this part of the research.
In chapter 3, a detailed explanation of the research process is presented providing a
comprehensive description and justification for the application of Design Science.
1.7
Content of thesis
The thesis is structured around 8 chapters which are summarised as follows:
Chapter 1 presents a general introduction, outlining the research background,
problem and need for the research. The research aim and objectives and an outline
12
Chapter 2 presents the literature review and synthesis. Gaps in the Visual
Management and production planning and control literature are identified. The
significance of the principle of transparency and holistic thinking for the
improvement of planning and control and Lean application to construction are
clarified.
Chapter 3 describes the research method adopted for this research. A justification
for the application of the Design Science method is presented. The research
process is explained, including a detailed description of the methods used and an
overview of the case studies focused on during the research.
Chapter 4 focuses on case study 1. In case study 1, the original development of
the LCM model (version 1) in practice during the construction of a new residential
building based in south Germany is presented. This case study explains how the
model was developed and applied for the first time in practice. This chapter
includes a reflection on and an initial evaluation of the first application to
establish whether the model contributed to an improvement in transparency of
daily operations onsite. In addition, an important part of this initial evaluation is to
identify improvements to the model and make recommendations for future
applications in practice.
Chapter 5 focuses on case study 2. Case study 2 involves the further development, application and evaluation of the LCM model (version 2) based on
two refurbishment projects (two instantiations of the model, 2A & 2B). One
instantiation is carried out by the researcher and one by a third party.
Chapter 6 focuses on an observational study carried out in Brazil. The
observational study, provides an opportunity to compare Visual Management
practices observed on sites in Brazil to the LCM model to establish if similar
models are evident and if the LCM model can contribute to existing practices
observed there. Focus groups and presentations of the research work which were
carried out for practitioners and academics, contributed to the overall development
of the work at this stage of the research.
13
application of the LCM model to power plant construction by third parties (5
instantiations of the model (3A-3E) at five individual power plants. An evaluation
of the LCM model is carried out to establish whether the model is applicable and
adaptable to power plant construction scenarios and whether there is evidence to
show that it is a useful model in improving transparency on these types of
construction projects.
Chapter 8 presents a summary of the research findings, the contribution of the
work and its theoretical significance. The achievement of the aim and objectives
of the research work is examined, presenting conclusions on the contributions and
recommendations for future research.
1.8
Chapter summary
This chapter presented an introduction to the research presented in this thesis. The research
background was discussed, explaining the problem of a lack of transparency in the
construction process and why it is needed. Transparency in the construction process is needed
to 1) facilitate a holistic view of the process 2) to support continuous improvement and 3) to
build trust and motivate participants. The key role Visual Management plays in creating
transparency was discussed and it was established that there is a lack of examples to be found
in the literature showing how Visual Management can be applied in a systematic way to
construction projects. The chapter concluded with an outline of the research process and an
overview of the thesis structure.
The next chapter presents a review and synthesis of the relevant literature, providing the
14
2
Literature review
2.1
Introduction
This chapter presents a literature review of the relevant areas under investigation in this
research work. The LCM model, developed and formalised as part of this work, is a Visual
Management Model for planning and control in construction based on the Lean concepts. A
previous publication on the implementation of this model to refurbishment (Bryde &
Schulmeister, 2012) focused on investigating the effects of applying the Lean concepts to this
type of project. While the study indicated difficulties in applying certain aspects of Lean to
refurbishment such as pull scheduling and JIT (Section 2.2), it was found that the use of the
visual elements of the model had a beneficial impact on communication. This work focuses
on the development and further adaptation of the model, clarifying its contribution to the areas
of Visual Management and project management in construction.
The chapter begins with an overview of the Lean concepts, from where this work originates.
The principle of transparency is presented as an important element of Lean application and
the significant role Visual Management plays in creating transparency is discussed. An
important focus of the literature review is to understand why the principle of transparency is
important for improving planning and control in construction and when applying the Lean
concepts to construction projects. Through a synthesis of the literature on transparency,
Visual Management, the deficiencies of traditional Project Management and Lean
construction, gaps in application have been identified, which are addressed by this research
work. This synthesis of the literature clarifies the need for broader applications of Visual
Management for the planning and control of construction projects.
This chapter is organised around four specific areas: 1) Lean Production; to understand the
important principles and visual tools of the Toyota Production System (TPS) from which this
this research work originates and to explain why holistic thinking is important when
15
Management is currently applied to increase transparency and to understand what challenges
have been experienced when applying Visual Management to construction projects 3) the
deficiencies of traditional project management; to understand how the traditional conversion
model in construction contributes to a lack of transparency in projects and 4) Lean
Construction; to understand the benefits and challenges that have been faced when applying
the Lean concepts to construction projects. In particular, a closer look is taken at applications
of the Last Planner System, one of the most widely used systems for production planning and
control in construction, based on the Lean principles.
2.2
Lean production
The Toyota Production System (TPS) is the origin of lean production, which is based on five
important principles: Value, Value Stream, Flow, Pull and Perfection (Womack & Jones,
1996). Liker (2004, p.7) also emphasises the importance of these principles:
“To be a lean manufacturer, requires a way of thinking that focuses on making the product flow through value-adding processes without interruption (one-piece-flow), a pull system that cascades back from the customer demand by replenishing only what the next operation takes away at short intervals and a culture in which everyone is striving continuously to improve”.
The principle of Value is the starting point for the application of Lean Thinking: determining
the main characteristics of a product and what a customer is willing to pay for. This is also a
first step in the identification of waste in the process. The second principle is that of the Value
Stream: understanding the physical flows of material, people and information. Value Stream
Mapping, which was adapted by Rother & Shook (1999) is an important tool to visualise
material and information flow (Liker, 2004). The principle of flow refers to achieving the
optimal order of process activities, by reducing variability and irregularity (such as
bottlenecks) so that material and information may move in a predictable way within the
supply chain. Pull (together with flow) are regarded as the core characteristics of Lean
thinking and cornerstones for the elimination of waste. Toyota defines waste as any activity
that does not add value for the customer (Liker, 2004). The idea of pull is to produce only as
16
principle of perfection is closely related to the idea of continuous improvement - constantly
striving for perfection in processes.
[image:43.595.109.458.223.495.2]These principles are applied using the tools of the Toyota Production System illustrated in
Figure 2.1. Section 2.2.1 presents the tools and techniques that make up the TPS.
Figure 2.1: The TPS house (Liker, 2004, p. 33)
2.2.1
The TPS: tools and techniques
The TPS house (Figure 2.1) is a symbol illustrating the various tools and techniques that have
been developed and practiced for decades by Toyota. It has become one of the most
recognisable symbols in modern manufacturing and was created initially by Toyotas past
president, Fujio Cho, working closely with former Toyota engineer and executive Taiichi
Best Quality– Lowest Cost – Shortest Lead Time –
Best Safety– High Morale
Through shortening the production flow by eliminating waste
Just-in-Time
Right part, right amount, right time
•Takt time planning • Continuous flow
• Pull system •Quick changeover •Integrated logistics
Jidoka
(In-station-quality) Make problems visable
•Automatic stops •Andon •Person-machine
Separation •Error proofing •In-station quality control
•Solve root cause of Problems (5 whys)
People & Teamwork
• Selection • Common
goals
• Ringi decision making • Cross-trained
Waste Reduction
• Genchi Genbutsu • 5 Whys
• Eyes for waste • Problem solving
Continuous Improvement
Leveled Production(heijunka)
Stable and Standardised Processes
Visual Management
Toyota Way Philosophy
Best Quality– Lowest Cost – Shortest Lead Time –
Best Safety– High Morale
Through shortening the production flow by eliminating waste
Just-in-Time
Right part, right amount, right time
•Takt time planning • Continuous flow
• Pull system •Quick changeover •Integrated logistics
Jidoka
(In-station-quality) Make problems visable
•Automatic stops •Andon •Person-machine
Separation •Error proofing •In-station quality control
•Solve root cause of Problems (5 whys)
People & Teamwork
• Selection • Common
goals
• Ringi decision making • Cross-trained
Waste Reduction
• Genchi Genbutsu • 5 Whys
• Eyes for waste • Problem solving
Continuous Improvement
Leveled Production(heijunka)
Stable and Standardised Processes
Visual Management
17
Ohno, to support the teaching of TPS to suppliers of the company. Different versions of the
TPS house exist today but the core principles remain the same.
The roof of the TPS house represents the goals of an organisation: best quality, lowest cost,
shortest lead-time. The two outside pillars represent the concepts of Just-In-Time (producing
the right quantity and in time) and Jidoka (automatically recognising quality issues).
Just-In-Time in turn can be achieved by applying a number of different tools:
Takt-Time: is the rhythm of customer demand. It is an indicator of how much
time is available to produce one part based on the operating time available and the
customer demand.
Kanban: is used to realise pull-production in small batches (Monden, 1998). It
relays information (on cards) with the intention of influencing behaviour (only the
specified quantity on the cards are delivered).
Continuous Flow: enabling material and information to flow fast as well as to
link processes and people together so that problems surface right away (Liker,
2004).
Quick Changeover: reducing the amount of time it takes to set up a machine to produce the next part (Liker, 2004).
Jidoka can be achieved by applying (Liker, 2004):
Automatic stops: a technique that allows machines to automatically stop when a
problem is detected. It attracts attention when there is a problem and prevents
further errors from happening by stopping the process.
Poke-Yoke: a physical device that prevents mistakes or calls attention to them by
stopping production (Liker, 2004). Its purpose is to eliminate product defects by
preventing, correcting, or drawing attention to process errors as they occur
18
Andon: is a signalling system which uses lights or flags to indicate that
equipment has shut down as a result of a quality problem (Liker, 2004).
5 Whys: understanding the root of the problem by asking “why” 5 times.
The two pillars of the TPS, JIT and Jidoka, are focused on creating transparency in
information so that the process participants have access to the important information that they
need to answer the six fundamental questions in a workplace which is what, how many, who,
when, how and where (Section 2.5.1; Galsworth, 2005, p.34-5).
The tools and techniques of the TPS are applied to help identify so-called “waste” in the
process. Toyota defines waste as any activity that does not add value for the customer and
identifies seven different types (Liker, 2004):
Overproduction: producing more than there is a demand for. Ohno considered
this to be the fundamental waste, since it contributes to most of the other wastes.
Waiting (time on hand): waiting for a machine, for material or information.
Unnecessary transport or conveyance: carrying work in process (WIP), moving
material.
Over processing: taking unneeded steps to process parts.
Excess inventory: excess raw material, WIP or finished goods, causing longer lead times, obsolescence, damaged goods, transportation and storage costs.
Unnecessary movement: any wasted motion that employees have to perform
during the course of their work.