Journal of Chemical and Pharmaceutical Research, 2016, 8(3):137-142
Research Article
ISSN : 0975-7384
CODEN(USA) : JCPRC5
Development and validation of stability-indicating RP-HPLC method for
estimation of Ziprasidone in bulk and their capsule dosage form
Faraat Ali
a*, Sandip Jana
b, Ramji Rathod
aand Ravendra Verma
aa
Indian Pharmacopoeia Laboratory, Indian Pharmacopoeia Commission, Ministry of Health and Family Welfare, Government of India, Sector 23, Raj Nagar, Ghaziabad, 201002
bBharat Institute of Technology, Mangapally, Ibrahimpatnam, 501510
_____________________________________________________________________________________________
ABSTRACT
A sensitive, simple, fast, accurate and precise reverse phase high performance liquid chromatographic (RP-HPLC) method has been developed for the estimation of ziprasidone hydrochloride (ZH) in bulk and pharmaceutical dosage forms. The method was developed to analyze by using agilent zorbax C-8 (4.6mm X 150mm, 5 µm) column, mobile phase consisting of methanol and potassium dihydrogen orthophosphate buffer at pH 3.0, the flow rate of 1.5 ml/min and detection wavelength 229 nm and eluted at 22.2 min. The linearity ranges were 25% to 150 % for Ziprasidone hydrochloride. Analytical method was validated according to the International conference on Hormonization (ICH) guidelines for various parameters like specificity, linearity, precision, accuracy, LOD, LOQ and system suitability. Validated method was applied to the commercially available pharmaceutical dosage forms and obtained the desired result. So the method can be successfully applied for routine analysis.
Keywords: Ziprasidone, Validation, Acetonitrile, HPLC.
_____________________________________________________________________________________________
INTRODUCTION
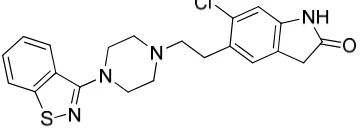
[image:1.595.208.389.580.648.2]Ziprasidone hydrochloride chemically is 5-[2-[4-(1, 2-benz Isothiazol-yl)-1- Piperazinyl] ethyl]-6-chloro-1, 3-dihydro-2H-Indol-2-one hydrochloride [Fig. 1]. It has an empirical formula of C21H22Cl2N4OS and molecular weight of 449.40 g/mol [1-2].
Fig. 1 Chemical Structure of Ziprasidone
Comprehensive literature survey revealed that various analytical methods have been reported for the determination of ZH by high-performance liquid chromatography [6-10], with ultraviolet detection [11-18], high-performance liquid chromatography tandem mass spectrometry [19-21] have also been presented.
To the best of our knowledge, there is no cost effective related substances RP-HPLC method for the estimation of ZH in pharmaceutical formulations. The aim of the present study was to develop and validate stability indicating HPLC method for the determination of ZH in pharmaceutical dosage form. In the present work author developed a simple, reproducible HPLC method which was validated by statistical parameters accuracy, precision. The developed method has been applied to the estimation of ZH in bulk and pharmaceutical dosage form.
EXPERIMENTAL SECTION
Pharmaceutical pure grade ZH gift sample was obtained from Sun Pharmaceuticals Ltd. Vadodara India. The ZH capsules containing 20 mg ZH were purchased from local pharmacy. HPLC grade acetonitrile, potassium dihydrogen orthophosphate and methanol were purchased from Merck Ltd. Mumbai.
Chromatographic conditions
The chromatographic separation was performed on Waters Acquity e2695 Series HPLC consisting autosampler, Pump, Autoinjector, integrated with Photodiode Array Detector. A reverse phase agilent zorbax C-8 (4.6mm X 150mm, 5 µm) column was used. Empower Pro software was used for data acquisition.
Mobile phase
The mobile phase consisting a mixture of buffer (pH = 3.0) and methanol, filtered through 0.22µ PTFE membrane filter and soniccate prior to use. The buffer was prepared by dissolving 2.46 gm of potassium dihydrogen orthophosphate in 2000 ml of water, adjust pH 3.0 with dilute orthophosphoric acid. A mixture of acetonitrile and water in the ratio 75:25 used as diluent. The flow rate was adjusted to 1.5ml/min and the injection volume was 10µL. The column temperature was 35 ̊C.
Standard preparation
Accurately weighed 10 mg of ZH working standard into 100 ml volumetric flask add 50 ml diluent and soniccate for 10 minute further make up the volume 100ml with diluent. Final concentration makes100 ppm.
Sample solution preparation
Crush the 20 tablets, weighed equivalent to 10 mg of ZH and transfer to 100ml volumetric flask and add 50 ml diluent and make up the volume 100ml with diluent. Further filter the solution through 0.22µ PTFE filter.
RESULTS AND DISCUSSION
Method development & optimization
HPLC method was optimized with an aim to develop an estimation procedure for ZH. For method optimization, different column and mobile phase were tried but acceptable retention time, good resolution and theoretical plates were observed with methanol and potassium dihydrogen orthophosphate buffer pH 3.0 by using agilent zorbax C-8 (4.6mm X 150mm, 5 µm)column.
Method validation System suitability test
System suitability is the primary part of the method validation to check the parameters like theoretical plates, tailing factor, resolution & percentage RSD of replicate injections. Results were within limits and were presented in Table 1.
Specificity
______________________________________________________________________________
Linearity
Calibration curve was created from the data of five different concentrations of standards solutions against mean peak area & regression equation was generated. The linearity was evaluated by measuring different concentrations (25%-150%) of the standard solutions to ZH. Results of the regression analysis and the coefficient of determination (r2) are listed in Table 2.
Accuracy
To determine the accuracy of the developed method recovery studies were conducted, known amount of drug concentrations was spiked in placebo at three different levels, i.e., 50%, 100%, 150% and was calculated. Accuracy was calculated as the % of recovery. The results were shown in Table 3.
Precision
The precision of the method was evaluated at three levels, reproducibility, repeatability and intermediate precision each level of precision was investigated by six replicate injections of concentrations 10µg/ml ZH. The result of precision was expressed as % of RSD and was shown in Table 4.
LOD and LOQ
The LOD and LOQ were found to be 0.41µg/ml and 1.26µg/ml for ZH. These data show that the method was highly sensitive and specific.
Robustness & ruggedness
To determine the robustness of the method by small changes in pH, flow rate, buffer & column temperature. The content of the drug was not unaffected by these changes. The ruggedness test was determined by different instrument, column, analyst & laboratories analysis of the same sample.
Analysis of marketed sample
The developed method was applied for the analysis of ZH in pharmaceutical dosage form. ZH was found to be between 99 to 101%. The results were shown in Table 5.
Stability indicating & forced degradation tests Stock solution
Accurately transfer about 10mg of ZH into individual 100 ml volumetric flask, add 50 ml of diluent and soniccate it. Further make up the volume 100ml with diluent. Final concentration makes 100ppm.
Alkali degradation
10 ml of 0.1N NaOH added to 10ml of stock solution & was kept at 80 ̊C for about 96 h in water bath, cool made up the volume 50 ml with diluent. Filter the solution 0.22µ membrane filter.
Acidic degradation
10 ml of 2 N HCl added to 10ml of stock solution & was kept at 80 ̊C for about 48 h in water bath, cool made up the volume 50 ml with diluent. Filter the solution 0.22µ membrane filter.
Oxidative degradation
10 ml of 3% H2O2 added to 10ml of stock solution & was kept at 80 ̊C for about 72 h in water bath, cool made up the volume 50 ml with diluent. Filter the solution 0.22µ membrane filter.
Thermal degradation
Forced degraded the sample exposed to UV light.
Collect the sample after first day, third day, fifth day & tenth day.
Table 1. System suitability results
Parameters Results
HETP (mm) 21.4
Retention Time,Rt(min) 22.2
Theoretical Plates 5671
Tailing factor 1.08
Table 2.Regression equation parameters
Linearity Correlation
µg/ml coefficient Slope Y-intercept
25-150 0.9997 28,217 -20,207
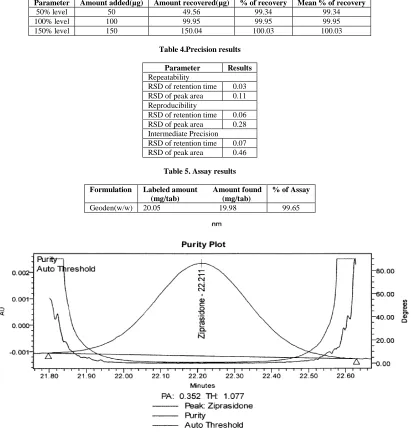
Table 3.Accuracy data (Triplicate values at 50, 100 & 150 percent levels)
Parameter Amount added(µg) Amount recovered(µg) % of recovery Mean % of recovery
50% level 50 49.56 99.34 99.34
100% level 100 99.95 99.95 99.95
[image:4.595.98.509.256.688.2]150% level 150 150.04 100.03 100.03
Table 4.Precision results
Parameter Results
Repeatability
RSD of retention time 0.03
RSD of peak area 0.11
Reproducibility
RSD of retention time 0.06
RSD of peak area 0.28
Intermediate Precision RSD of retention time 0.07
RSD of peak area 0.46
Table 5. Assay results
Formulation Labeled amount Amount found (mg/tab) (mg/tab)
% of Assay
Geoden(w/w) 20.05 19.98 99.65
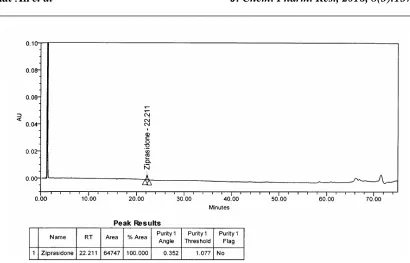
______________________________________________________________________________
Fig. 3 Chromatogram showing the response of after analytical method development
CONCLUSION
The chromatographic method validation for the estimation of ZH was simple, reliable, sensitive and less time consuming. The present method can be confidently used for rapid and precise estimation of ZH. This method may be recommended for routine and quality control analysis of the investigated drug. The developed method is specific and stability indicating. Hence this method is suitable, linear, accurate & robust for the estimation of ZH. The present work shows, a validated, highly sensitive method for determination of ZH.
Acknowledgement
The authors are thankful to Sun Pharmaceuticals, Vadodara for providing gift sample of the bulk drugs. The authors are also thankful to department of Pharmaceutical Analysis, Bharat Institute of Technology, Mangapally, Ibrahimpatnam, India, for their encouragement and lab facilities.
REFERENCES
[1] J.R. Kristin (Ed.), The Merck Index, 14th ed., Merck and Co., Inc, Whitehouse Station. NJ, 2013, p. 4336. [2] Gennao, A.R., 2000. Remington, The Science and Practice of Pharmacy, 20th ed. Lippincott, Williams & Wilkins, Baltimore, MD, Philadelphia.
[3] Brunton, L.L., Lazo, J.S., Parker, K.L., 2006, Goodman and Gilman’ The Pharmacological Basis of Therapeutics, 11th ed. Mc Graw-Hill, New York.
[4] Farina, C., Kremser, L., Raggi, M.A., Kenndler, E., 2008. Determination of ziprasidone in pharmaceutical formulations by capilla
[5] Pankaj K, Choudhary P, Oriental Journal of Chemistry 2006; 21:1. [6] Sudha Rani B, Seshagiri Rao JVLN, E Journal of Chemistry 2006; 3: 9‐12. [7] Sudha Rani B, Venkata Reddy P, E‐Journal of Chemistry 2006; 3: 169‐172. [8] Sachse J, Härtter S, , Ther Drug Monit 2005; 27: 158‐62.
[9] Zhang G, J Chromatogr B Analyt Technol Biomed Life Sci 2007; 856: 20‐8. [10] El‐Sherif ZA, Biomed Chromatogr 2004; 18:143‐149.
[11] Aravagiri M, Pollock B, J Chromatogr B Analyt Technol Biomed Life Sci 2007; 847:237‐44. [12] Aravagiri, Marder SR, Journal of chromatography 2007; 847: 2.
[15] Janiszewski J, Schneider RP, Mass Spectrom 1997; 11: 1033.
[16] Singh A, Rao BM, Despande GR, Sangaraju S, Srinivasu MK, Lalitha Devi M, Satyanarayana PVV, Chandrasekhar KB (2007) Chromatographia 65:199
[17] International Conference on Harmonization (ICH) Topic Q2A, Validation of Analytical Procedures, Methodology, CPMP/ICH/281, (1995).
[18] Sethi, P.D, High Performance Liquid Chromatography, CBS Publishers and Distributors, New Delhi, 1st Edn: 3-16, (2001).
[19] Snyder, L.R, Glajch, J.L, Kirkland, J.J, Practical HPLC Method Development, John Wiley & Sons, Inc, A Wiley-interscience Publication, USA, 2nd Edn: 2-9 (1997).
[20] Tripathi, K.D, Essentials of Medical Pharmacology, Jaypee Brothers Medical Publishers (P) Ltd, New Delhi, 6th Edn: 248-249, (2008).