79
Chapter 8
Flood Frequency Analysis at Ungauged Site
Using Modified Group Method of Data Handling
S. Ismail1, B. Badyalina2, A. Shabri3, N. A. Mat Jan4, S. M. Pandhiani5
1 Department of Mathematics and Statistics, Universiti Tun Hussein Onn
Malaysia, 86400 Parit Raja, Batu Pahat, Johor, Malaysia.
2,3,4 Department Department of Mathematics, Faculty of Science, Universiti
Teknologi Malaysia, 81310 Skudai, Johor Bahru, Johor,
[email protected],[email protected]
5 Department of General Studies, Jubail University College, Saudi Arabia. [email protected]
Abstract.Group Method of Data Handling (GMDH) have been
applied within the various field of modelling and recently has been used to predict flood quantile at ungauged site. The objective of this paper to enhance the performance of GMDH model as a prediction tools known as Modified Group Method of Data Handling (MGMDH). In MGMDH model, PCA is implemented to reduce the complexity of GMDH network which increasing by addition of new layer. This paper uses data obtains from Department of Irrigation and Drainage Malaysia to predict T-year flood events for 20 catchments across the Peninsular Malaysia. The MGMDH model is compared to linear regression (LR) and GMDH model. Three quantitative standard statistical indices such as Mean Absolute Error (MAE), Root Mean Square Error (RMSE) and Nash-Sutcliffe Coefficient of Efficiency (CE) are employed. Based on these results, it was found that the MGMDH model outperformed the LR and GMDH model based on prediction performances.
80
1
Introduction
Hydrology deals with the water cycle, and the water cycle profoundly affects all the features of the life on Earth. The obligation of a better knowledge and understanding of the hydrological mechanisms is not only a scientific quest, but also a need for a precise management of water resources. Ungauged catchments are those without enough hydrological observations (or measurements). The more straightforward method to analyze the catchment behavior is to study its streamflow time series and, eventually, other related variables, like precipitation, soil characteristics, vegetation, etc.
However, this approach requires the discharge time series to be known at the site of interest. When a direct river flow monitoring is not available or collected data are not adequate for the analysis, the basin is referred to as ungauged, and indirect methods are required to study its hydrological characteristics. In other words, hydrometric stations are not available in ungauged catchments or they became inactive.
Sivapalan et al. states ungauged catchments as the ones with inadequate records (in terms of both data quantity and quality) of hydrological observations [1]. Indirect procedures are based on the concept of information transfer from gauged to ungauged catchments, that has been summarized by the principle substitute time for space" proposed by the US National Research Council for hydro-meteorological modelling [2]. This principle underlines the idea of compensating the lack of time series records by using the data relative to other sites. The evaluation of the frequency of food events in ungauged catchments is usually approached by building suitable statistical relationships between flood statistics and catchments characteristics, based on a set of gauged stations.
Badyalina and Shabri introduced one of sub neural network model that is Group Method of Data Handling (GMDH) model used to make prediction of flood quantile at ungauged site [2]. GMDH model was initially established by Ivakhnenko as for identification and modeling of complex system [3]. The advantages of GMDH model are choosing significant input for the model automatically, short time model development, instinctive arrangement of model structure and enhanced prediction performance [4].
81 GMDH network. PCA usually used for dimensionality reduction of datasets and improve understanding of data but at the same time PCA also reducing information loss.
2
METHODOLOGY
2.1
Principal Component Analysis
On 1901, Karl Pearson introduced and popularized the method of Principal Component Analysis (PCA) as noise elimination method [6]. PCA is frequently used to eliminate noise in the data set by reducing the dimensionality of the data by finds new orthogonal principal components recognized as eigenvectors which explain most of the data variation in new data sets. PCA is one of the statistical approach where it is aimed convert the complexity of variables with large size of information into new uncorrelated variables known as principal components. PCA generates multiple principal components where it actually a linear combination that represent actual data.
1 11 1 12 2 1
2 21 1 22 2 2
3 31 1 32 2 3
31 1 32 2 3
M M
M M
M M
M M M
PCA b X b X b X
PCA b X b X b X
PCA b X b X b X
PCA b X b X b X
2.2
Modified Group Method of Data Handling
As stated before, principal component (PCA) analysis is implemented in modified group method of data handling. By doing this, the performance of the original group method of data handling (GMDH) model can be improved. The MGMDH model is specified as follow.
Step 1: Input variables X
x1,x2,...,xM
is selected where the input82 Step 2: The input variables used principal component analysis (PCA) for dimensionality reduction. PCA produce pnumber of principal component. The principal components were selected based on scree plot on PCA. The number of principal component selected become input for MGMDH model. The new input variables are
V
v
1,
v
2,...,
v
p
.Step 3: Partial description (PD) that chosen for MGMDH model id second order quadratic polynomial. L number of PD constructed on the current layer L p
p1
/2.
L
l
v
a
v
a
v
v
a
v
a
v
a
a
v
v
G
z
t i j i j i j i j,..,
2
,
1
for
,
5 22 4 3 2 1 0
(1)Step 4: The vector of coefficient of PD is estimated by least square method.
Step 5: The best PD is chosen as the new input variable for next layer of MGMDH model based on MSE value produce by each PD. After the new input variables is determine, the whole MGMDH process is repeated again until MSE of PD shown an improvement and then the process is terminated. The PD produce minimum MSE value from previous layer is use.
y z
k Lp
MSE p
i i ik
k for 1,2,...,
1
1
2
,
(2)3
Case Study
83 Malaysia [8]. Table 1 shows the descriptive statistics for catchments characteristics.
Table 1: Descriptive Statistics of Catchments Characteristics
Variables Min Mean Max STD
AREA [km2] 30 1613.4625 19000 4226.4642 ELV [m] 5 149.057 1450 320.3647 LDP [m] 3800 33536.2500 280000 62667.2245 SLP [%] 0.0096 0.5299 2.5571 0.5563 AMR [mm] 723.0000 2050.1000 3149.8000 491.7256
[m3/s] 16.0595 564.1513 5238.5499 1310.8477 [m3/s] 21.7751 668.8378 6042.9699 1501.0300 [m3/s] 32.7404 806.9790 6928.2605 1713.5693
3.1 Results and Discussion
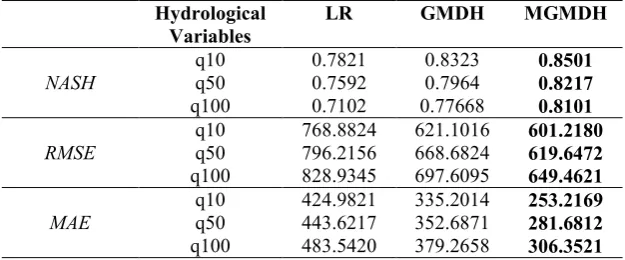
Modified group method of data handling (MGMDH) were obtained from combining PCA and GMDH. GMDH model has an inclination to produce a complex polynomial or large number of partial description because of setting new input at each layer. Therefore, the complexity of GMDH model is increasing at each layer because of addition of new layer. Therefore, PCA was proposed and applied in MGMDH model to overcome the deficiency in GMDH model where PCA used in GMDH model to reduce its complexity. The best principal component to represent the data, the K1 method proposed by Kaiser is applied [10]. MGMDH model was then compared to two other comparison models that are LR and GMDH models. Results on Table 2 shows MGMDH model outperformed other two comparison models.
Table 2. Jackknife Validation Result of LR, GMDH and MGMDH Model
Hydrological Variables
LR GMDH MGMDH
NASH
q10 0.7821 0.8323 0.8501
q50 0.7592 0.7964 0.8217
q100 0.7102 0.77668 0.8101
RMSE q10 q50 768.8824 796.2156 621.1016 668.6824 601.2180 619.6472
q100 828.9345 697.6095 649.4621
MAE q10 q50 424.9821 443.6217 335.2014 352.6871 253.2169 281.6812
q100 483.5420 379.2658 306.3521
10
Q
50
Q
100
[image:5.595.140.453.544.674.2]84
4
Conclusions
The proposed model is a combination of PCA and GMDH model. The MGMDH model used for flood quantile estimation at ungauged site. Then MGMDH model used create a relationship between flood quantiles and characteristics of catchment. MGMDH model transfer the information from gauged station to ungauged station. Therefore, the flow at ungauged station can be estimated although no recorded flow history data. In term of estimation precision, MGMDH beat LR and GMDH model. Based on the result, the proposed model can be used for flow estimation at ungauged site.
Acknowledgement. The authors thankfully acknowledged the financial support that was afforded by Universiti Teknologi Malaysia under GUP Grant (VOT 4F681). Besides that, the authors would like to thank the Department of Irrigation and Drainage, Ministry of Natural Resources and Environment, Malaysia, in helping us to provide the data.
References
1. Sivapalan, M. (2003) Prediction in ungauged basins: a grand challenge for theoretical hydrology. Hydrological Processes 17(15):3163-3170.
2. Badyalina, B. and Shabri, A. (2015) Flood Frequency Analysis at Ungauged Site Using Group Method of Data Handling and Canonical Correlation
Analysis. Modern Applied Science 9(6):48-55.
3. Ivakhnenko A. G. (1971) Polynomial theory of complex systems. IEEE Transactions on Systems, Man, and Cybernetics.1(4), 364-78.
4. Abdel-Aal R. E. (2004) GMDH-based feature ranking and selection for improved classification of medical data. Journal of Biomedical Informatics 38(6), 456-468.
5. Onwubolu, G. (2008) Modelling and predicting surface roughness in turning operations using hybrid differential evolution and the group method of data handling networks. Proceedings of the Institution of Mechanical Engineers, Part B: Journal of Engineering Manufacture, 222(7), 785-79.
6. Pandey, G. R. and Nguyen, V. T. V. (1999) A comparative study of regression based methods in regional flood frequency analysis. Journal of Hydrology 225(1–2), 92-10.
7. Shu, C. and Ourda, T. B. M. J. (2007) Flood frequency analysis at ungauged sites using artificial neural networks in canonical correlation analysis physiographic space. Water Resources Research 43:1-12.